Market Overview
| Study Period | 2020 - 2030 |
|---|---|
| Forecast Data Period | 2025 - 2030 |
| Historical Data Period | 2020 - 2023 |
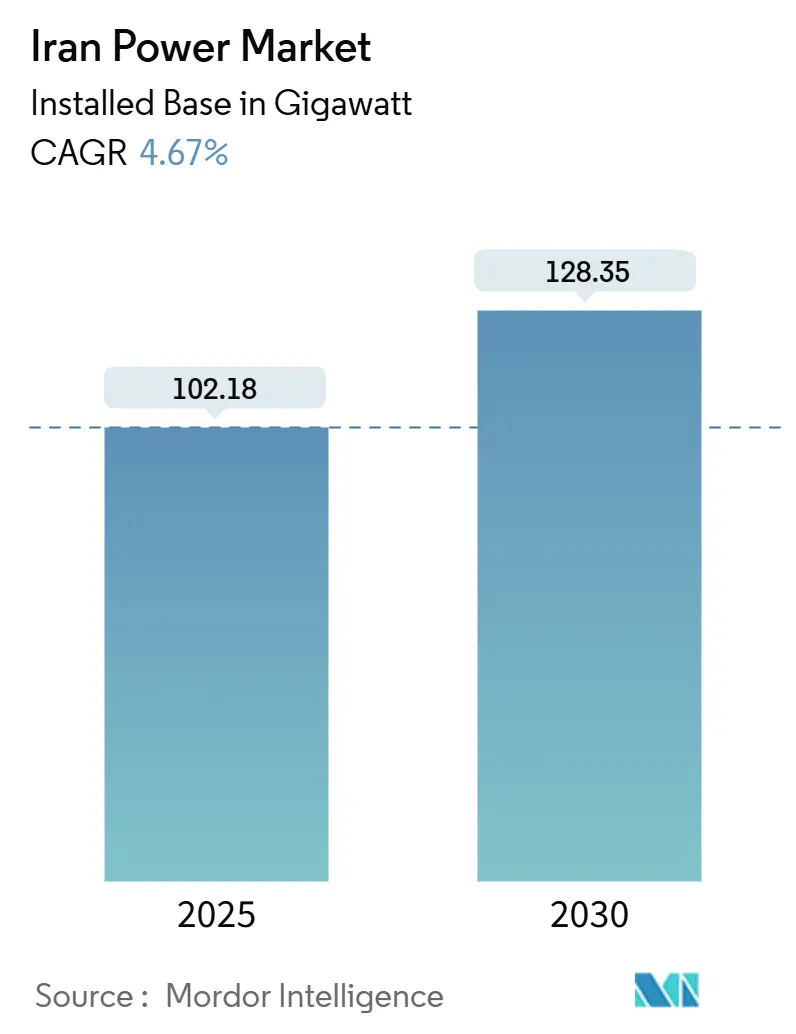
| Market Volume (2025) | 102.18 gigawatt |
| Market Volume (2030) | 128.35 gigawatt |
| Growth Rate (2025 - 2030) | 4.67% CAGR |
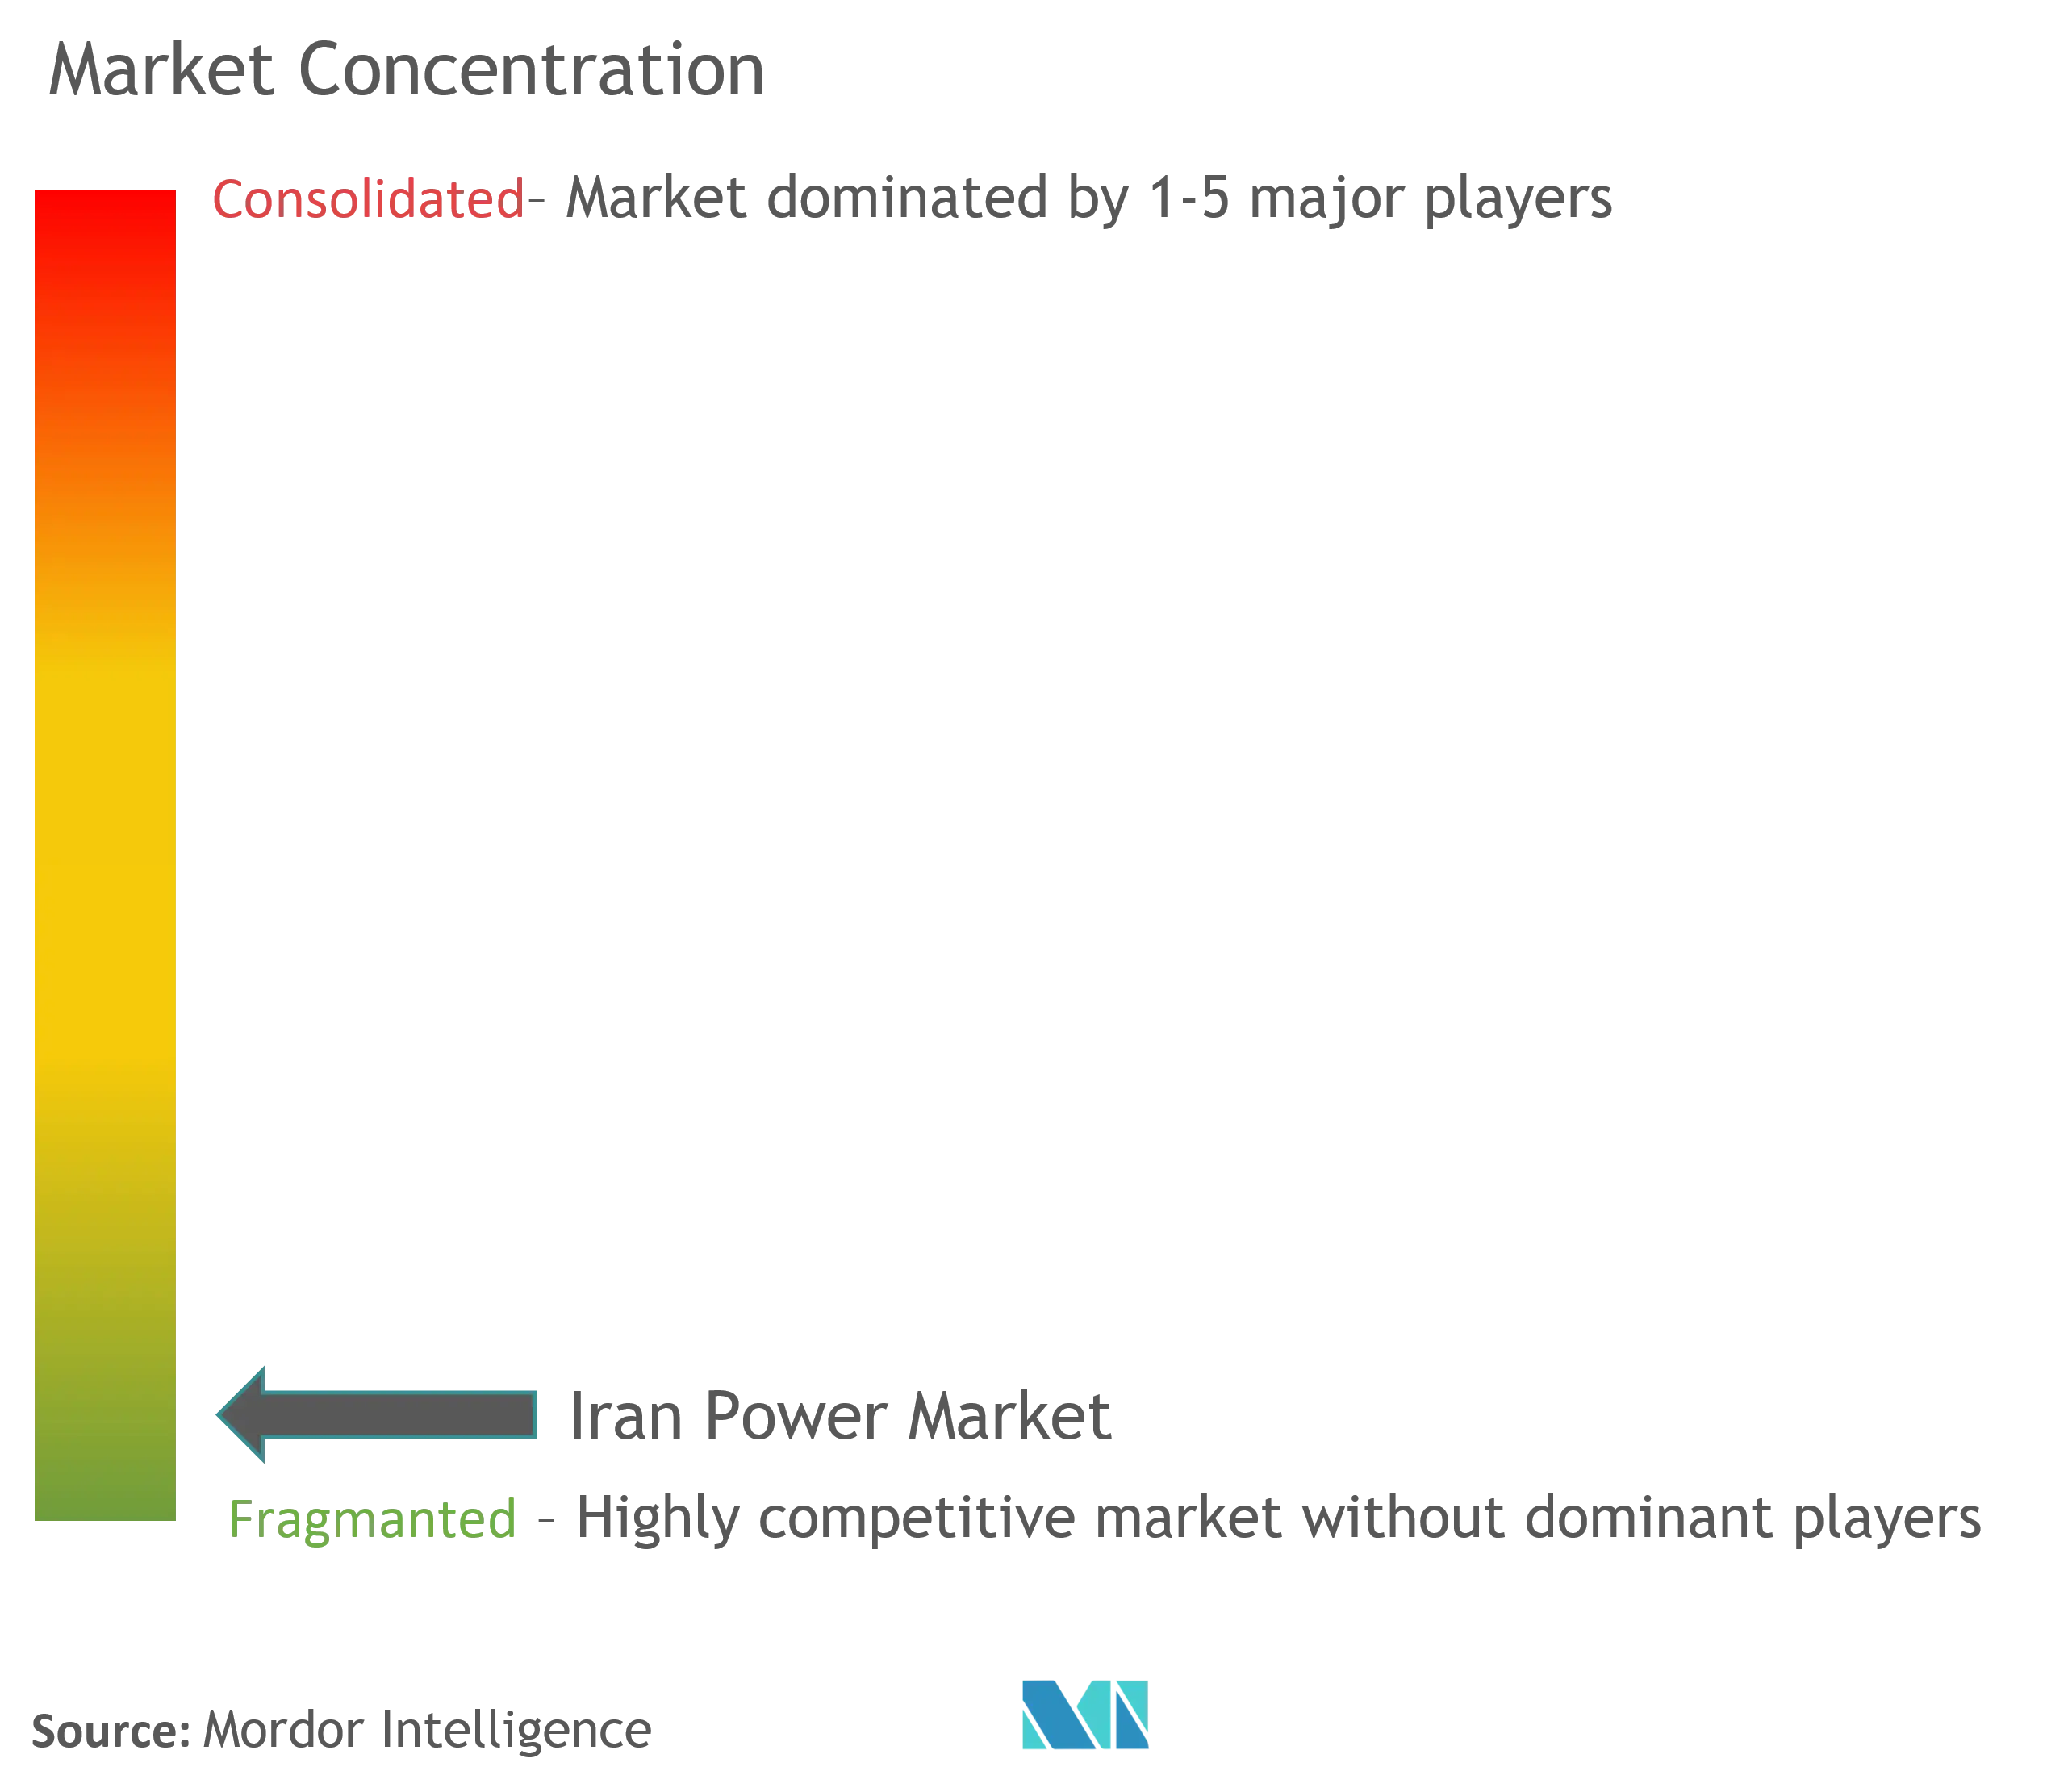
| Market Concentration | Low |
Major Players
*Disclaimer: Major Players sorted in no particular order Image © Mordor Intelligence. Reuse requires attribution under CC BY 4.0. |
|
Iran Power Market Analysis by Mordor Intelligence
The Iran Power Market size in terms of installed base is expected to grow from 102.18 gigawatt in 2025 to 128.35 gigawatt by 2030, at a CAGR of 4.67% during the forecast period (2025-2030).
Sustained base-load demand, a shift toward high-efficiency combined-cycle gas units, and the resurgence of nuclear buildouts underpin this outlook, despite persistent sanctions. A new generation of utility-scale solar parks, growing industrial self-generation, and flare-gas conversion projects further expand the Iranian power market while easing pressure on natural-gas reserves. Local equipment suppliers such as MAPNA shorten procurement cycles, shielding projects from import bottlenecks. Concurrent tariff reforms that raised residential rates by 38–83% redirect subsidy savings toward grid upgrades, smart meters, and rooftop incentives, strengthening long-term fundamentals of the Iranian power market.
Key Report Takeaways
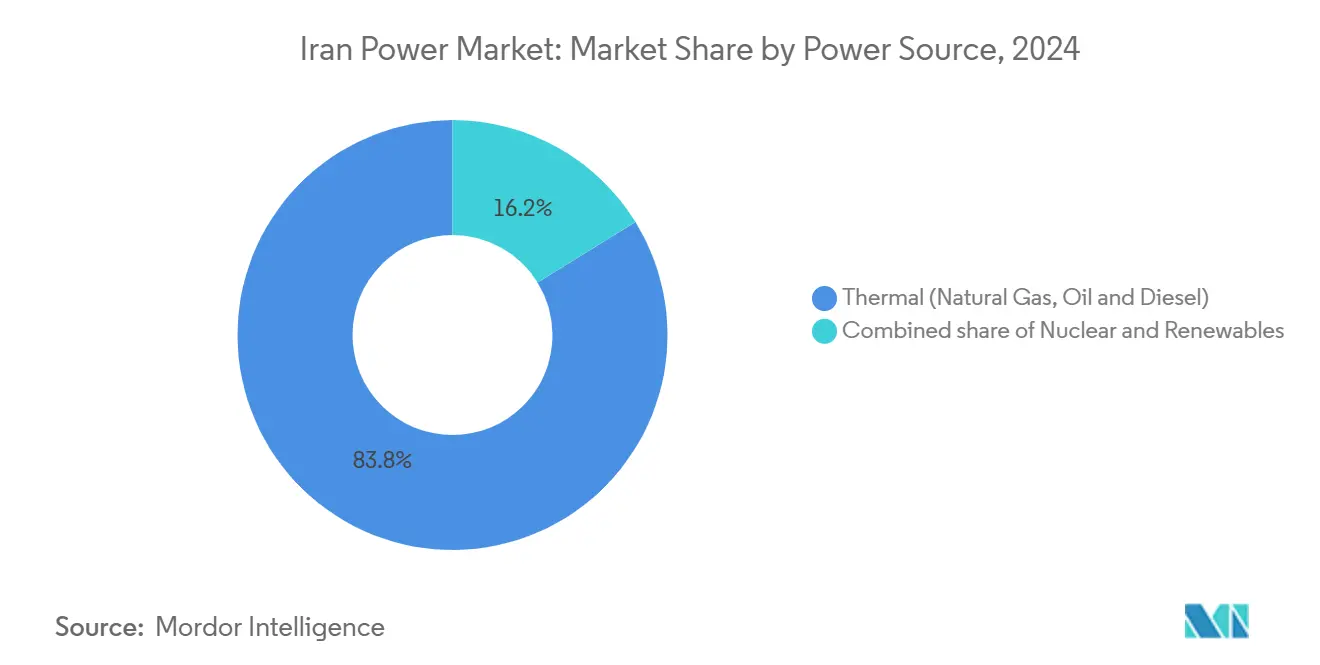
- By power source, thermal plants held 83.8% of the Iranian power market share in 2024, while nuclear capacity is projected to expand at a 15.3% CAGR through 2030.
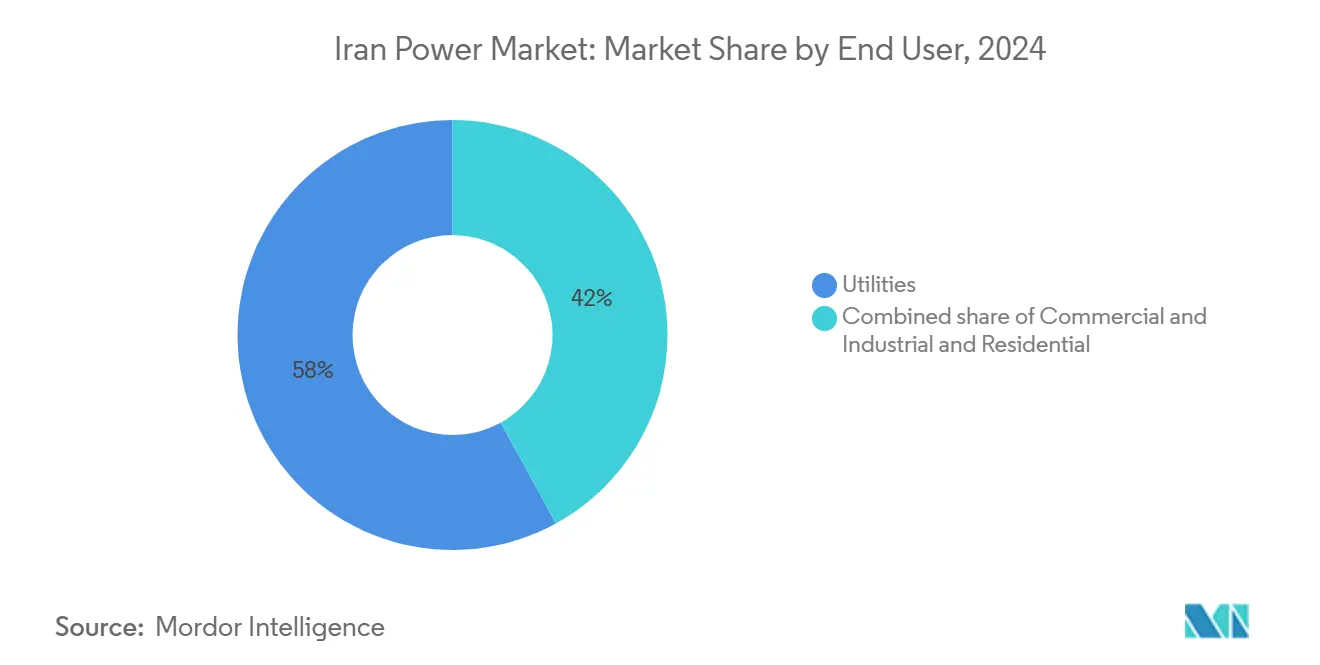
- By end-user, utilities captured 58.0% of the Iranian power market size in 2024; commercial and industrial consumers are expected to advance at a 5.9% CAGR through 2030.
Iran Power Market Trends and Insights
Drivers Impact Analysis*
| Driver | (~) % Impact on CAGR Forecast | Geographic Relevance | Impact Timeline |
|---|---|---|---|
| Growing power demand | +1.7% | Tehran, Isfahan, Khuzestan | Medium term (2–4 years) |
| Fast-track renewable capacity auctions | +1.1% | High-solar provinces | Long term (≥4 years) |
| Gas-flaring-to-power programmes | +0.7% | Khuzestan, Fars | Short term (≤2 years) |
| Distributed solar push after subsidy reforms | +0.5% | Rural and nomadic areas | Medium term (2–4 years) |
| Source: Mordor Intelligence | |||
Growing Power Demand Drives Infrastructure Expansion
Peak demand reached 67,012 MW in 2024, surpassing the previous record by 3,700 MW and indicating a strong demographic and industrial recovery.[1]Iran Grid Management Company, “Demand bulletin,” irangrid.ir Heatwaves, which pushed temperatures above 41 °C, boosted cooling loads, while electricity use for manufacturing rose 7.5% year on year. The Energy Ministry aims to add 35 GW of new capacity within four years, comprising 15 GW of gas turbines and 10 GW of renewable energy sources, financed by the National Development Fund. Transmission planners are strengthening the 765 kV backbones that route southern gas-fired output into the capital, thereby reducing curtailment risks. The International Energy Agency estimates total generation at 382.87 TWh in 2023, a 4.3% increase from 2022, validating stronger foundations for the Iranian power market.
Fast-Track Renewable Capacity Auctions Accelerate Market Transformation
SATBA issued permits for 29 GW of solar capacity after compressing bid cycles to 90 days and indexing tariffs to consumer inflation. Operational solar additions reached 600 MW in the past year, four times the 2017–23 average, as land-lease holidays and ten-year PPA extensions attracted private capital. Provinces like Semnan and Kerman now host China-backed high-tech module lines that increase local content, enhancing the bankability of projects supplying the Iranian power market. United Nations modeling indicates that achieving the 30 GW renewable target by 2030 will require approximately USD 9–10 billion in grid investment, a level deemed feasible under the current auction pace.[2]United Nations, “Renewable roadmap 2030,” un.org
Gas-Flaring-to-Power Programmes Address Resource Waste
Iran flares 17.5 billion m³ of gas annually, second worldwide, prompting mandatory capture orders at South Pars and Rag-Sefid fields.[3]World Bank, “Global gas flaring statistics,” worldbank.org Pilot generators, totaling 250 MW, already feed isolated grids, saving USD 180 million in diesel imports each year and reducing CO₂ emissions. Economic studies indicate that installed costs are below USD 500/kW when existing pipelines are reused, a benchmark that supports a 3 GW national target by 2027. These projects enhance voltage stability in oil-producing provinces, thereby reinforcing the resilience of the Iranian power market.
Distributed Solar Push Gains Momentum Following Subsidy Reforms
Subsidy rationalization raised household tariffs by up to 83% in 2024, reducing the Treasury’s USD 80-100 billion burden and lowering the payback period for rooftop installations to under five years. Households can net-meter up to 20 kW at a guaranteed 20-year rate, and nomadic families receive 90% grants for 800 W portable kits. Industrial sites are granted curtailment exemptions if on-site renewables cover 30% of their load, spurring 1.2 GW of captive solar deals with steel and petrochemical firms. Banks classify rooftop arrays as priority credit, offering 4% loans that lifted residential solar installs by 20,000 systems in 2024, broadening the consumer footprint of the Iranian power market.
Restraints Impact Analysis*
| Restraint | (~) % Impact on CAGR Forecast | Geographic Relevance | Impact Timeline |
|---|---|---|---|
| US-led sanctions curbing foreign investment | -1.4% | National, affecting all major projects | Long term (≥ 4 years) |
| Currency volatility inflating CAPEX | -0.8% | National, particularly affecting imports | Short term (≤ 2 years) |
| Aging grid causing >14% technical losses | -0.7% | National distribution network | Medium term (2-4 years) |
| Water stress limiting thermal cooling | -0.5% | Thermal plants nationwide | Medium term (2-4 years) |
| Source: Mordor Intelligence | |||
US-Led Sanctions Constrain Foreign Investment and Technology Access
Foreign direct investment declined to USD 5 billion in 2024, as secondary sanctions deterred Western lenders, exacerbating a 14 GW capacity shortfall.[4]Investment Desk, “Sanctions impact update,” iraninternational.com Restrictions on turbine-blade imports and project insurance delay commissioning timelines by 18%. Tehran offsets gaps with barter deals from Chinese and Russian suppliers, though premiums inflate EPC costs by 12–15% relative to regional peers. Domestic firms, such as MAPNA, cover 5% of grid demand with locally produced F-class turbines, thereby protecting the Iranian power market from complete external dependency.
Currency Volatility Inflates Capital Expenditure Requirements
The rial depreciated by 35% against the United States dollar in 2024, increasing imported PV module costs to USD 0.41/W compared to USD 0.27/W in the region. SATBA now pegs tariff escalators to the blended FX rate and endorses tax-free green bonds to hedge developers. A joint venture in Isfahan produces 350 MW of bifacial modules annually, reducing project CAPEX by 8% and minimizing FX leakage. Wind power progress remains slower because imported pitch controls still dominate, yet localized supply chains shield the Iranian power market from further price shocks.
*Our forecasts treat driver/restraint impacts as directional, not additive. The impact forecasts reflect baseline growth, mix effects, and variable interactions.
Segment Analysis
By Power Source: Thermal Strength Meets Nuclear Momentum
The Iranian power market size for generation assets remains dominated by thermal plants, which supplied 83.8% of electricity in 2024.[5]U.S. Energy Information Administration, “Iran country brief,” eia.gov Gas units alone account for 25.3% of capacity, and a USD 2.5 billion conversion program is upgrading seven single-cycle stations to combined-cycle, adding 2.5 GW and reducing heat rates to 6,800 Btu/kWh. Water scarcity, with Tehran reservoirs at only 13% of live storage, sometimes forces reliance on mazut, which increases emissions and operational costs.
Nuclear is the fastest-growing source, advancing at a 15.3% CAGR. Bushehr Units 2 and 3 employ 5,000 workers and target completion within the decade, while the 300 MW Karun small-modular reactor broke ground in 2023. The Atomic Energy Organization plans 20 GW by 2041, an ambition that, if realized, will diversify the Iranian power market and displace roughly 140 million barrels of oil equivalent annually.
Renewables complement this trajectory. Solar capacity is expected to rise from 608 MW to 4 GW by March 2026, led by the 600 MW Aftab-e-Sharq park, which saw the first 20 MW synchronized in October 2024. Solar now accounts for 60% of operational renewables, wind for 2%, and small hydro for 8%. Geothermal momentum is emerging with athe installation of 5 MW unit in Meshginshahr, the first of a proposed 250 MW cluster.


By End User: Utilities Anchor Demand, Industries Accelerate
Utilities delivered 58.0% of 2024 sales, reflecting centralized dispatch by 16 regional companies and 42 distributors that manage the bulk of the Iranian power market.[6]CIGRÉ, "Présentation PowerPoint," cigre.org The FAHAM smart-meter rollout covers 8 million endpoints and aims to reduce technical losses below 10% by 2027.
Commercial and industrial facilities accounted for 41% of consumption and are expected to grow at a 5.9% CAGR, as exemptions for self-generators shield factories from rolling blackouts. Contracts totaling 6 GW link MAPNA turbines to metal, petrochemical, and data center clusters, underscoring the deep industrial integration in the Iranian power market. Residential buyers account for approximately 24% of delivered energy; tariff hikes spur conservation and accelerate rooftop solar adoption, as evidenced by the installation of 20,000 new home systems in 2024.
Geography Analysis
Tehran province accounted for nearly one-fifth of the national demand in 2024, with a peak load up 3 GW year-over-year. Despite priority upgrades, low-income districts continue to endure four-hour blackouts, while affluent zones remain lit, highlighting social equity risks.
Khuzestan hosts oil, gas, and the 300 MW Karun SMR, positioning the province as both a hub for hydrocarbons and nuclear energy. Flare-gas generators add 250 MW to regional feeders, strengthening the resilience of the Iranian power market.
Isfahan leads the way in renewables through the 600 MW Aftab-e-Sharq solar array, which, when completed, will significantly increase provincial renewable penetration above 15%. Northern Caspian provinces face a 28% decline in reservoir inflow, which hampers both hydro and thermal cooling, prompting power swaps from southern gas hubs.
Rural and nomadic regions have benefited from 28,000 portable solar kits distributed since 2019, increasing rural electrification to 83.9% and generating surplus energy for virtual power plants. Southern coastal zones, which are subjected to 41 °C summers, rank highest for utility-scale battery pilots that shave evening ramps, thereby advancing the flexibility of the Iranian power market.
Competitive Landscape
State entities dominate generation, yet private players gain a share in renewables and industrial self-generation. MAPNA covers 5% of the grid load through F-class turbines and serves as the EPC for the 600 MW Aftab-e-Sharq plant, demonstrating its vertical strength in the Iranian power market.[7]Corporate Brief, “MAPNA turbines overview,” mapnagroup.com
Tavanir operates transmission and dispatch, while SATBA steers renewable auctions that have licensed 29 GW of solar since 2025. TPPHC invests USD 2.5 billion in combined-cycle retrofits, utilizing domestic HRSG units that cut reliance on imported alloys.
Emerging opportunities cluster around distributed storage, IoT-driven outage analytics, and solid-state transformers that lower technical losses. Turkish and Malaysian suppliers navigate sanction carve-outs through joint ventures, pairing imported inverters with Iranian steel and cabling. Venture funds back micro-grid controllers, marking a shift toward technology-heavy segments of the Iranian power market.
Iran Power Industry Leaders
-
Tavanir (Coordinated holding for state GENCOs)
-
MAPNA Group
-
Iran Water & Power Resources Dev. Co.
-
Besat Power Generation Mgmt Co.
-
Saba Power Plant Co.
- *Disclaimer: Major Players sorted in no particular order

Recent Industry Developments
- May 2025: Bushehr completed refueling, while Iran confirmed drilling for West Asia’s first 5 MW geothermal pilot.
- February 2025: A 3 MW commercial rooftop solar project broke ground in Tehran under a fast-track licensing process.
- January 2025: Bushehr expansion set a single-day concrete record of 22,000 m³ for Units 2 & 3, employing 5,000 workers.
- October 2024: MAPNA synchronized the first 20 MW block of the 600 MW Aftab-e-Sharq solar farm, resulting in a 168,000 m³ gas savings per hour.
- July 2024: Iran and Turkmenistan signed a 10 billion cubic meters (bcm) gas-swap deal, which will feed Iraq, boosting regional cooperation.


Iran Power Market Report Scope
Power is generated through various primary sources, including coal, hydro, solar, and thermal. In utilities, it is a step before its delivery to its end users. The process is followed by transmission and distribution. Under this, the power generated is distributed via high-voltage lines (transmission lines) and low-voltage lines (distribution lines) according to the end user's requirements.
The Iranian power market is segmented by generation source, transmission and distribution, and end-user. By power source, the market is segmented into natural gas, oil, renewables, nuclear, and other generation sources. By end-user, the market is segmented into residential, commercial, and industrial. The report provides market size and forecasts for installed capacity across all the aforementioned segments.
By Power Source
| Thermal (Coal, Natural Gas, Oil and Diesel) |
| Nuclear |
| Renewables (Solar, Wind, Hydro, Geothermal, Biomass & Waste, Tidal) |
By End User
| Utilities |
| Commercial and Industrial |
| Residential |
By T&D Voltage Level (Qualitative Analysis only)
| High-Voltage Transmission (Above 230 kV) |
| Sub-Transmission (69 to 161 kV) |
| Medium-Voltage Distribution (13.2 to 34.5 kV) |
| Low-Voltage Distribution (Up to 1 kV) |
| By Power Source | Thermal (Coal, Natural Gas, Oil and Diesel) |
| Nuclear | |
| Renewables (Solar, Wind, Hydro, Geothermal, Biomass & Waste, Tidal) | |
| By End User | Utilities |
| Commercial and Industrial | |
| Residential | |
| By T&D Voltage Level (Qualitative Analysis only) | High-Voltage Transmission (Above 230 kV) |
| Sub-Transmission (69 to 161 kV) | |
| Medium-Voltage Distribution (13.2 to 34.5 kV) | |
| Low-Voltage Distribution (Up to 1 kV) |


Key Questions Answered in the Report
What is the current installed capacity of the Iran power market in 2025?
Capacity totals 102.18 GW across all generation sources.
How fast will the Iran power market grow by 2030?
Installed capacity is forecast to rise to 128.35 GW, a 4.67% CAGR.
Which generation source is expanding most rapidly?
Nuclear capacity is projected to grow at a 15.3% CAGR through 2030.
Why are tariffs rising for residential users?
Subsidy reforms lifted rates by up to 83%, freeing funds for grid upgrades and spurring rooftop solar adoption.
How much renewable capacity has Iran permitted recently?
SATBA has licensed 29 GW of solar projects since early 2025.
What opportunities exist for private entrants?
Captive industrial solar, flare-gas generation, utility-scale storage, and smart-meter analytics present high-growth niches.
Page last updated on:


