Connected Enterprise Market Size and Share
Market Overview
| Study Period | 2020 - 2031 |
|---|---|
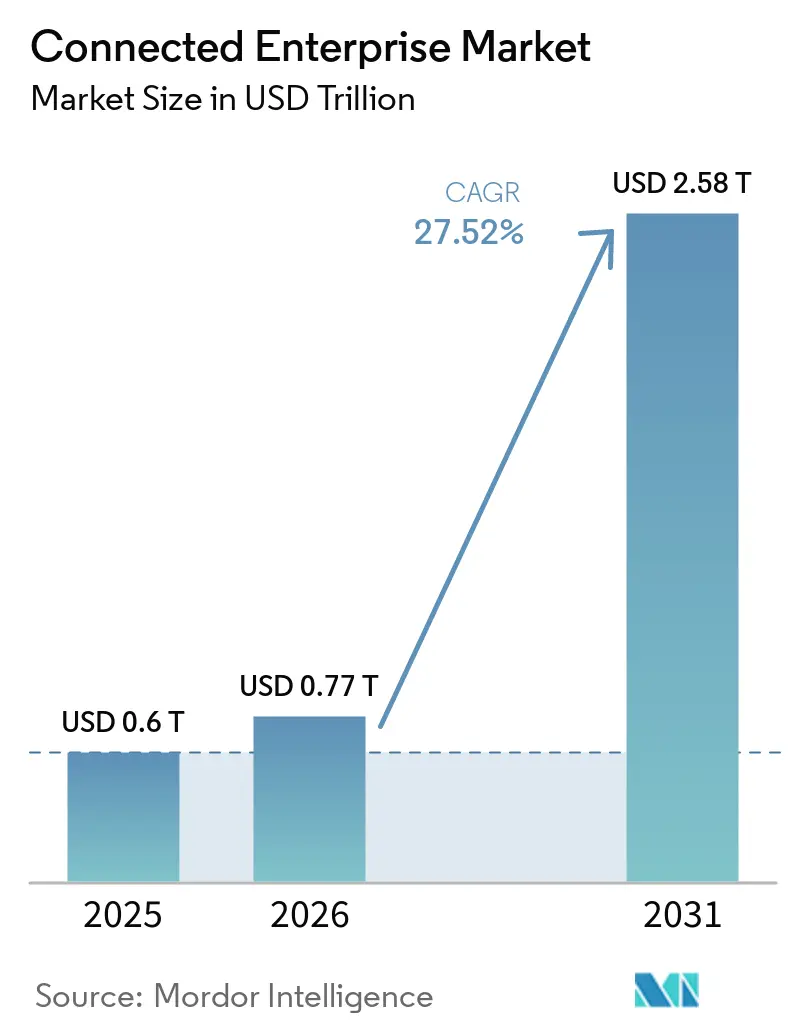
| Market Size (2026) | USD 0.77 Trillion |
| Market Size (2031) | USD 2.58 Trillion |
| Growth Rate (2026 - 2031) | 27.52% CAGR |
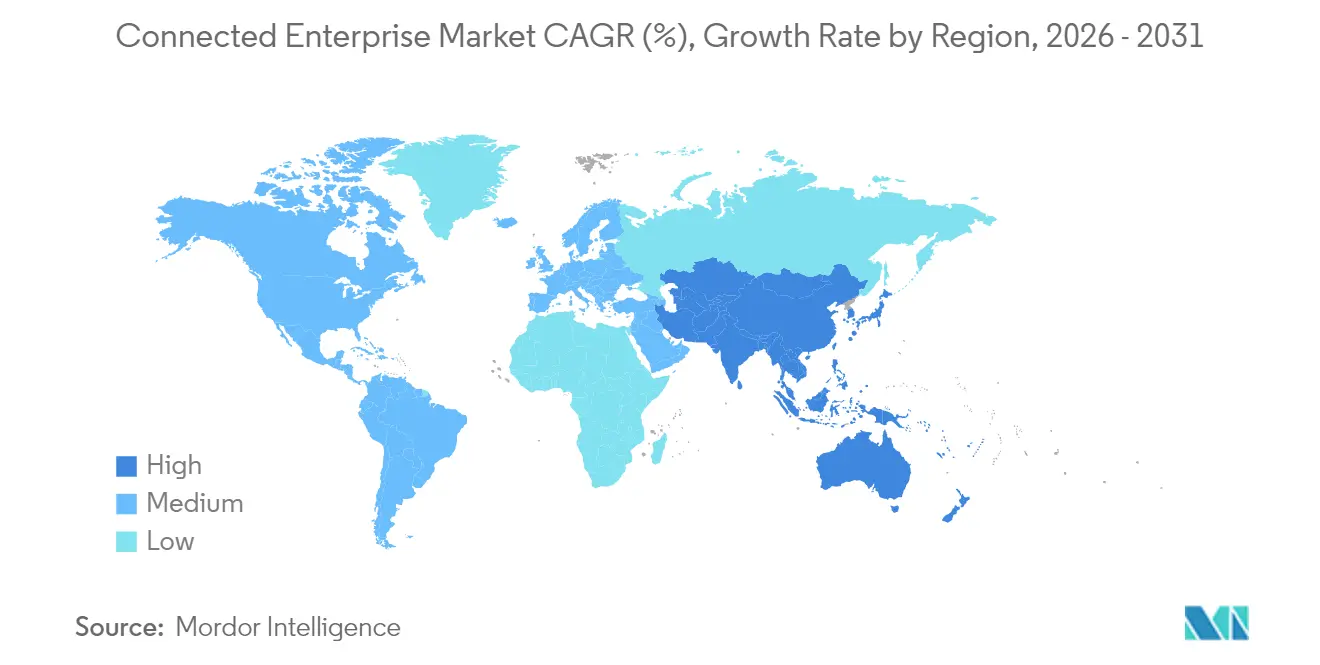
| Fastest Growing Market | Asia Pacific |
| Largest Market | North America |
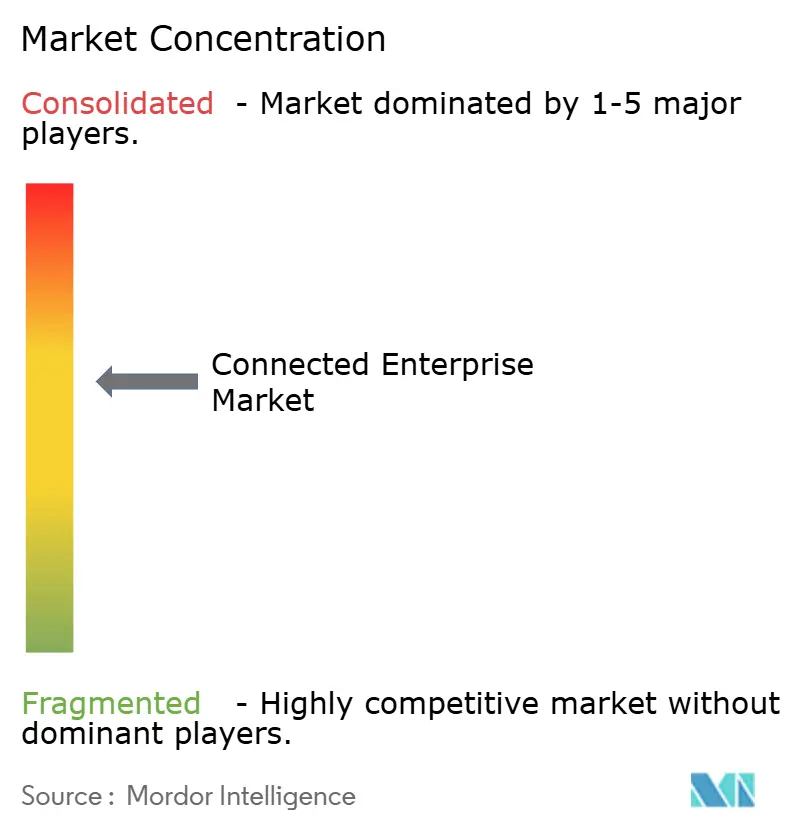
| Market Concentration | Medium |
Major Players *Disclaimer: Major Players sorted in no particular order Image © Mordor Intelligence. Reuse requires attribution under CC BY 4.0. | |
Connected Enterprise Market Analysis by Mordor Intelligence
Connected Enterprise Market size in 2026 is estimated at USD 0.77 trillion, growing from 2025 value of USD 0.6 trillion with 2031 projections showing USD 2.58 trillion, growing at 27.52% CAGR over 2026-2031. Demand rises as industrial companies weave edge-to-cloud IoT, private 5G, and generative AI into unified operating models that cut downtime, raise throughput, and automate decisions at scale. Early adopters are moving beyond point projects; they are building enterprise platforms that span shop-floor, supply chain, and customer channels, replacing siloed automation with data-driven orchestration. Private 5G provides deterministic wireless performance for mobile robotics and safety-critical tasks, while cloud-native iPaaS simplifies secure data movement between operational-technology (OT) and information-technology (IT) systems. Vendors now compete through ecosystems: platform providers team with automation specialists and telecom operators so that enterprises can deploy modular capabilities without locking into single-supplier roadmaps. Rising ESG disclosure requirements add another growth vector, because digital twins and sensor networks quantify emissions that regulators and investors increasingly scrutinize. [1]Microsoft, “Microsoft Cloud and AI Strength Drives Third Quarter Results,” news.microsoft.com
Key Report Takeaways
- By offering, solutions led with 50.72% of connected enterprise market share in 2025; platforms are set to expand at a 30.12% CAGR through 2031.
- By deployment mode, cloud accounted for 53.02% of the connected enterprise market size in 2025, while hybrid architectures will climb at 30.86% CAGR to 2031.
- By end-user vertical, manufacturing held 28.12% revenue share in 2025; oil and gas is projected to grow fastest at 29.68% CAGR through 2031.
- By enterprise size, large enterprises commanded 65.74% of value in 2025, yet SMEs will post the highest 31.95% CAGR to 2031.
- By connectivity, Wi-Fi/Ethernet captured 39.78% of the connected enterprise market share in 2025; private 5G networks are forecast to surge at a 32.34% CAGR.
- By geography, North America led wa ith 36.62% share in 2025, whereas Asia-Pacific will acceleratea at 32.05% CAGR through 2031.
Note: Market size and forecast figures in this report are generated using Mordor Intelligence’s proprietary estimation framework, updated with the latest available data and insights as of 2026.
Global Connected Enterprise Market Trends and Insights
Drivers Impact Analysis*
| Driver | (~)% Impact on CAGR Forecast | Geographic Relevance | Impact Timeline |
|---|---|---|---|
| Industrial IoT device proliferation | +6.2% | Global; APAC deployment strongest | Medium term (2-4 years) |
| Cloud-native adoption and iPaaS growth | +5.8% | North America, EU early; APAC rising | Short term (≤ 2 years) |
| Real-time supply-chain visibility | +4.9% | Manufacturing hubs worldwide | Medium term (2-4 years) |
| Private 5G for deterministic latency | +4.1% | North America and APAC pioneers | Long term (≥ 4 years) |
| GenAI-powered autonomous enterprise workflows | +3.7% | North America and EU leading, selective APAC | Long term (≥ 4 years) |
| ESG-linked digital twins for emissions reporting | +2.8% | EU regulatory driven, expanding globally | Medium term (2-4 years) |
| Source: Mordor Intelligence | |||
Proliferation of Industrial IoT Devices and Sensors
Mounting sensor deployments are rewriting factory economics. A leading tyre producer saved INR 1 crore (USD 120,000) daily by linking machine-learning models with legacy assets, then lifted daily passenger-tyre output from 68,000 to 73,000 units without new equipment. [2]ET Manufacturing, “Machine Learning and AI Save INR 1 Crore for Apollo Tyres Daily,” manufacturing.economictimes.indiatimes.com Edge processors close feedback loops locally, so anomalies trigger instant actions instead of waiting for round-trip cloud calls. Retrofit kits cost less than wholesale replacement, letting operators extend gear life while feeding predictive-maintenance engines. Equipment makers monetise performance insights as subscription services, unlocking fresh revenue that cushions hardware cycles. This widespread sensor adoption is the single biggest feedstock for connected enterprise market growth.
Cloud-Native Adoption and iPaaS Expansion
Enterprises are shifting heavy workloads to cloud-native stacks that auto-scale across regions and burst compute on demand. Microsoft’s intelligent cloud segment logged USD 42.4 billion revenue in Q1 2025, buoyed by industrial IoT and analytics workloads. Integration Platform as a Service unifies hundreds of OT protocols with enterprise applications, allowing material-traceability events to update ERP, MES, and transport systems in real time. Vendors now sell outcome-based contracts that guarantee uptime or energy savings instead of selling servers or licences, shifting risk toward suppliers but cementing multiyear revenue. Open APIs reduce vendor lock-in and accelerate competitive sourcing, an added driver for the connected enterprise market.
Real-Time Supply-Chain Visibility Needs
Pandemic hangovers and geopolitical shocks exposed brittle supply networks, so companies instrument pallets, containers, and production lines with RFID and IoT trackers. Food producers, for example, prepare for the FDA’s FSMA 204 mandate that forces unit-level traceability by January 2026. AI engines ingest this flood of data to foresee port congestion or material shortages, then reroute shipments or swap suppliers autonomously, cutting working capital and stock-out risk. Boards treat visibility platforms as strategic assets rather than cost centres, reinforcing spend even under budget pressure.
Private 5G Networks Enabling Deterministic Latency
Industrial firms deploy private 5G because Wi-Fi falls short for mobile robotics, drone inspection, and safety-instrumented systems. Ericsson’s field studies show upstream energy sites generating strong ROI once hands-free devices and real-time video operate on private spectrum. Nokia found adopters reaping productivity gains and accident-rate reductions across process industries. Low-latency uplinks also unlock augmented-reality service manuals that trim technician training time. As spectrum licensing frameworks mature, private 5G will become the communications spine of the connected enterprise market.
Restraints Impact Analysis*
| Restraint | (~) % Impact on CAGR Forecast | Geographic Relevance | Impact Timeline |
|---|---|---|---|
| High capex for brownfield integration | -3.8% | Mature industrial regions worldwide | Short term (≤ 2 years) |
| Cybersecurity skills shortage | -2.9% | North America and EU acute | Medium term (2-4 years) |
| Fragmented device-firmware-update standards | -1.7% | Global, standardization efforts ongoing | Long term (≥ 4 years) |
| Data-ownership disputes in ESG audits | -1.2% | EU regulatory focus, expanding globally | Medium term (2-4 years) |
| Source: Mordor Intelligence | |||
High Capex for Brown-Field Integration
Retrofitting decades-old machinery with sensors, gateways, and secure remote access strains capital budgets. Integration can cost USD 12,000 per legacy asset, and each site runs dozens or hundreds of such machines. SMEs lack in-house engineering depth, so they rely on specialist integrators that charge premium rates, elongating payback cycles. Diverse industrial protocols inflate project scope because multiple gateways and custom middleware must coexist. Modular retrofit kits and open interface standards are emerging to curb spend, yet financing hurdles still delay many projects.
Cybersecurity Skills Shortage and Expanding Attack Surface
As OT and IT converge, every valve controller and warehouse robot becomes an internet-facing endpoint. Industrial sites already struggle to hire staff versed in both deterministic control systems and zero-trust network design. New EU laws such as NIS2 tighten breach-reporting timetables and raise fines, forcing companies to augment controls quickly. [3]World Economic Forum, “Cybersecurity Rules Saw Big Changes in 2024,” weforum.org Automated security-orchestration platforms lighten the load, yet they depend on vendor updates and threat-intel feeds, introducing fresh dependencies.
*Our forecasts treat driver/restraint impacts as directional, not additive. The impact forecasts reflect baseline growth, mix effects, and variable interactions.
Segment Analysis
By Offering: Platforms Drive Infrastructure Transformation
Solutions held 50.72% of connected enterprise market revenue in 2025, led by MES, EAM, and CX suites that digitalize discrete functions. Platforms, however, headline growth at a 30.12% CAGR as firms invest first in data fabrics and device-management layers before layering analytics. In 2026, the platforms slice is forecast to add USD 49.1 billion, signalling a structural pivot toward backbone investments. The connected enterprise market size for platforms is projected to widen sharply because multi-tenant architectures let vendors amortize R&D across customers while still offering tenant-twinned data boundaries. Services trail in absolute dollars but shift to outcome guarantees, where integrators shoulder performance risk.A platform-centric play allows enterprises to plug in AI inference, edge orchestration, and threat monitoring by API rather than by forklift upgrade. Device-lifecycle platforms simplify firmware patching across 100,000-plus assets, protecting uptime without site visits. As open-source frameworks mature, platforms will interoperate, letting buyers mix best-of-breed analytics with incumbent control systems instead of a rip-and-replace scenario. These shifts reinforce vendor ecosystems and spur new entrants that specialise in data-versioning, digital-twin orchestration, or role-based workflow configuration, deepening competition inside the connected enterprise market.


By Deployment Mode: Hybrid Architectures Gain Momentum
Cloud deployments formed 53.02% of the value in 2025 due to rapid scaling and pay-as-you-grow economics. Nevertheless, latency-sensitive or sovereign workloads have rekindled on-premises needs, sparking a 30.86% CAGR in hybrid solutions. The connected enterprise market size attributable to hybrid estates could top USD 1.14 trillion by 2031 as factories blend local edge nodes for sub-50 ms response with regional clouds for model training. Platform vendors now ship lightweight Kubernetes stacks that run PLC analytics beside the line, then sync summarized telemetry to centralized lakes.Hybrid blueprints mitigate egress costs, as only curated datasets leave the plant, and regulatory audits —such as Europe’s emerging AI Act —can verify lineage on site. Operators thus enjoy cloud elasticity without surrendering control. Suppliers are differentiating through orchestration layers that auto-place workloads wherever compute, storage, security, and cost targets align. Over the forecast, winning propositions will embed AI to forecast resource demand and rebalance capacity autonomously, further propelling the connected enterprise market.
By End-user Vertical: Oil and Gas Accelerates Digital Adoption
Manufacturing retained 28.12% connected enterprise market share in 2025, but energy majors now pursue digital twins, methane-leak detection, and predictive well maintenance, fueling a 29.68% CAGR in oil and gas. The connected enterprise market size accruing to that vertical is forecast to multiply sixfold by 2031 as operators couple edge AI with private 5G in hazardous zones. Regulatory pressure on flare reductions and carbon intensity quickens adoption, turning compliance capital into operational savings.Other asset-intensive sectors follow. Utilities deploy smart meters that stream encrypted load data every 15 minutes, enabling dynamic pricing. Retail chains convert stores into micro-fulfilment hubs where computer-vision robots collaborate with staff. BFSI pilots smart branches that adjust HVAC and staffing in response to occupancy sensors, lowering opex. Cross-industry momentum confirms that sector-specific templates shorten rollout times, enlarging total addressable spend inside the connected enterprise market.

By Enterprise Size: SMEs Drive Democratization
Large enterprises still dominate spending with a 65.74% share, yet SMEs register the fastest 31.95% CAGR because SaaS pricing, low-code configuration, and partner-delivered managed services lower technical barriers. In 2026 alone, SME subscriptions are expected to inject USD 40.6 billion of new revenue into the connected enterprise market. Pay-per-asset models let a midsize plastics plant pay monthly for energy-optimization AI without a capital drain. Vendors also offer try-and-scale bundles that start with a single line, then cascade across sites once ROI proves out.SME adoption spurs ecosystem innovation: regional ISVs package pre-built dashboards for niche regulations, while telecom operators bundle connectivity, security, and analytics under one invoice. These traction points expand geographic reach and diversify revenue away from Fortune 1000 dependence, broadening the customer base that sustains the connected enterprise market.
By Connectivity Technology: Private 5G Transforms Industrial Communications
Wi-Fi and wired Ethernet kept a 39.78% share in 2025 because fixed assets and low-bandwidth tasks remain cost sensitive. Private 5G, though, is surging at 32.34% CAGR as factories demand ultralow latency for mobile manipulators and safety-zone enforcement. The connected enterprise market size linked to private 5G is set to exceed USD 438 billion by 2031 as spectrum-leasing schemes simplify ownership. Operators like AIS in Thailand or Telkomsel in Indonesia now sell turnkey networks, including edge cores that converge IT traffic and Profinet over the same radio fabric.Multi-band radios handle Wi-Fi roaming and 5G side-links, allowing AGVs to cross coverage zones seamlessly. Deterministic scheduling guarantees packet delivery below 10 ms, so motion-control loops stay stable. Cyber-hardened slices keep OT separated from visitor Wi-Fi, reducing lateral-movement risk. These capabilities cement private 5G as a strategic enabler, widening vendor opportunity across radios, orchestration software, and managed-service bundles inside the connected enterprise market.
Geography Analysis
North America dominated with a 36.62% share in 2025, buoyed by early private-5G pilots, ample brownfield retrofits, and robust venture funding into industrial startups. Federal incentives for advanced manufacturing and clean-tech projects drive sensor deployments in battery plants and semiconductor fabs. Cloud hyperscalers headquartered in the region feed the value chain with AI-ready data lakes and low-code analytics that compress project timelines. Strategic pacts such as Rockwell Automation’s expanded alliance with Microsoft integrate factory control and cloud inferencing, accelerating adoption.
Asia-Pacific is on a steeper 32.05% CAGR curve, propelled by continued industrialization and state-led smart-manufacturing programs. China’s push for price-competitive automation drives local OEM innovation, while India’s Production-Linked Incentive schemes entice multinationals to build connected greenfield plants. 5G coverage now blankets 75% of urban zones across Japan and South Korea, enabling fully wireless factories. Regional operators market private-network-as-a-service offers that bundle spectrum, edge compute, and cybersecurity, lowering barriers for mid-tier manufacturers. As a result, the connected enterprise market is likely to see Asia-Pacific overtake Europe in spend before 2029.
Europe holds a solid share anchored by stringent ESG and cybersecurity mandates. The Digital Operational Resilience Act forces financial institutions to harden OT/IT interfaces, while automotive OEMs invest in carbon-ledger twins to meet Scope 3 reporting duties. These rules spur demand for secure, auditable data pipelines, a hallmark of mature connected enterprise deployments. Meanwhile, the Middle East, Africa, and South America remain nascent but promising. Gulf energy players trial smart-refinery twins, Brazilian agribusiness outfits sensorize plantations, and South African miners test autonomous haulage backed by private LTE. As infrastructure gaps close, these regions will add incremental growth to the connected enterprise market without yet challenging the tri-continental leaders.

Competitive Landscape
The connected enterprise market is moderately fragmented. Industrial stalwarts such as Siemens, Rockwell Automation, and Honeywell leverage deep process know-how, while cloud majors —Microsoft, IBM, Amazon Web Services —offer scalable AI and data services. Cisco clinched Industrial IoT Company of the Year 2025 for fusing secure networking with edge compute. [4]Cisco, “Cisco Recognized as Industrial IoT Company of the Year 2025,” blogs.cisco.com Strategic pairings define competitive moves: Honeywell joined forces with Google Cloud to embed Gemini generative AI into alarm management; Emerson’s Project Beyond unifies data governance across control layers.
Patent filings around wireless sidelink and AI-driven network optimization from Meta, Qualcomm, and Samsung illustrate upstream innovation that will funnel into industrial offerings. Start-ups attack niches such as edge-to-cloud MLOps, low-code digital-twin modelling, and asset-centric cybersecurity. Incumbents react by acquiring specialist firms or launching venture arms to lock in technology moats. Because no single vendor controls more than 15% revenue, buyers craft multi-vendor architectures. Vendors that interoperate gracefully and deliver managed security services will gain share as cyber-risk rises across the connected enterprise market.
Connected Enterprise Industry Leaders
Microsoft Corporation
IBM Corporation
General Electric Company
Cisco Systems, Inc.
Rockwell Automation, Inc.
- *Disclaimer: Major Players sorted in no particular order

Recent Industry Developments
- June 2025: FairPrice Group opened its Store of Tomorrow with Google Cloud, deploying AI carts and video analytics to pilot 20 digital solutions yearly.
- May 2025: Emerson launched Project Beyond, a software-defined operations stack that blends control, data, and AI layers for autonomous plants.
- March 2025: Honeywell integrated Verizon 5G into smart meters, unlocking remote usage analytics for utilities.
- February 2025: Cisco secured the Industrial IoT Company of the Year 2025 accolade for industrial cybersecurity and AI readiness.
- January 2025: IFS posted EUR 1.228 billion revenue and EUR 1 billion ARR on 32% growth, underscoring demand for industrial AI suites.
- November 2024: Rockwell Automation and Microsoft expanded collaboration, rolling out Azure IoT Operations and generative-AI coding tools for PLC design.


Research Methodology Framework and Report Scope
Market Definitions and Key Coverage
Our study defines the connected enterprise market as all platform, solution, and managed service revenue that enables real-time information flow among equipment, employees, and enterprise systems through industrial IoT, secure networks, and data analytics. Mordor Intelligence counts value only once the capability is deployed inside an organization and begins generating operational data.
We deliberately omit commoditized network hardware, generic cloud hosting fees, and consumer smart-home devices that do not contribute to internal enterprise connectivity.
Segmentation Overview
- By Offering
- Platforms
- Device Management
- Connectivity Management
- Other Platforms
- Solutions
- Manufacturing Execution System
- Enterprise Infrastructure Management
- Customer Experience Management
- Remote Monitoring System
- Asset Performance Management
- Other Solutions (Streaming Analytics, Mobile Workforce, Security)
- Services
- Managed
- Professional
- Platforms
- By Deployment Mode
- On-premise
- Cloud
- Hybrid
- By End-user Vertical
- Manufacturing
- Energy and Utilities
- Oil and Gas
- BFSI
- Retail and E-Commerce
- IT and Telecommunications
- Other End-user Verticals
- By Enterprise Size
- Large Enterprises
- Small and Medium Enterprises (SMEs)
- By Connectivity Technology
- Wi-Fi/Ethernet
- Cellular (4G/LTE)
- Private 5G
- LPWAN (LoRaWAN, NB-IoT)
- By Geography
- North America
- United States
- Canada
- Mexico
- South America
- Brazil
- Argentina
- Chile
- Rest of South America
- Europe
- Germany
- United Kingdom
- France
- Italy
- Spain
- Russia
- Rest of Europe
- Asia-Pacific
- China
- India
- Japan
- South Korea
- Malaysia
- Singapore
- Australia
- Rest of Asia-Pacific
- Middle East and Africa
- Middle East
- United Arab Emirates
- Saudi Arabia
- Turkey
- Rest of Middle East
- Africa
- South Africa
- Nigeria
- Rest of Africa
- Middle East
- North America
Detailed Research Methodology and Data Validation
Primary Research
We engage digital transformation leads, system integrators, telco product managers, and factory IT heads in North America, Europe, and fast-growing Asian hubs. Their insights help Mordor analysts validate penetration assumptions, average contract sizes, and emerging use cases that secondary data alone cannot surface.
Desk Research
We begin with public sources such as the International Telecommunications Union, Eurostat, the NIST IoT program, and the Industrial Internet Consortium, which give device counts, standards updates, and adoption benchmarks. We add global trade statistics, connectivity patent families from Questel, and regulatory papers that map technology diffusion. Company 10-Ks, investor decks, and press releases, accessed through Factiva and D&B Hoovers, supply revenue splits and project pipelines. These inputs ground our historical series before any model run. The list above is illustrative; many additional sources were reviewed to confirm numbers and clarify definitions.
Market-Sizing & Forecasting
We start with enterprise IT spending pools and IoT device shipments, then apply penetration and average spend coefficients to isolate connected-enterprise outlays, which are cross-checked with sampled supplier rollups. Key variables include connected site counts, platform license ASPs, managed service attach rates, regional 5G enterprise subscriptions, annual smart-factory rollout numbers, and GDP-adjusted IT budgets. Multivariate regression and scenario analysis capture how macro cycles and technology pricing shifts affect these drivers, producing a balanced five-year outlook.
Data Validation & Update Cycle
Our outputs pass variance checks against independent KPIs, and anomalies trigger reruns before analyst sign-off. Reports refresh yearly, with interim updates issued when material events such as a regulatory mandate or major M&A move underlying metrics.
Why Mordor's Connected Enterprise Baseline Deserves Confidence
We acknowledge that published estimates often diverge because firms choose different cost elements, device cohorts, and refresh cadences. Our disciplined scope selection and mixed-method modeling keep totals anchored to measurable enterprise spending.
We find that key gap drivers include whether hardware is folded in, the age of the base year, and how aggressively future adoption ramps are projected. Some publishers uplift totals by layering generic network services, while others undercount by ignoring platform fees paid after year one.
Benchmark comparison
| Market Size | Anonymized source | Primary gap driver |
|---|---|---|
| USD 600 billion (2025) | Mordor Intelligence | |
| USD 602.44 billion (2024) | Global Consultancy A | Counts peripheral hardware and telco connectivity, which inflates base |
| USD 548.58 billion (2024) | Trade Journal B | Relies on press-release sampling with limited services coverage |
| USD 267.74 billion (2020) | Regional Consultancy C | Uses older base year and excludes cloud platform services |
Taken together, the comparison shows that once scope and timing are aligned, Mordor's carefully validated figure sits near the midpoint of credible possibilities, giving decision-makers a dependable starting point backed by transparent, repeatable steps.


Key Questions Answered in the Report
What is the current size of the connected enterprise market?
The Connected Enterprise Market is valued at USD 0.77 trillion in 2026
What compound annual growth rate is forecast for the connected enterprise market through 2031?
The market is projected to expand at a 27.52% CAGR between 2026 and 2031.
Which region currently leads global connected enterprise adoption?
North America holds the largest share at 36.62% in 2025, reflecting early private-5G rollouts and strong cloud investment.
Which industry vertical is forecast to grow fastest through 2031?
Oil and gas is expected to post the highest 29.68% CAGR as operators deploy emissions monitoring and safety-critical digital twins.
Why are private 5G networks seen as pivotal for connected enterprise deployments?
Private 5G delivers deterministic latency and secure mobility that enable mobile robotics, drone inspections, and augmented-reality maintenance in industrial settings.
What is the primary barrier slowing wider connected enterprise adoption?
High capital expenditure for retrofitting legacy brownfield equipment—often costing up to USD 12,000 per machine—remains the leading constraint on near-term rollout.
Page last updated on:


