Instrument Cluster Market Size and Share
Market Overview
| Study Period | 2019 - 2030 |
|---|---|
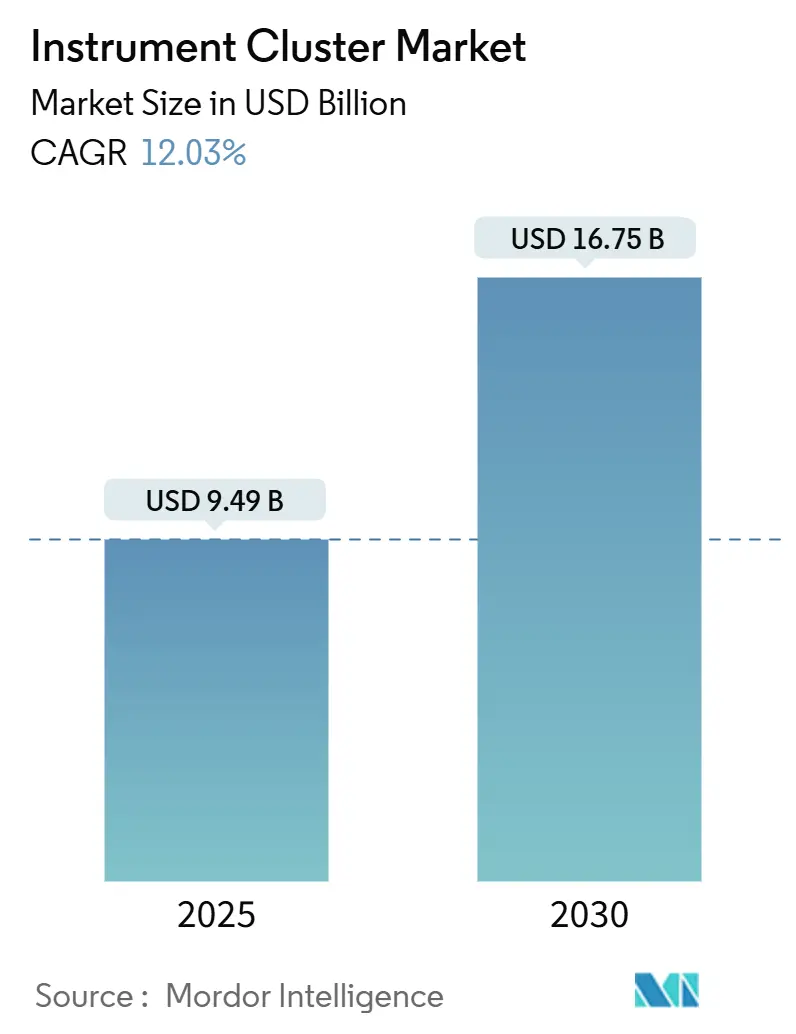
| Market Size (2025) | USD 9.49 Billion |
| Market Size (2030) | USD 16.75 Billion |
| Growth Rate (2025 - 2030) | 12.03% CAGR |
| Fastest Growing Market | Asia Pacific |
| Largest Market | North America |
| Market Concentration | Medium |
Major Players *Disclaimer: Major Players sorted in no particular order Image © Mordor Intelligence. Reuse requires attribution under CC BY 4.0. | |
Instrument Cluster Market Analysis by Mordor Intelligence
The instrument cluster market size stands at USD 9.49 billion in 2025 and is forecast to reach USD 16.75 billion by 2030, translating into a 12.03% CAGR for the review period. Robust spending on cockpit domain controllers, tightening safety regulations, and fast-rising electric vehicle (EV) penetration collectively reinforce demand growth. Suppliers accelerate their shift from analog gauges to reconfigurable screens to support software-defined vehicles, while falling thin-film-transistor (TFT) panel prices unlock larger displays for mid-range models. EV-specific telemetry, represented by BYD’s real-time power-flow graphics, widens the feature gap between legacy clusters and next-gen human-machine interfaces. Meanwhile, semiconductor supply remains a swing factor, with mature-node capacity shortages projected for 2025-2026 that could tighten the supply of cluster processors. OEMs and Tier-1s, therefore, continue to dual-source chips and invest in secure over-the-air (OTA) stacks that let them monetize cockpit software long after vehicle sale.
Key Report Takeaways
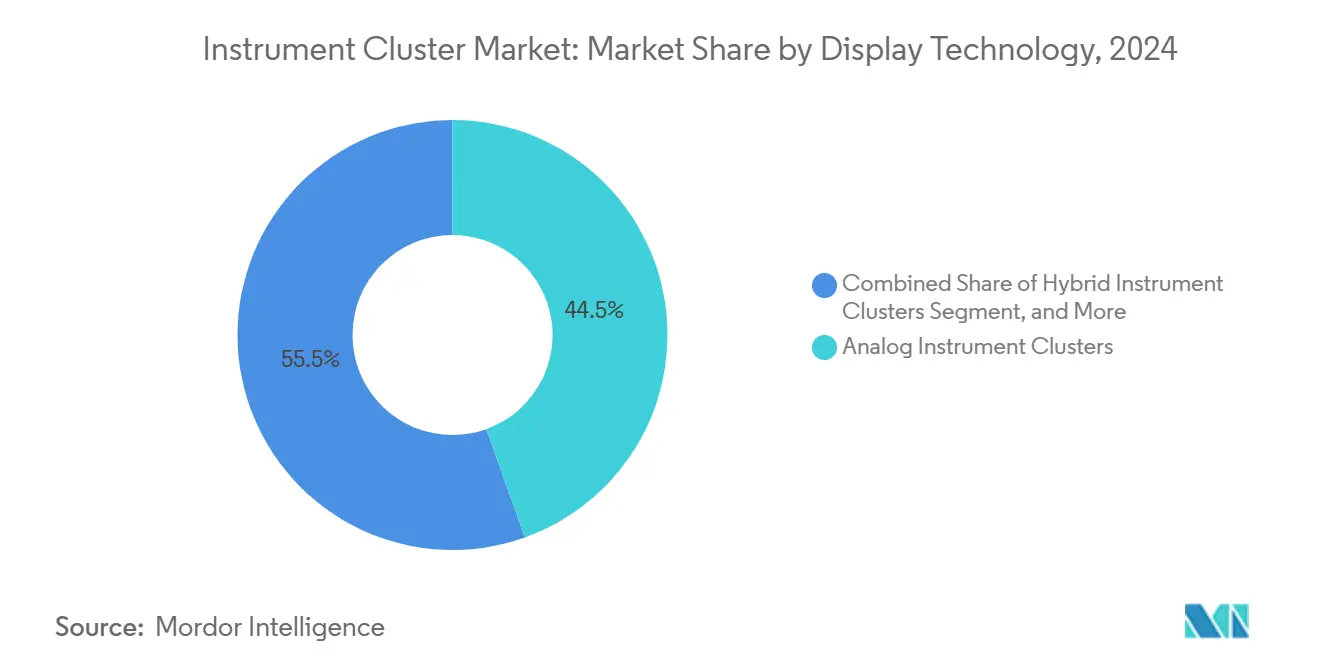
- By display technology, analog units retained 44.52% of the instrument cluster market share in 2024, whereas digital displays are advancing at a 13.44% CAGR through 2030.
- By vehicle type, passenger cars led with 69.73% revenue share in 2024; light commercial vehicles clocked the fastest 12.38% CAGR to 2030.
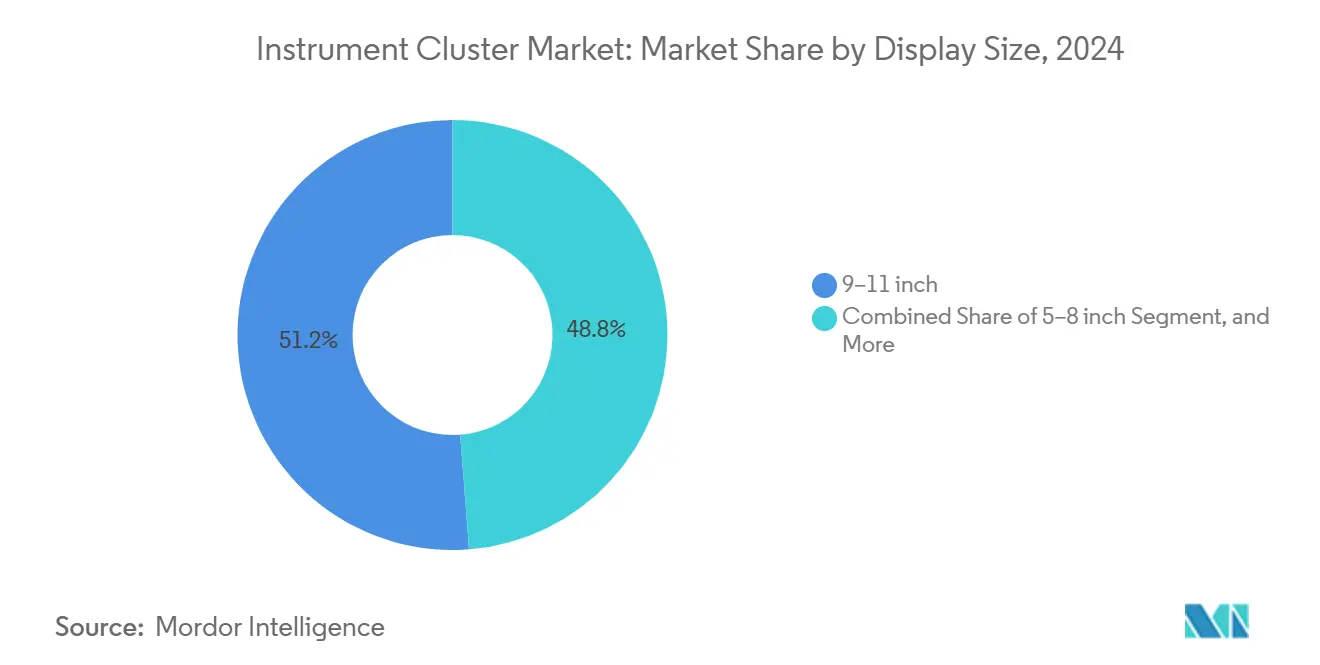
- By display size, 9-11-inch panels captured 51.22% of the instrument cluster market size in 2024, while screens over 12 inches are expanding at a 12.78% CAGR.
- By end user, OEM-fitted units dominated with 86.43% share in 2024; the aftermarket replacement segment grows at a 13.62% CAGR during 2025-2030.
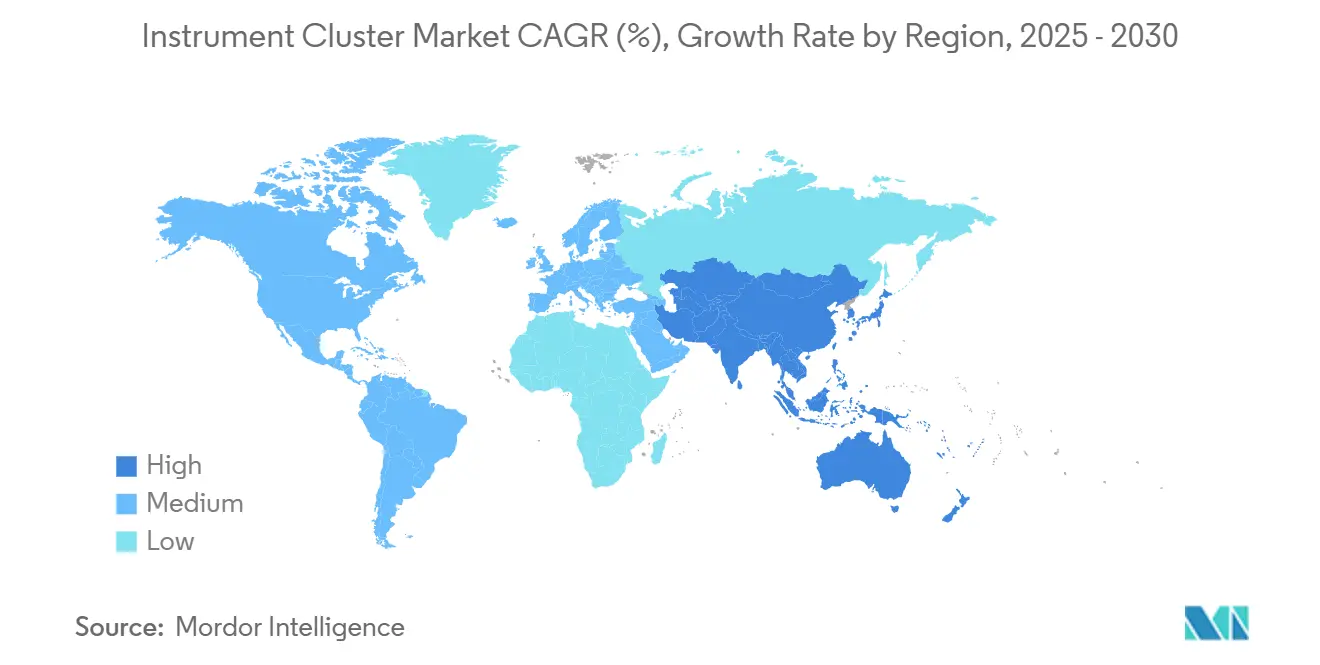
- By geography, North America commanded 34.87% of 2024 revenue, and Asia-Pacific is scaling at a 12.93% CAGR to 2030.
Global Instrument Cluster Market Trends and Insights
Drivers Impact Analysis*
| Driver | (~) % Impact on CAGR Forecast | Geographic Relevance | Impact Timeline |
|---|---|---|---|
| Rapid shift from analog to digital clusters | +2.8% | Global, with early gains in North America, Europe | Medium term (2-4 years) |
| ADAS and safety-feature integration needs | +2.1% | North America and EU core, spill-over to Asia-Pacific | Long term (≥ 4 years) |
| EV-specific telemetry requirements | +1.9% | Global, concentrated in China, California, Norway | Medium term (2-4 years) |
| Declining TFT/LCD prices enabling large displays | +1.4% | Asia-Pacific core, expanding to global markets | Short term (≤ 2 years) |
| OTA-ready, software-defined architectures | +1.7% | Global, led by premium segments | Long term (≥ 4 years) |
| Low-cost AHL/Ethernet links lowering BOM | +1.2% | Global manufacturing hubs, cost-sensitive segments | Medium term (2-4 years) |
| Source: Mordor Intelligence | |||
Rapid Shift From Analog to Digital Clusters
OEM cockpit roadmaps increasingly favor fully digital clusters that deliver dynamic layouts, color-coded warnings, and phone-style personalization. Mazda’s 2024 CX-70 adopted Panasonic Automotive’s 12.3-inch full-display meter after the supplier booked JPY 485.5 billion (USD 3.55 billion) revenue from infotainment in 2024, underscoring the scale advantage of display-centric portfolios.[1]Panasonic Automotive, “Q1 2024 Financial Results – Automotive Systems Division,” panasonic.com The Japan Electronics and Information Technology Industries Association estimates automotive display shipments will grow from 193.066 million units in 2024 to 229.8 million by 2028, cementing screens as de facto cockpits. Compliance with ISO/TS 8231:2025 obligates suppliers to present driver-assistance data in prescribed color palettes and font sizes, accelerating the displacement of analog gauges.
ADAS and Safety-Feature Integration Needs
Lane-keeping, collision-avoidance, and blind-spot alerts must now reside in the driver’s forward field of view, making clusters a logical conduit. Hyundai Mobis fused its domain controller with ADAS computing inside M.VICS 5.0 to streamline human-machine interface logic, cutting wiring harness weight by 30%.[2]Hyundai Mobis, “M.VICS 5.0 Platform Launch Announcement,” mobis.co.kr ISO 23150:2023 mandates real-time sensor fusion display protocols, inflating validation workloads and favoring well-capitalized Tier-1s. Euro NCAP’s 2024 rulebook further dictates glance duration for emergency braking signals, forcing UI redesign around safety-first layouts.
EV-Specific Telemetry Requirements
Battery state-of-charge graphics, regenerative-brake meters, and predictive range gauges are now standard on EVs. The European Union’s Battery Data Sharing Regulation C/2025/4104 prescribes battery health and charging-status visibility, effectively mandating richer cluster graphics.[3]European Commission, “Battery Data Sharing Regulation C/2025/4104,” europa.eu BYD’s 2024 owner manuals highlight animated power-flow diagrams, while Dodge’s 2024 Charger Daytona SRT employs cell-temperature overlays to help drivers manage battery longevity. These requirements raise firmware complexity yet create differentiation opportunities for suppliers that master EV-centric UI logic.
OTA-Ready, Software-Defined Architectures
Continuous feature drops bolster brand stickiness and unlock post-sale revenue. Qualcomm’s latest Snapdragon Cockpit silicon runs Android Automotive OS, letting automakers deploy new navigation layers or subscription-based driver-assist widgets without hardware tweaks. TomTom’s 2024 extension with Mercedes-EQS Advanced showed OTA maps can refresh 3D cityscapes in real time, enhancing perceived vehicle value. The flip side is higher cybersecurity exposure, intensifying demand for ISO/SAE 21434-compliant secure-boot stacks.
Restraints Impact Analysis*
| Restraint | (~) % Impact on CAGR Forecast | Geographic Relevance | Impact Timeline |
|---|---|---|---|
| High R&D and BOM costs | -1.8% | Global, particularly affecting cost-sensitive segments | Medium term (2-4 years) |
| Cyber-security and compliance burden | -1.2% | Global, with stricter requirements in EU, North America | Long term (≥ 4 years) |
| Semi-conductor supply volatility | -1.5% | Global, concentrated in Asia-Pacific manufacturing hubs | Short term (≤ 2 years) |
| AR-HUD substitution threat | -0.9% | North America and EU premium segments, spill-over to Asia-Pacific | Long term (≥ 4 years) |
| Source: Mordor Intelligence | |||
High R&D and Bill of Materials Costs
A premium digital cluster can pack over USD 200 in semiconductor content, including multi-die system-on-chips and high-brightness panels. Visteon logged USD 1.4 billion in new business in Q1 2024 across 26 launches but noted 30-40% higher engineering budgets to meet ISO 26262 safety gates. Rising advanced-packaging fees and limited capacity at outsourced assembly houses have lifted per-wafer prices by double digits since 2023.
Cybersecurity and Compliance Burden
ISO/SAE 21434 now obligates continuous vulnerability monitoring, threat analysis, and incident response, adding specialists and run-time security services to program budgets. The U.S. NHTSA’s 2024 distraction guidelines cap average glance length at 1.5 seconds for primary driving tasks, narrowing design freedom. EU type-approval updates require electromagnetic-compatibility and penetration testing that can cost EUR 500,000-1,000,000 (USD 565,000-1.13 million) per platform.
*Our forecasts treat driver/restraint impacts as directional, not additive. The impact forecasts reflect baseline growth, mix effects, and variable interactions.
Segment Analysis
By Display Technology: Digital Gains Momentum as Costs Slide
Analog gauges retained the largest 44.52% slice of the instrument cluster market in 2024, yet digital clusters are tracking a 13.44% CAGR through 2030, signaling rapid substitution. Hybrid layouts bridge budget and feature gaps in mass-market trims. The instrument cluster market size for digital screens is on course to nearly double between 2025 and 2030, propelled by decreasing TFT panel prices and mandatory ADAS visualizations.
Volume growth and manufacturing scale have pushed 10-inch full-HD panel costs below USD 75 in 2025, clearing a margin path for mid-range sedans. AUO showcased transparent MicroLED prototypes at CES 2024, while VueReal’s MicroSolid Printing platform targets cost parity against LCD within three years. Although micro-OLED roadmaps promise superior contrast, thermal management, and lifetime hurdles keep them niche for now.


By Vehicle Type: Commercial Fleets Accelerate Digital Retrofits
Passenger cars generated 69.73% revenue in 2024, but fleet electrification pushes light commercial vehicles to a 12.38% CAGR, the highest among vehicle classes. The instrument cluster market share for fleet vans is expanding as logistics operators demand range-prediction tools and telematics dashboards on-screen.
Domain controllers let truck OEMs integrate tachograph data, driver fatigue alerts, and ADAS warnings into one display, shaving wiring mass and simplifying regulatory audits. Growth potential also stems from pay-per-feature software models that monetize fleet uptime analytics.
By Display Size: Large Screens Signal Premium Intent
Panels between 9-11 inches controlled 51.22% revenue in 2024, balancing ergonomics and cost. Displays above 12 inches, often spanning pillar-to-pillar dashboards, log a 12.78% CAGR. Enlarging real estate lets OEMs fuse cluster and infotainment functions, lowering part count. Innolux and Japan Display will mass-produce 32-inch OLED cockpits by 2027 for luxury flagships.
Optical bonding, anti-reflective coatings, and high-resolution graphics mitigate glare and distraction concerns flagged by regulators. Yet thermal hotspots behind large OLEDs necessitate active cooling and sophisticated power-management firmware.
By End User: Aftermarket Eyes Connected Upgrades
OEM-fitted systems accounted for 86.43% revenue in 2024 owing to tight in-plant integration. Still, the aftermarket enjoys a 13.62% CAGR as hobbyists retrofit aging vehicles with CAN-FD-ready clusters that offer Bluetooth music, navigation mirroring, and tire-pressure displays. Standardized Ethernet backbones inside 2015-onward vehicles have simplified plug-and-play kits, though cybersecurity clauses in new warranties restrict modifications on current-generation models.
Geography Analysis
North America retained 34.87% of global revenue in 2024 on the back of early adoption of software-defined cockpits and unified safety rules. The United States-Mexico-Canada Agreement harmonizes component origins, permitting cost-efficient sourcing while NHTSA’s distraction guidance unifies UI test protocols. Mexico serves as a low-cost assembly hub, and Canadian EMS firms specialize in display backlights and bonding lines. Region-specific OTA legislation spurs cloud-security partnerships, sustaining premium unit values.
Asia-Pacific is the fastest-growing geography, charting a 12.93% CAGR through 2030 as China consolidates cockpit and ADAS domain controllers under joint OEM-tech ventures. The SAIC-Audi 2.0 program pilots centralized software stacks that shorten validation cycles and feed learnings back into economy models. Japan delivers panel innovation via Panasonic Automotive’s 22% global infotainment share, while South Korea’s fabs supply mature-node chipsets amid Western capacity gaps. India’s production-linked incentive scheme encourages domestic cluster assembly, lowering landed costs for regional OEMs.
Europe remains a high-value but slower-growing market. The EU Battery Data Sharing Regulation compels new EV clusters to expose granular battery telemetry, raising software content per car. German marques drive large-format OLED uptake, French suppliers lead in cybersecurity testing services, and U.K. code houses specialize in graphical toolchains. UN-ECE Regulation 46 for mirror-replacement displays expands cluster integration with camera feeds, creating further demand for high-brightness panels.

Competitive Landscape
The instrument cluster market shows moderate concentration. Continental closed a EUR 1.4 billion (USD 1.58 billion) spin-off in 2024 that focuses resources on digital user experience and domain controllers, showcasing aggressive portfolio realignment. Bosch earmarked EUR 3 billion (USD 3.39 billion) for semiconductor fabs in Dresden and Reutlingen to secure silicon for clusters and power electronics. Denso strengthens in-house SoC design, seeking tighter control of graphics pipelines.
Display specialists are moving upstream. AUO’s EUR 600 million (USD 678 million) buyout of BHTC grants it Tier-1 status, blurring lines between panel makers and system integrators. Software entrants also find openings: Zeiss and Hyundai Mobis co-develop holographic windshield overlays that could displace traditional clusters in autonomous modes. Barriers to entry rise as ISO/SAE 21434 and ISO 26262 compliance require specialized tools, audits, and post-sale cyber-monitoring teams.
White-space opportunities remain in aftermarket plug-and-play kits, heavy-duty off-highway vehicles, and region-specific low-cost EVs where global Tier-1s lack local customization bandwidth. Partnerships with local EMS providers and cloud firms can unlock those niches for agile challengers.
Instrument Cluster Industry Leaders
Continental Aktiengesellschaft
Robert Bosch GmbH
DENSO Corporation
Visteon Corporation
Yazaki Corporation
- *Disclaimer: Major Players sorted in no particular order

Recent Industry Developments
- February 2025: AUO completed a EUR 600 million BHTC purchase, elevating to full Tier-1 capability in instrument clusters.
- January 2025: Japan Display and Innolux agreed to co-produce 32-inch automotive OLED panels for 2027 premium cockpits.
- January 2025: Continental finalized a EUR 1.4 billion Vitesco spin-off, sharpening focus on software-defined cockpits.
- December 2024: Zeiss and Hyundai Mobis partnered on holographic windshield displays for 2027 models.


Global Instrument Cluster Market Report Scope
| Analog Instrument Clusters |
| Hybrid Instrument Clusters |
| Digital Instrument Clusters |
| Passenger Cars |
| Light Commercial Vehicles |
| Heavy Commercial Vehicles |
| Two-Wheelers |
| Off-Highway Vehicles |
| Less than 5 inch |
| 5-8 inch |
| 9-11 inch |
| Greater than 12 inch |
| OEM-Fitted |
| Aftermarket Replacement |
| North America | United States | |
| Canada | ||
| Mexico | ||
| Europe | Germany | |
| United Kingdom | ||
| France | ||
| Russia | ||
| Rest of Europe | ||
| Asia-Pacific | China | |
| Japan | ||
| India | ||
| South Korea | ||
| Australia | ||
| Rest of Asia-Pacific | ||
| Middle East and Africa | Middle East | Saudi Arabia |
| United Arab Emirates | ||
| Rest of Middle East | ||
| Africa | South Africa | |
| Egypt | ||
| Rest of Africa | ||
| South America | Brazil | |
| Argentina | ||
| Rest of South America | ||
| By Display Technology | Analog Instrument Clusters | ||
| Hybrid Instrument Clusters | |||
| Digital Instrument Clusters | |||
| By Vehicle Type | Passenger Cars | ||
| Light Commercial Vehicles | |||
| Heavy Commercial Vehicles | |||
| Two-Wheelers | |||
| Off-Highway Vehicles | |||
| By Display Size | Less than 5 inch | ||
| 5-8 inch | |||
| 9-11 inch | |||
| Greater than 12 inch | |||
| By End User | OEM-Fitted | ||
| Aftermarket Replacement | |||
| By Geography | North America | United States | |
| Canada | |||
| Mexico | |||
| Europe | Germany | ||
| United Kingdom | |||
| France | |||
| Russia | |||
| Rest of Europe | |||
| Asia-Pacific | China | ||
| Japan | |||
| India | |||
| South Korea | |||
| Australia | |||
| Rest of Asia-Pacific | |||
| Middle East and Africa | Middle East | Saudi Arabia | |
| United Arab Emirates | |||
| Rest of Middle East | |||
| Africa | South Africa | ||
| Egypt | |||
| Rest of Africa | |||
| South America | Brazil | ||
| Argentina | |||
| Rest of South America | |||


Key Questions Answered in the Report
What is the projected value of the global instrument cluster market by 2030?
The market is forecast to reach USD 16.75 billion by 2030 based on a 12.03% CAGR.
Which region shows the fastest growth in instrument cluster demand?
Asia-Pacific leads with a projected 12.93% CAGR through 2030, driven by Chinese and Japanese technology leadership.
Why are digital clusters gaining traction over analog units?
Digital screens support ADAS visuals, EV telemetry, OTA updates and personalization, while panel costs keep falling.
How do cybersecurity rules impact instrument cluster design?
ISO/SAE 21434 forces suppliers to embed secure-boot, threat modeling and long-term vulnerability monitoring, raising R and D overhead.
Which display size dominates current vehicle dashboards?
Screens measuring 9-11 inches hold the largest 51.22% revenue share thanks to a balance of cost and usability.
What aftermarket opportunities exist for cluster suppliers?
Retrofits for older cars and fleet vans that need connected telemetry are growing at a 13.62% CAGR, aided by standardized CAN-FD and Ethernet protocols.
Page last updated on:


