Liquid Analytical Instrument Market Size and Share
Market Overview
| Study Period | 2020 - 2031 |
|---|---|
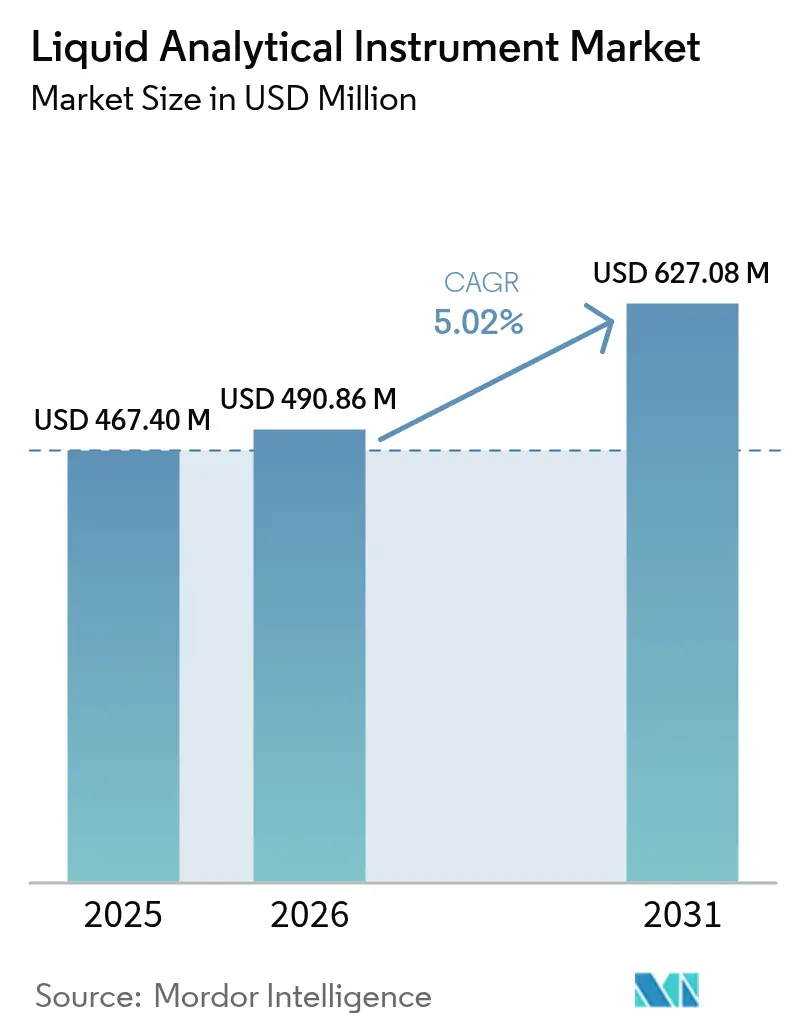
| Market Size (2026) | USD 490.86 Million |
| Market Size (2031) | USD 627.08 Million |
| Growth Rate (2026 - 2031) | 5.02% CAGR |
| Fastest Growing Market | Middle East and Africa |
| Largest Market | Asia Pacific |
| Market Concentration | Medium |
Major Players *Disclaimer: Major Players sorted in no particular order Image © Mordor Intelligence. Reuse requires attribution under CC BY 4.0. | |
Liquid Analytical Instrument Market Analysis by Mordor Intelligence
The liquid analytical instrument market size in 2026 is estimated at USD 490.86 million, growing from 2025 value of USD 467.4 million with 2031 projections showing USD 627.08 million, growing at 5.02% CAGR over 2026-2031. Rising compliance pressure on municipal utilities, rapid industrial automation, and a pivot toward smart sensor platforms anchor steady growth across core applications. Semiconductor fabrication, single-use bioprocessing, and green hydrogen projects demand ever-tighter water quality specifications, accelerating orders for inline pH, conductivity, and total organic carbon (TOC) analyzers. Vendors are embedding artificial intelligence into probes and controllers so that utilities can shift from scheduled checks to predictive maintenance, trimming operating expenses while meeting stricter discharge rules. Asia-Pacific leads equipment uptake on the back of aggressive capacity additions, while Middle East megaprojects for desalination and electrolysis expand the addressable base for high-salinity instruments.
Key Report Takeaways
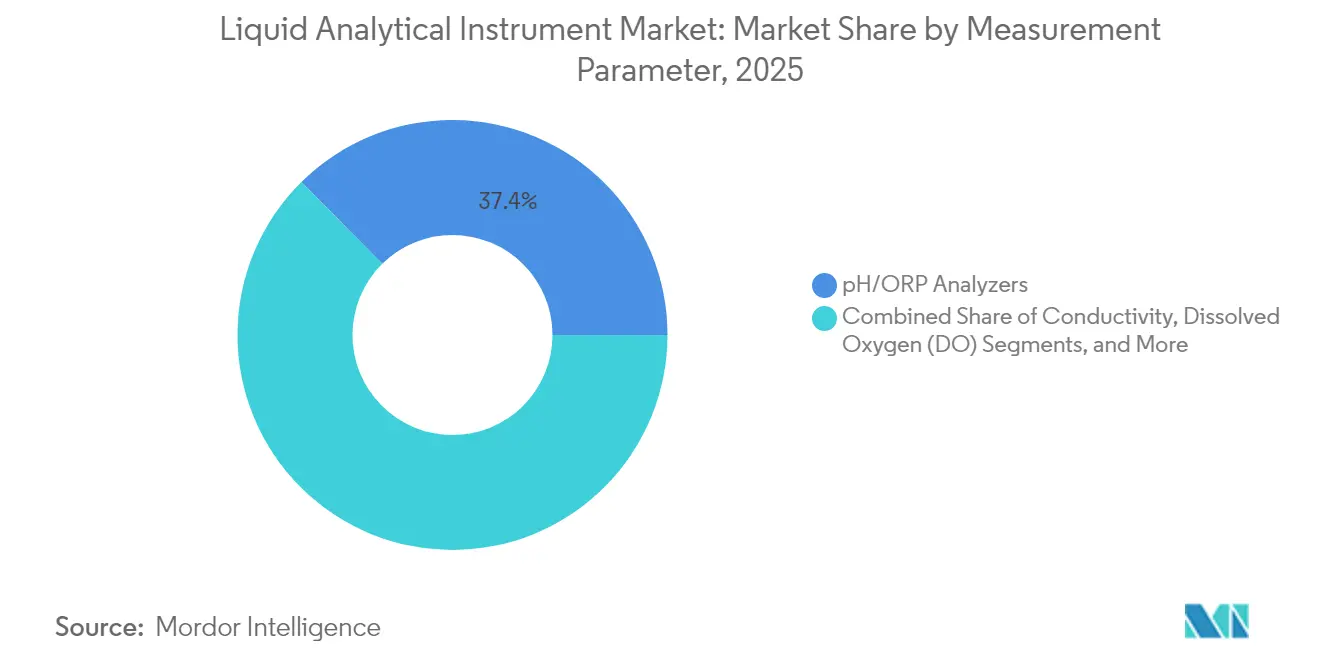
- By measurement parameter, pH/ORP analyzers led with 37.40% revenue share in 2025; TOC/COD/BOD analyzers are projected to expand at a 5.55% CAGR through 2031.
- By instrument form factor, inline/online systems held 54.30% of the liquid analytical instrument market share in 2025; portable/handheld meters record the highest projected CAGR at 5.05% through 2031.
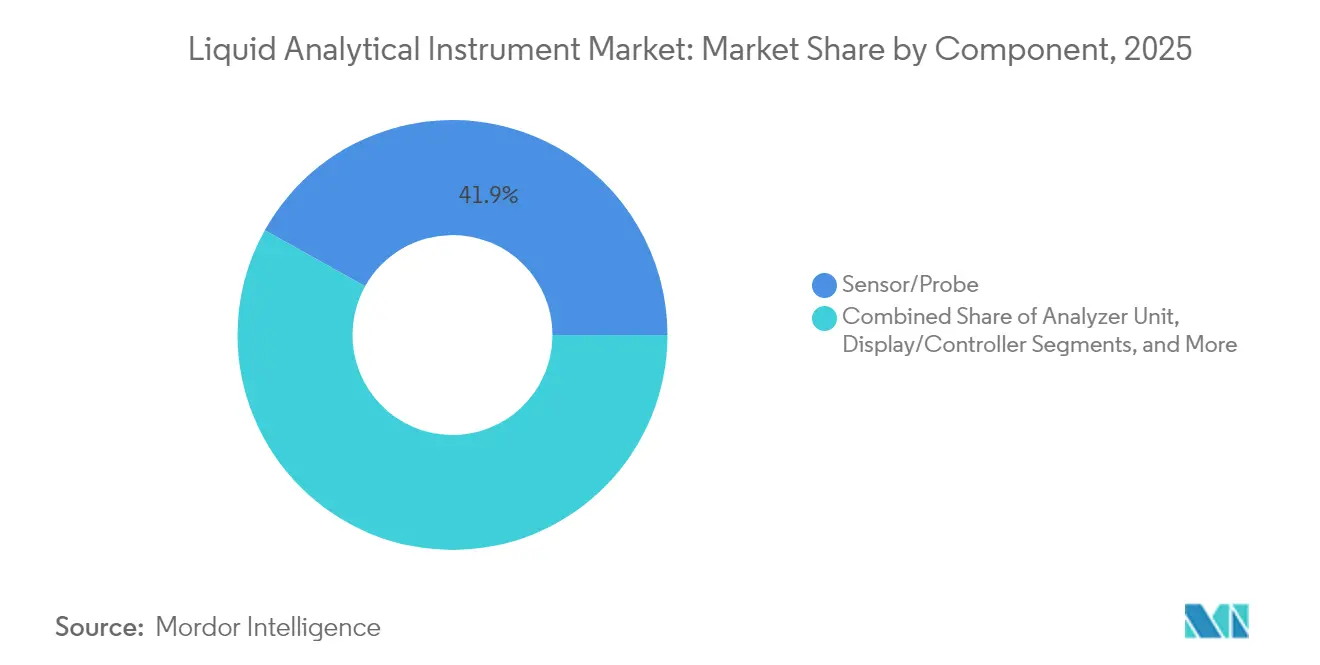
- By component, sensor/probe units accounted for 41.90% share of the liquid analytical instrument market size in 2025; software and integration services are advancing at a 5.92% CAGR through 2031.
- By end-user industry, water and wastewater treatment commanded 45.60% of liquid analytical instrument market size in 2025; pharmaceuticals and biotechnology is forecast to expand at a 5.63% CAGR to 2031.
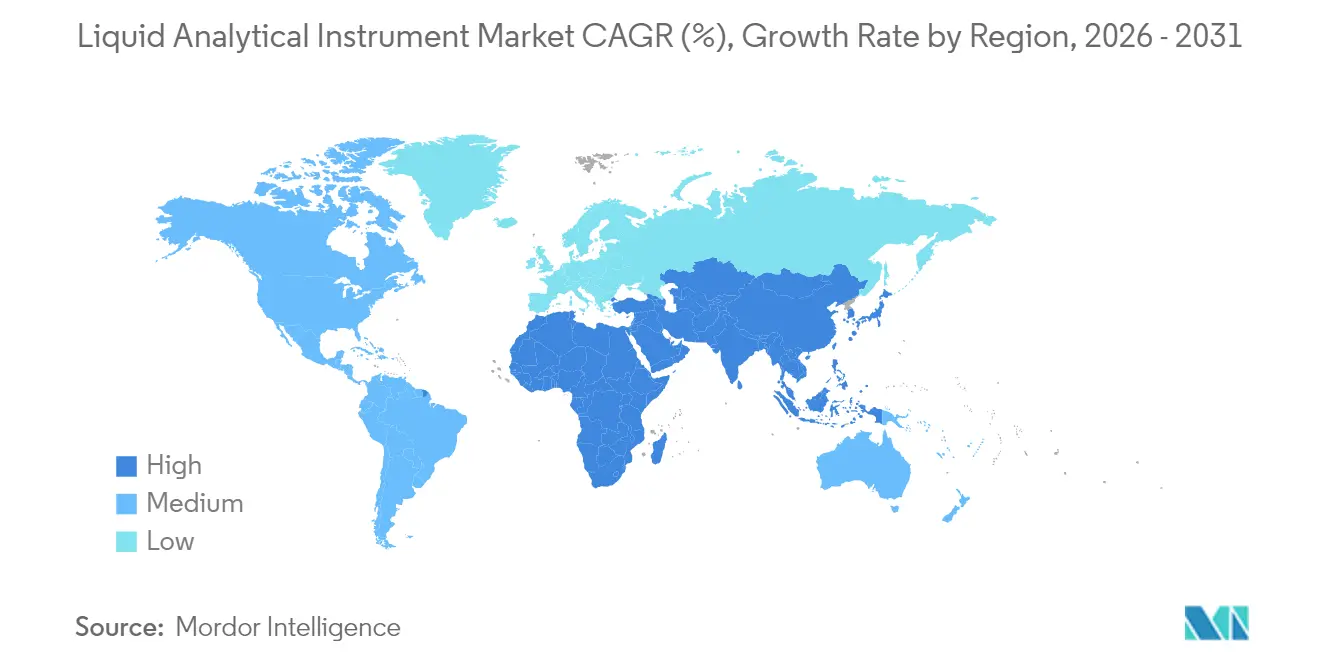
- By geography, Asia-Pacific led with 34.00% revenue share in 2025; Middle East and Africa is poised for the fastest growth at 6.12% CAGR through 2031.
Note: Market size and forecast figures in this report are generated using Mordor Intelligence’s proprietary estimation framework, updated with the latest available data and insights as of 2026.
Global Liquid Analytical Instrument Market Trends and Insights
Drivers Impact Analysis*
| Driver | (~) % Impact on CAGR Forecast | Geographic Relevance | Impact Timeline |
|---|---|---|---|
| Accelerating adoption of smart sensors and IIoT for real-time water quality control in municipal utilities | +1.20% | Global, early uptake in North America & EU | Medium term (2-4 years) |
| Pharmaceutical shift to single-use bioprocessing demanding inline conductivity and TOC analytics | +0.90% | North America & EU core, expanding to APAC | Short term (≤ 2 years) |
| Tightening PFAS and micro-pollutant discharge limits | +1.10% | North America & EU | Long term (≥ 4 years) |
| Expansion of green hydrogen and desalination projects in Middle East | +0.70% | Middle East core, spill-over to North Africa | Medium term (2-4 years) |
| Rapid semiconductor capacity additions in East Asia | +0.80% | China, Taiwan, South Korea | Short term (≤ 2 years) |
| Food industry move to continuous processing with hygienic, CIP-ready sensors | +0.60% | Global | Medium term (2-4 years) |
| Source: Mordor Intelligence | |||
Accelerating adoption of smart sensors and IIoT for real-time water quality control in municipal utilities
Utilities are replacing periodic grab sampling with continuous sensor networks that send encrypted data streams to cloud dashboards. Cincinnati’s Metropolitan Sewer District raised wet-weather collection capacity by 20% and cut treatment costs by 90% after integrating pH, conductivity, and dissolved oxygen probes with an IIoT platform.[1]Ayyeka, “Smart Monitoring: Cincinnati's Smart Sewer Network,” ayyeka.com Real-time alerts let operators divert flows before overflows occur, which lowers regulatory fines and insurance claims. Ruggedized instruments with built-in wireless radios therefore post stronger replacement demand than cabled legacy devices. The surge in smart sewer funding across the United States and western Europe sustains the liquid analytical instrument market as cities modernize century-old networks. Successful scale-up, however, hinges on open communication protocols that limit system integration bottlenecks.
Pharmaceutical shift to single-use bioprocessing demanding inline conductivity and TOC analytics
Continuous biologics manufacturing mandates instant confirmation that purified water meets United States Pharmacopeia and European Pharmacopoeia limits. Endress+Hauser’s CA78/CA79 analyzers provide 50-second TOC readouts with UV oxidation and differential conductivity detection, giving operators immediate feedback to adjust feed streams.[2]Endress+Hauser, “Endress+Hauser Launches CA78 and CA79 TOC Analyzers,” endress.com Inline sensors reduce downtime associated with off-line sampling while curbing cross-contamination risks in disposable bioreactors. As biopharmaceutical plants multiply across the United States, Ireland, and Singapore, suppliers of ultrapure water analyzers secure multi-year framework agreements. New probes use autodiagnostics and Smart-Verify functions to shorten validation cycles, which appeals to contract development and manufacturing organizations scaling multiple molecules. Growing regulatory scrutiny of gene and cell therapy production further boosts demand for high-accuracy, low-maintenance measurement platforms.
Tightening PFAS and micro-pollutant discharge limits
The United States Environmental Protection Agency capped PFOA and PFOS levels at 4 ppt in April 2024, forcing more than 66,000 public water systems to install trace-level detection capabilities.[3]U.S. Environmental Protection Agency, “PFAS National Primary Drinking Water Regulation,” federalregister.gov Utilities must deploy liquid chromatography–mass spectrometry or high-sensitivity TOC systems able to verify compliance by 2029, driving capital expenditure within the liquid analytical instrument market. Parallel standards within the EU Urban Waste-Water Treatment Directive widen the addressable base for multiparameter platforms that screen pharmaceuticals, hormones, and pesticides in one run. Because parts-per-trillion analysis demands stringent calibration, service contracts for reference standards and routine performance checks represent a rising share of vendor revenue. Municipalities prioritizing fast turn-around times gravitate toward turnkey mobile labs that house pre-configured analyzers and sample prep modules.
Expansion of green hydrogen and desalination projects in Middle East
Saudi Arabia awarded the Rabigh 4 reverse-osmosis plant, designed for 600,000 m³/day output, while positioning NEOM’s green hydrogen hub as a global electrolyzer showcase.[4]Saudi Water Partnership Company, “Saudi Arabia launches major environmental and water infrastructure projects,” smartwatermagazine.com Both applications depend on pH, oxidation-reduction potential (ORP), and conductivity probes designed for brine streams exceeding 70,000 mg/L total dissolved solids. Vendors supply titanium-housed sensors with automatic pressure compensation so that membranes and electrolyzer stacks maintain efficiency. ACWA Power’s Shanghai innovation center tests lab-scale prototypes against accelerated fouling regimes, shortening design-in timelines. As regional build-outs continue through 2030, systems integrators bundle liquid analytical instruments with digital twins to model scaling and adjust antiscalant dosing on the fly.
Restraints Impact Analysis*
| Restraint | (~) % Impact on CAGR Forecast | Geographic Relevance | Impact Timeline |
|---|---|---|---|
| Skilled technician shortage inflating calibration and maintenance downtime costs | -0.80% | Global, acute in developing regions | Long term (≥ 4 years) |
| Cross-sensitivity and fouling issues in optical DO/turbidity sensors | -0.50% | Global, harsher industrial sites | Medium term (2-4 years) |
| Budget freezes in municipal utilities of developing nations | -0.60% | APAC, Latin America, Africa | Long term (≥ 4 years) |
| Fragmented communication protocol standards | -0.40% | Global | Short term (≤ 2 years) |
| Source: Mordor Intelligence | |||
Skilled technician shortage inflating calibration and maintenance downtime costs
Complex analyzers require periodic multi-point calibration, diaphragm replacement, and verification against certified reference materials. Many utilities struggle to secure technicians, extending instrument downtime beyond two weeks and risking compliance breaches. A 2025 survey of 350 water operators identified workforce gaps as the top obstacle to digital transformation. Manufacturers now add self-cleaning junctions and remote-assist features, yet critical maintenance still demands on-site expertise. Downtime costs swell when batch processes halt because an inline probe fails qualification. Training programs and augmented-reality support tools only partly mitigate the constraint, leaving labor availability as a long-term drag on adoption for the liquid analytical instrument market.
Cross-sensitivity and fouling issues in optical DO/turbidity sensors
Optical dissolved-oxygen (DO) sensors can drift when aromatic hydrocarbons absorb at the same wavelength, while turbidity probes foul under high bio-load, undermining data integrity. Industrial wastewater streams containing surfactants and suspended solids require weekly cleaning schedules that offset lower maintenance claims versus electrochemical cells. Vendors deploy antifouling coatings and multi-LED compensation algorithms, yet field data show drift up to 15 % between service cycles in pulp-and-paper clarifiers. Reliability concerns prompt operators to keep duplicate probes or revert to membrane-covered galvanic systems for critical control loops. Implementation hurdles slow volume growth for optical platforms despite accuracy advantages in cleaner applications.
*Our forecasts treat driver/restraint impacts as directional, not additive. The impact forecasts reflect baseline growth, mix effects, and variable interactions.
Segment Analysis
By Measurement Parameter: pH/ORP Remains the Workhorse While TOC Gains Traction
pH and ORP analyzers held 37.40% of 2025 revenue, underlining their ubiquity across neutralization, disinfection, and chemical dosing processes. Demand persists because regulatory permits often specify discharge pH bands, and even minor deviations can corrode assets or impair biological treatment. The segment benefits from miniaturized glass-free sensors that withstand high-purity water used in microelectronics and pharmaceutical utilities. Growth moderates as most facilities already own pH loops, yet replacement cycles remain dependable given electrode aging.
Total organic carbon, chemical oxygen demand, and biological oxygen demand analyzers record the fastest 5.55% CAGR to 2031 as regulators turn to organic-load metrics for catchment-wide pollution control. Inline UV-persulfate TOC systems now deliver 30-second responses, letting operators adjust nutrient removal aeration in real time. Adoption inside clean-rooms where ultrapure water costs run high aligns with zero-liquid-discharge targets. As a result, the liquid analytical instrument market size for TOC analyzers is projected to outpace legacy parameters through 2031 while challenging traditional batch grab testing for compliance audits.


By Instrument Form Factor: Inline Dominance and Portable Upswing
Inline analyzers contributed 54.30% revenue in 2025 as continuous monitoring became integral to distributed control strategies. These systems stream digital signals over Ethernet-APL to supervisory platforms so operators can optimize chemical dosing every few seconds. Plants running around-the-clock favor inline devices because downtime for manual sampling threatens throughput. Redundant sensor designs with hot-swap cartridges reduce maintenance windows, advancing long-term reliability.
Portable meters deliver the highest 5.05% CAGR because environmental officers and contract service crews need fast verification readings across catchments. Handheld units now pair with smartphones, using near-infrared micro-spectrometers to assess color, turbidity, and nitrate with one cuvette. Multi-parameter probes shrink kit weight for field engineers, and Bluetooth data logging supports cloud reporting. Consequently, the liquid analytical instrument market responds with rugged IP67 housings, inductive charging, and universal USB-C firmware updates that make on-site firmware refresh practical even in remote areas
By Component: Sensors Anchor Revenue While Software Accelerates
Sensors and probes represented 41.90% of 2025 sales as measurement accuracy still dictates overall system performance. Glass-electrode, optical-luminescence, and metal-oxide semiconductor designs evolve toward longer life spans and lower cross-sensitivity. Vendors co-develop membranes and reference solutions to extend calibration intervals, winning multi-year maintenance contracts.
Software and integration services grow 5.92% annually as data contextualization moves from plant historian silos into enterprise resource planning dashboards. Emerson’s DeltaV version 15 feature pack widened Ethernet connectivity, enabling native OPC UA and MQTT publishing for analytical tags. Predictive analytics modules use ensemble machine-learning algorithms to flag sensor drift seven days before failure, lowering spares stock. Secure scripting environments help utilities comply with cybersecurity frameworks while still sharing data with national regulators. High-margin service bundles lift the overall liquid analytical instrument market outlook as customers shift capex to opex subscription models.
By End-User Industry: Water Utilities Lead, Pharma Expands
Water and wastewater utilities contributed 45.60% of 2025 purchases as tighter effluent permits and storm-surge events necessitate resilient monitoring. Utilities deploying ammonia suppression or advanced oxidation need real-time feedback to avoid reagent overdosing and energy waste. Remote telemetry nodes integrate solar-powered pH, ORP, and nitrate probes that forward data over LoRaWAN, cutting trenching costs for power and communications cables.
Pharmaceutical and biotechnology companies post a 5.63% CAGR because single-use systems shorten project timelines. Inline TOC measurements confirm Water for Injection quality before batches begin, reducing quarantine hold times. Cross-contamination risk declines when cleaning validation is continuous rather than batch-sampled, supporting high-volume vaccine campaigns. As new cell and gene therapy plants open across North Carolina, Dublin, and Suzhou, the liquid analytical instrument market see sustained capital waves for hygienic probes with FDA-compliant materials.
Geography Analysis
Asia-Pacific retained 34.00% of 2025 revenue, with China, Taiwan, and South Korea installing ultrapure water plants to feed advanced semiconductor lines. The region adds multiple 300 mm fabs annually, each requiring thousands of pH, silica, and resistivity loops to guard wafer yields. Pharmaceutical clusters in Singapore and India replicate U.S. GMP practices, installing conductivity networks that verify purified water storage in real time. Government environmental crackdowns enforce continuous monitoring across textile and electroplating parks, adding to baseline demand in the liquid analytical instrument market.
Middle East and Africa posts a 6.12% CAGR through 2031 as Saudi Arabia and United Arab Emirates mandate reverse-osmosis desalination to secure municipal supply. Electrolysis-based green hydrogen initiatives piggyback on desalination infrastructure, requiring high-salinity-tolerant sensors in shared process islands. Long pipeline distances between intake, brine outfall, and hydrogen electrolyzers necessitate distributed analytics every kilometer to meet ISO 22734 requirements. Partnerships with global vendors accelerate localization of service centers, strengthening after-sales networks in the region.
Europe maintains steady growth amid strict Union directives on micro-pollutants, while brownfield refineries and petrochemical plants upgrade to inline spectroscopy for color-number compliance. North America boosts spend on PFAS detection instruments ahead of the 2029 deadline. Latin American and African utilities face budget constraints but receive World Bank funds earmarked for leak-detection and water quality monitoring, supporting gradual modernization.

Competitive Landscape
The liquid analytical instrument market is moderately fragmented, yet top vendors wield significant influence through broad process-automation portfolios and patent holdings. Endress+Hauser, Emerson, and Yokogawa bundle pH, conductivity, and gas analyzers within unified asset-management suites, securing multi-plant framework contracts. Continuous R&D budgets average 6-7% of instrumentation revenue, financing optical-based dissolved-oxygen sensors with self-cleaning caps and spectroscopic phosphate analyzers that reduce reagent use.
Convergence of hardware, software, and advanced analytics drives merger activity. Endress+Hauser completed a joint venture with SICK in January 2025, integrating 800 staff and combining laser gas analysis with liquid sensing to address complete decarbonization projects. Emerson will absorb AspenTech in a USD 17 billion deal, embedding predictive process optimization into control layers that rely on high-quality liquid parameters. ABB signed alliances with Agilent and Mettler-Toledo to automate sample preparation in high-throughput labs, reflecting a shift toward robotics that reduce workplace exposure and speed time-to-result.
Start-ups exploit microfluidics to miniaturize TOC and nitrate assays into palm-sized cartridges, targeting rental models for intermittent compliance checks. Smartphone spectroscopy innovations backed by KAIST promise field testing at a fraction of lab costs, though validation against laboratory reference methods remains pending. Incumbents reply with open-platform firmware and plug-and-play modules under the emerging OPC UA FX standard to preserve installed asset stickiness. Overall, competitive intensity centers on who can simplify maintenance while integrating seamlessly with hybrid cloud architectures.
Liquid Analytical Instrument Industry Leaders
Endress + Hauser
Emerson Electric Co.
Yokogawa Electric Corporation TOP
ABB Inc
Schneider Electric SE
- *Disclaimer: Major Players sorted in no particular order

Recent Industry Developments
- March 2025: ACWA Power opened an overseas innovation centre in Shanghai to advance desalination and green hydrogen technologies.
- February 2025: Emerson agreed to buy all remaining AspenTech shares for USD 17 billion, bolstering software-defined control solutions.
- February 2025: Thermo Fisher announced plans to acquire Solventum’s purification and filtration unit for USD 4.1 billion, expanding its bioprocessing toolkit.
- February 2025: SICK and Endress+Hauser finalized their strategic joint venture, transferring 800 employees to create a combined gas and liquid analysis portfolio.
- January 2025: ABB and Agilent Technologies began collaborating on automated laboratory solutions that marry robotics with LC/GC instrumentation.


Global Liquid Analytical Instrument Market Report Scope
The Liquid Analytical Instrumentsused to measure liquid properties such as pH, ORP, conductivity, dissolved oxygen, chlorine and turbidity among others are considered in this study. Liquids such as water, beverages, dairy products, chemicals among others that are used across industries such aschemical process,food & beverage, pharmaceutical,water & wastewater, power (upstream), refining (midstream and stream) among others., can be analyzed through these instruments in order to maintain consistent product quality, for process optimization and safety and ultimately comply with stringent regulations to reduce environmental concern. Vendors in the market offer transmitters, sensors and also liquid analyzer systems to cater to theon-line measurement of the liquids.
| pH/ORP |
| Conductivity |
| Dissolved Oxygen (DO) |
| Turbidity |
| Total Organic Carbon/COD/BOD |
| Chlorine and Residual Chlorine |
| Sodium and Silicate |
| Nutrient Analyzers (Nitrate, Phosphate, etc.) |
| In-line/On-line Analyzers |
| Portable/Hand-held Meters |
| Benchtop/Laboratory Systems |
| Analyzer Unit |
| Sensor/Probe |
| Display/Controller |
| Reagents and Consumables |
| Software and Integration Services |
| Water and Wastewater Treatment |
| Oil and Gas/Petrochemical |
| Power Generation (Thermal, Nuclear, Renewables) |
| Food and Beverage |
| Pharmaceuticals and Biotechnology |
| Chemicals |
| Pulp and Paper |
| Semiconductor and Electronics |
| Metals and Mining |
| Other End-User Industries (Marine, Agriculture, Academic, etc.) |
| North America | United States | |
| Canada | ||
| Mexico | ||
| Europe | Germany | |
| United Kingdom | ||
| France | ||
| Nordics | ||
| Rest of Europe | ||
| South America | Brazil | |
| Rest of South America | ||
| Asia-Pacific | China | |
| Japan | ||
| India | ||
| South-East Asia | ||
| Rest of Asia-Pacific | ||
| Middle East and Africa | Middle East | Gulf Cooperation Council Countries |
| Turkey | ||
| Rest of Middle East | ||
| Africa | South Africa | |
| Rest of Africa | ||
| By Measurement Parameter | pH/ORP | ||
| Conductivity | |||
| Dissolved Oxygen (DO) | |||
| Turbidity | |||
| Total Organic Carbon/COD/BOD | |||
| Chlorine and Residual Chlorine | |||
| Sodium and Silicate | |||
| Nutrient Analyzers (Nitrate, Phosphate, etc.) | |||
| By Instrument Form Factor | In-line/On-line Analyzers | ||
| Portable/Hand-held Meters | |||
| Benchtop/Laboratory Systems | |||
| By Component | Analyzer Unit | ||
| Sensor/Probe | |||
| Display/Controller | |||
| Reagents and Consumables | |||
| Software and Integration Services | |||
| By End-User Industry | Water and Wastewater Treatment | ||
| Oil and Gas/Petrochemical | |||
| Power Generation (Thermal, Nuclear, Renewables) | |||
| Food and Beverage | |||
| Pharmaceuticals and Biotechnology | |||
| Chemicals | |||
| Pulp and Paper | |||
| Semiconductor and Electronics | |||
| Metals and Mining | |||
| Other End-User Industries (Marine, Agriculture, Academic, etc.) | |||
| By Geography | North America | United States | |
| Canada | |||
| Mexico | |||
| Europe | Germany | ||
| United Kingdom | |||
| France | |||
| Nordics | |||
| Rest of Europe | |||
| South America | Brazil | ||
| Rest of South America | |||
| Asia-Pacific | China | ||
| Japan | |||
| India | |||
| South-East Asia | |||
| Rest of Asia-Pacific | |||
| Middle East and Africa | Middle East | Gulf Cooperation Council Countries | |
| Turkey | |||
| Rest of Middle East | |||
| Africa | South Africa | ||
| Rest of Africa | |||


Key Questions Answered in the Report
What is the current value of the liquid analytical instrument market?
The liquid analytical instrument market stands at USD 490.86 million in 2026 and is projected to reach USD 627.08 million by 2031.
Which parameter segment is growing the fastest?
TOC/COD/BOD analyzers register the quickest expansion at a 5.55% CAGR through 2031 due to tighter organic-load regulations.
Why are pharmaceutical plants investing in new inline sensors?
Single-use bioprocessing requires continuous water quality confirmation, making fast-response conductivity and TOC analyzers essential for compliance and yield.
How will PFAS regulations influence purchasing decisions?
Utilities must install ultra-sensitive detection systems that measure down to 4 ppt, enlarging demand for high-resolution chromatography platforms.
Which region offers the highest growth potential?
Middle East and Africa posts the strongest 6.12% CAGR through 2031, driven by large-scale desalination and green hydrogen initiatives.
What role does software play in modern analytical instruments?
Software and integration services grow 5.92% annually because cloud analytics and predictive maintenance transform raw sensor outputs into actionable insights.
Page last updated on:


