Process Orchestration Market Size and Share
Market Overview
| Study Period | 2019 - 2030 |
|---|---|
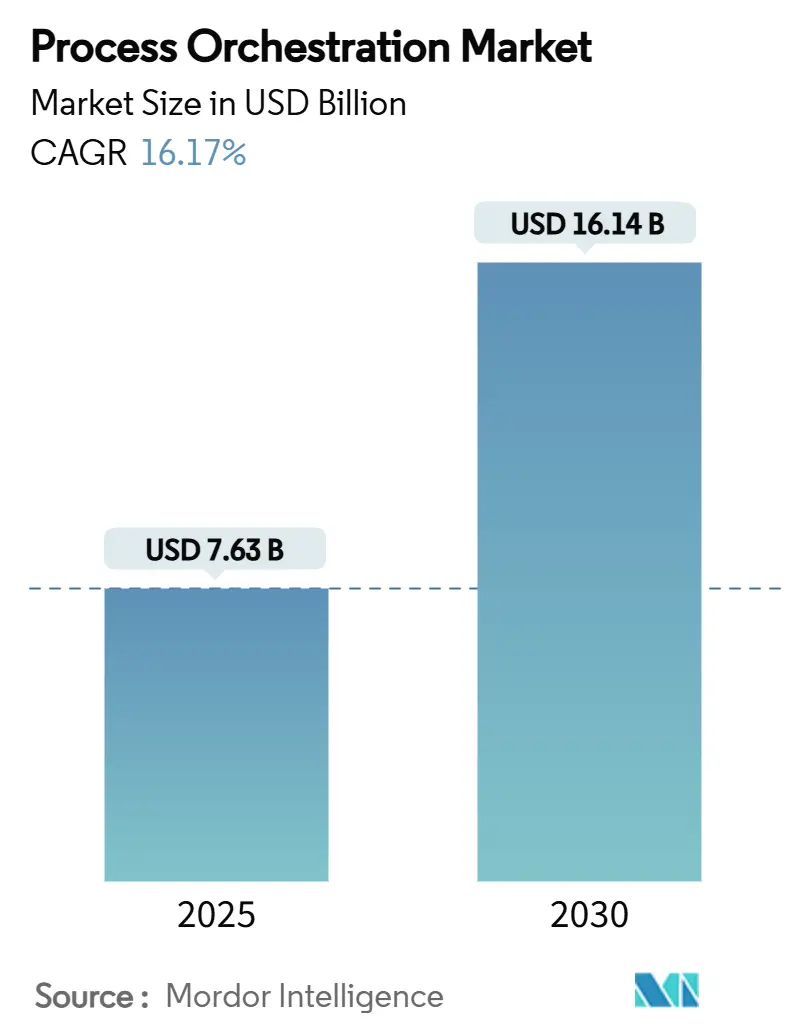
| Market Size (2025) | USD 7.63 Billion |
| Market Size (2030) | USD 16.14 Billion |
| Growth Rate (2025 - 2030) | 16.17% CAGR |
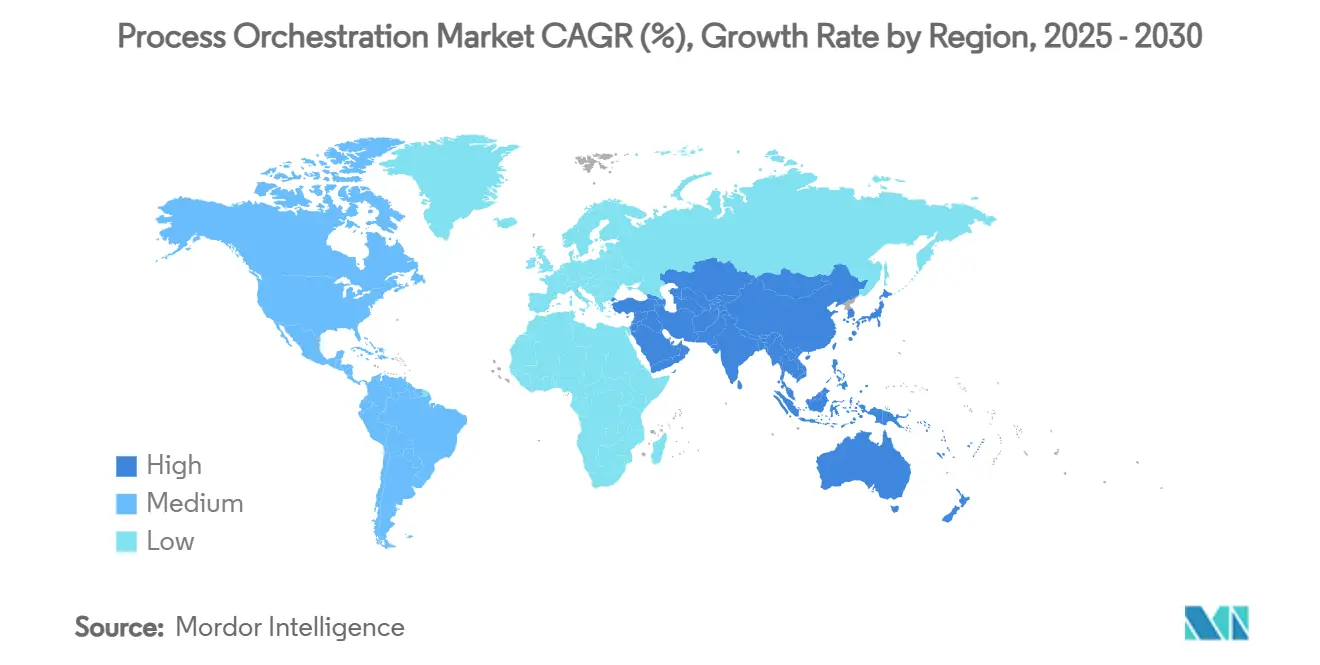
| Fastest Growing Market | Asia Pacific |
| Largest Market | North America |
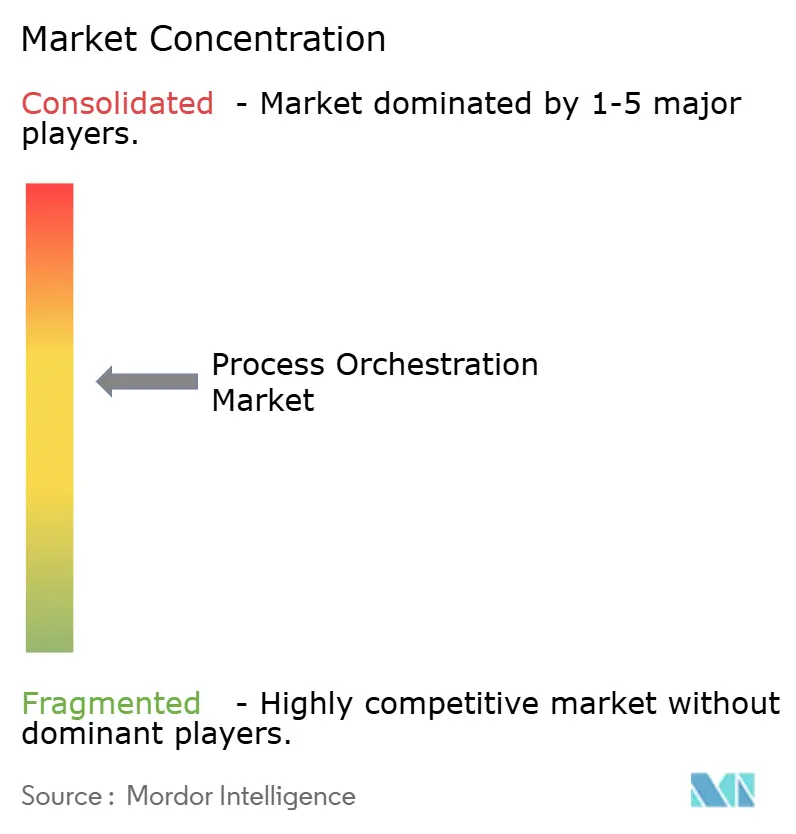
| Market Concentration | Medium |
Major Players *Disclaimer: Major Players sorted in no particular order Image © Mordor Intelligence. Reuse requires attribution under CC BY 4.0. | |
Process Orchestration Market Analysis by Mordor Intelligence
The process orchestration market size stood at USD 7.63 billion in 2025 and is forecast to reach USD 16.14 billion by 2030, registering a 16.17% CAGR during 2025-2030. The uptick stems from Fortune 2000 digital-first mandates, rapid enterprise cloud adoption, and the fusion of AI with cloud-native microservices. Robust venture funding, expanding vendor ecosystems, and rising demand for audit-ready workflows reinforce long-term value creation. Enterprises view orchestration as a strategic lever for operational resilience, improving end-to-end visibility, and accelerating decision cycles. The proliferation of low-code toolkits further democratizes advanced workflow design, allowing business teams to build, test, and iterate processes without specialized coding know-how. At the same time, regulatory commitments to green IT prompt organizations to favor platforms that optimize infrastructure utilization and energy efficiency.[1]Dan Priest, “Embrace Green IT,” IBM Resources, Feb 22, 2023, ibm.com
Key Report Takeaways
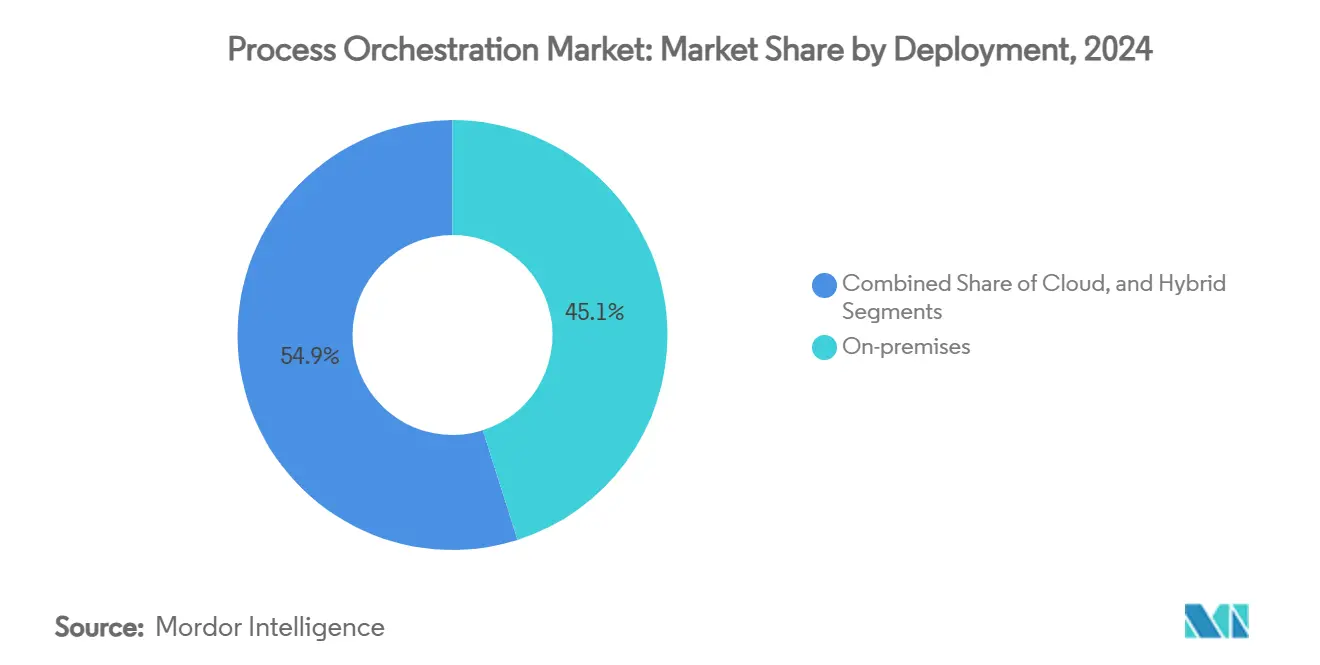
- By deployment, on-premises solutions held 45.1% of the process orchestration market share in 2024, while cloud deployments are projected to expand at a 15.0% CAGR through 2030.
- By organization size, large enterprises accounted for 60.2% of the process orchestration market size in 2024, whereas small and mid-sized enterprises (SMEs) are advancing at a 16.1% CAGR through 2030.
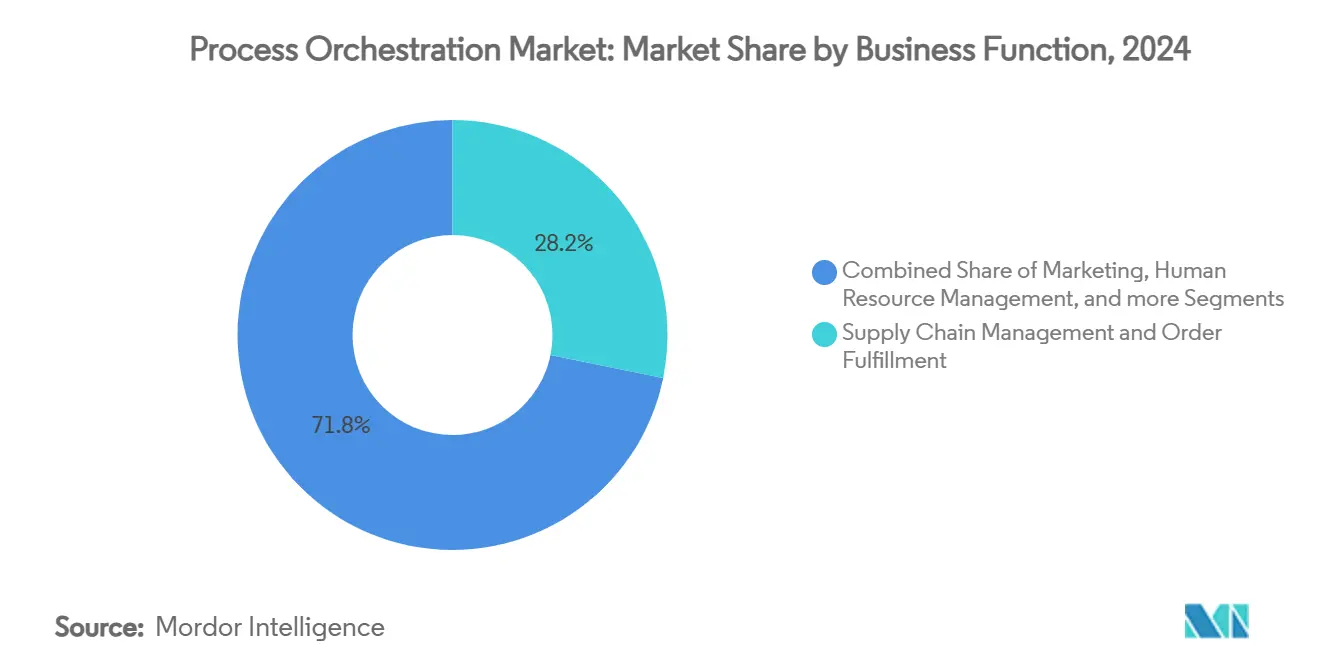
- By business function, Supply chain management and order fulfillment accounted for 28.2% of the process orchestration market size in 2024, whereas Customer Service and Support are forecast to grow at a 15.9% CAGR to 2030.
- By end-user vertical, IT & Telecom led with 21.2% revenue share in 2024; Healthcare & Life Sciences is forecast to grow at a 16.9% CAGR to 2030.
- By region, North America captured 35.1% of 2024 revenue, yet Asia Pacific is on track to register a 17.1% CAGR between 2025 and 2030.
Global Process Orchestration Market Trends and Insights
Drivers Impact Analysis*
| Driver | (~) % Impact on CAGR Forecast | Geographic Relevance | Impact Timeline |
|---|---|---|---|
| Cloud-native micro-services acceleration | +3.2% | North America, Europe, global spillover | Medium term (2 to 4 years) |
| Low-code / no-code democratisation | +2.8% | Asia-Pacific and North America | Short term (less than or equal to 2 years) |
| Hyper-automation mandates in Fortune 2000 | +3.5% | North America and Europe, expanding to Asia-Pacific | Long term (4 years or more) |
| AI-driven workload optimisation | +2.9% | Global, early gains in North America and Asia-Pacific | Medium term (2 to 4 years) |
| Regulatory push for audit-ready workflows | +2.1% | Europe, then North America and Asia-Pacific | Long term (4 years or more) |
| Sustainable IT budgets and green orchestration | +1.8% | Europe, North America, global extension | Long term (4 years or more) |
| Source: Mordor Intelligence | |||
Cloud-native micro-services acceleration
Enterprises migrating from monolithic architectures deploy container clusters that require choreography of hundreds of decoupled services. Deutsche Telekom orchestrated more than 450 automated processes and saved EUR 93 million (USD 99.5 million) annually by embracing a micro-services model. Modern workflow engines built for Kubernetes exploit service-mesh telemetry to assure resilience and auto-scale capacity in line with transaction spikes. Vendors that converge infrastructure and business process orchestration lessen integration toil, cut cycle times, and free developers to focus on differentiating capabilities. As cloud budgets become outcome-driven, boards increasingly endorse orchestration to maximize return on container investments. This priority positions the process orchestration market to widen its footprint across greenfield cloud-native estates over the next four years.
Low-code / no-code democratisation
ServiceNow’s Creator Workflows lets non-developer staff craft orchestrations through drag-and-drop interfaces, easing the global shortage of specialist talent. Citizen developers in mid-market firms can now build workflows that integrate CRM, ERP, and bespoke SaaS tools without writing code. This accessibility compresses project timelines from quarters to weeks and cuts dependence on external integrators. However, unchecked citizen development can breed brittle automations, prompting CIOs to reinforce guardrails around testing, security, and change management. Platforms that couple guided development with centralized governance are primed to win share as enterprises seek a balance between speed and control.
Hyper-automation mandates in Fortune 2000
Heineken automated 140 workflows, saving 14,000 staff hours each month and illustrating how global companies pursue end-to-end orchestration rather than sporadic task automation. Boards now demand single governance layers that traverse RPA bots, AI modules, data fabrics, and legacy systems. Mature orchestration suites embed analytics dashboards that surface bottlenecks, enabling continuous improvement loops. Implementation complexity remains high, yet the scale of value creation-spanning compliance, customer experience, and cost efficiency-keeps hyper-automation at the top of C-suite agendas, fueling sustained expansion of the process orchestration market.
AI-driven workload optimisation
IBM’s watsonx Orchestrate integration with Celonis combines process mining with AI models that predict delays and prescribe corrective actions in real time. Predictive resource allocation slashes latency, while autonomous exception handling uplifts service-level adherence. With boardroom attention on resilience, AI-infused orchestration delivers assurances that critical workflows self-heal without human intervention. Vendors embedding machine learning into runtime engines distinguish themselves in an increasingly crowded field, cementing AI as a core growth vector for the process orchestration market.
Restraints Impact Analysis*
| Restraint | (~) % Impact on CAGR Forecast | Geographic Relevance | Impact Timeline |
|---|---|---|---|
| Legacy systems lock-in | –2.1% | North America and Europe | Short term (less than or equal to 2 years) |
| Talent scarcity in cloud orchestration | –1.9% | North America and Asia-Pacific | Medium term (2 to 4 years) |
| Cyber-security and compliance risks | –1.6% | Europe, then North America | Medium term (2 to 4 years) |
| ROI uncertainty for SMEs | –1.4% | Asia-Pacific and emerging markets | Short term (less than or equal to 2 years) |
| Source: Mordor Intelligence | |||
Legacy systems lock-in
Camunda notes that 70% of enterprises struggle to connect orchestration tools with mainframes and bespoke applications that lack modern APIs. Custom adapters inflate delivery costs and stretch timelines, discouraging some first-time adopters. In regulated sectors, re-platforming core systems can trigger multi-year certification cycles, further deferring payback. Vendors that deliver pre-built connectors, mainframe gateways, or migration blueprints will lower barriers and capture hesitant buyers.
Talent scarcity in cloud orchestration
As scarcity inflates salaries and consultancy fees, deterring mid-sized businesses from large-scale projects. Vendor bootcamps, low-code extensions, and managed service offerings partially offset the shortage but do not fully resolve it. Unless education pipelines expand, talent scarcity will cap the attainable CAGR of the process orchestration market.
*Our forecasts treat driver/restraint impacts as directional, not additive. The impact forecasts reflect baseline growth, mix effects, and variable interactions.
Segment Analysis
By Deployment: Cloud transformation reshapes adoption patterns
The process orchestration market size for on-premises deployments totaled USD 2.96 billion in 2024, equal to 45.1% of overall revenue. These solutions remain popular in industries with stringent data residency mandates. However, cloud deployments are projected to compound at 15.0% annually through 2030, reflecting mounting confidence in cloud security and pay-as-you-scale economics. The spread of SaaS workflows reduces maintenance overhead, while elastic capacity accommodates unpredictable spikes in transaction volume. Hybrid strategies offer a compromise, anchoring sensitive data on-premises while routing non-regulated workloads to public clouds. ServiceNow’s Workflow Data Fabric, launched in 2025, exemplifies a cloud-native layer that synchronizes on-premises and cloud data streams without duplicating storage.[2]ServiceNow Press Office, “Workflow Data Fabric for the AI Era,” ServiceNow Press, May 7, 2025, servicenow.com Vendors that deliver seamless connectivity across environments are set to dominate the process orchestration market.
Organizations cite continuous innovation as the chief lure of SaaS orchestration, as monthly releases yield new AI plugins, compliance packs, and pre-built integrations. Conversely, some CIOs cling to self-hosted models to sustain bespoke customizations or avoid license metering. Over the forecast period, vendor roadmaps that blend container portability with SaaS convenience will appeal to firms wary of hyperscaler lock-in. The expansion of sovereign-cloud zones in Europe and Asia further removes regulatory anxiety, positioning cloud as the default choice for greenfield orchestration initiatives.


By Organization Size: SME democratisation unlocks fresh demand
Large enterprises generated 60.2% of 2024 revenue and will continue to finance mega-projects that span multiple geographic units, ERPs, and robotic fleets. Yet SMEs outpace them in relative growth, charting a 16.1% CAGR, as low-code options slash entry barriers. Subscription tiers that start under USD 10,000 per year let mid-size manufacturers automate purchase order approvals, shipment tracking, and invoice matching without hiring full-time developers. OutSystems and Webcon roll out template libraries so SMEs can stand up orchestrations in under four weeks. These gains illustrate the widening participation base of the process orchestration market.
While SMEs value speed, large enterprises still drive platform sophistication. They demand granular access controls, cross-domain analytics, and zero-downtime upgrade paths. Providers segment offerings accordingly, pitching simplified packages to SMEs and enterprise suites with advanced governance modules to global corporations. Over time, best-practice transfer from large to small organizations will compress capability gaps, fostering a more homogenous market landscape.
By Business Function: Supply chain orchestration sets the pace
Supply chain management contributes the greatest share of function-level spending. Supply chain management and order fulfillment accounted for 28.2% of the process orchestration market size in 2024, whereas Customer Service and Support is forecast to grow at a 15.9% CAGR to 2030. This is propelled by omnichannel commerce and just-in-time manufacturing. Firms orchestrate demand sensing, inventory allocation, and last-mile delivery into single auto-scaling workflows that cut stockouts and shipping costs. Real-time APIs to logistics partners simplify hand-offs, while AI engines forecast material shortages. Marketing ranks second as teams connect lead-nurturing journeys across email, social, and in-app channels. Human resource orchestration gains ground via automated onboarding and compliance training sequences, reducing administrative drag.
Finance departments employ orchestration for straight-through invoice processing and regulatory filing. Customer service units deploy case-routing flows linked to sentiment analytics, ensuring swift escalation of at-risk accounts. The breadth of use cases signals the horizontal relevance of the process orchestration market, enabling vendors to upsell additional modules once an initial foothold is established.
By End-User Vertical: Healthcare gathers momentum
IT & Telecom commanded 21.2% of 2024 revenue due to high system complexity and early cloud maturity. Healthcare & Life Sciences is predicted to rise at a 16.9% CAGR as hospitals and pharma companies digitize records, lab workflows, and regulatory submissions. Northwestern Medicine leveraged Celonis process mining to shave hours from patient discharge processes, underscoring clinical efficiency returns.[3]Celonis Communications, “Northwestern Medicine Customer Story,” Celonis, 2024, celonis.com Banking, financial services and insurance prioritize orchestration for compliance checks, KYC, and risk analytics. Manufacturing pursues Industry 4.0 visions that integrate shop-floor sensors, MES, and ERP systems into unified workflows.
Retail & e-Commerce retailers orchestrate click-to-deliver chains to sustain rapid fulfillment promises. Energy & Utilities automate outage responses and carbon reporting, aligning with green mandates. Government agencies apply orchestration to citizen portals, grants processing, and inter-agency data sharing. Vertical nuances shape feature priorities; for instance, healthcare demands HIPAA-compliant audit trails, whereas manufacturing seeks OPC UA equipment integration. Vendors tailoring configuration templates and regulatory extensions for each vertical will capture incremental share across the broader process orchestration market.
Geography Analysis
North America held a 35.1% share of the process orchestration market in 2024, buoyed by Fortune 500 demand, deep cloud penetration, and stringent compliance regimes in healthcare and financial services. Government entities also accelerate, with the US Department of Veterans Affairs posting a 65% rise in automation throughput during 2024.[4]US Department of Veterans Affairs, “VA Automation Milestone,” VA Press, 2024, va.gov The region’s 2025-2030 trajectory remains solid as enterprises prioritize AI-rich orchestration to raise service reliability and cut technical debt.
Asia Pacific is projected to log a 17.1% CAGR through 2030, reflecting manufacturing automation campaigns, government-led digital initiatives, and rapid cloud migration in India, Southeast Asia, and China. Yamaha Motors adopted SAP Signavio to streamline cross-plant processes and boost innovation velocity, signaling a rising appetite for value-based transformation. Japanese and Korean conglomerates spearhead adoption, while ASEAN mid-market firms follow suit as SaaS pricing aligns with local budgets.
Europe sustains steady expansion supported by GDPR compliance needs, sustainability reporting obligations, and an established industrial base. Schneider Electric highlights energy-efficient orchestration as an enabler of green IT roadmaps, tying process optimization to ESG scorecards. Sovereign cloud regions and pan-EU regulatory standards reduce vendor fragmentation, fostering a cohesive market for enterprise buyers.

Competitive Landscape
The market sits in a moderate-fragmentation zone where legacy software giants and cloud-native entrants contest wallet share. IBM, SAP, and Microsoft lean on enterprise incumbency and broad portfolios to retain footholds. Camunda and Temporal differentiate via open-source codebases that attract developer communities seeking transparency and extensibility. ServiceNow’s 2025 launch of AI Agent Orchestrator confirms the pivot toward autonomous workflow governance, elevating the competitive stakes.
Strategic themes cluster around three approaches. Full-suite vendors fuse process mining, low-code, and integration buses under a single license, positioning themselves as one-stop shops. Specialists pick verticals such as healthcare or utilities, embedding compliance rules and industry templates to outflank generic rivals. Cloud-native challengers court DevOps teams with API-first architectures and pay-per-flow pricing.
Partnerships amplify reach. ServiceNow’s June 2025 pact with NVIDIA integrates GenAI models to accelerate reasoning at lower latency, sharpening orchestration accuracy while trimming inference costs. Oracle-ServiceNow data-fabric alignment deepens bi-directional sync across finance and HR clouds, locking in multi-vendor estates. As AI licensing fees climb, vendors able to amortize compute through shared micro-service layers will win cost-sensitive buyers.
Process Orchestration Industry Leaders
SAP SE
Microsoft Corporation
Oracle Corporation
Pega Systems Inc.
IBM Corporation
- *Disclaimer: Major Players sorted in no particular order

Recent Industry Developments
- January 2025: ServiceNow unveiled AI Agent Orchestrator to manage multi-agent environments, aiming to simplify governance and expand cross-function automation scope.
- February 2025: ServiceNow integrated Microsoft 365 Copilot into Now Assist, targeting unified front-office experiences and quicker productivity gains.


Global Process Orchestration Market Report Scope
| On-premises |
| Cloud |
| Hybrid |
| Large Enterprises |
| Small & Mid-sized Enterprises (SMEs) |
| Supply chain management and order fulfillment |
| Marketing |
| Human Resource Management |
| Finance and Accounting |
| Customer Service and Support |
| Banking, Financial Services and Insurance (BFSI) |
| IT and Telecom |
| Healthcare and Life Sciences |
| Manufacturing |
| Retail and e-Commerce |
| Energy and Utilities |
| Government and Public Sector |
| Other End-User Verticals |
| North America |
| South America |
| Europe |
| Asia Pacific |
| Middle East and Africa |
| By Deployment | On-premises |
| Cloud | |
| Hybrid | |
| By Organisation Size | Large Enterprises |
| Small & Mid-sized Enterprises (SMEs) | |
| By Business Function | Supply chain management and order fulfillment |
| Marketing | |
| Human Resource Management | |
| Finance and Accounting | |
| Customer Service and Support | |
| By End-User Vertical | Banking, Financial Services and Insurance (BFSI) |
| IT and Telecom | |
| Healthcare and Life Sciences | |
| Manufacturing | |
| Retail and e-Commerce | |
| Energy and Utilities | |
| Government and Public Sector | |
| Other End-User Verticals | |
| By Geography | North America |
| South America | |
| Europe | |
| Asia Pacific | |
| Middle East and Africa |


Key Questions Answered in the Report
What is the current size of the process orchestration market?
The market generated USD 7.63 billion in 2025 and is projected to reach USD 16.14 billion by 2030 as it expands at a 16.17% CAGR.
Which deployment model is expanding the fastest?
Cloud-based orchestration is growing at a 15.0% CAGR through 2030, outpacing on-premises and hybrid alternatives as enterprises seek scale and continuous updates.
Which region is expected to post the highest growth?
Asia Pacific is forecast to register a 17.1% CAGR between 2025 and 2030, propelled by manufacturing automation and government digitization mandates.
What factors are driving adoption across industries?
Key catalysts include AI-driven workload optimization, low-code democratization, hyper-automation mandates in large enterprises, and regulatory demands for audit-ready workflows.
Page last updated on:


