Market Overview
| Study Period | 2020 - 2031 |
|---|---|
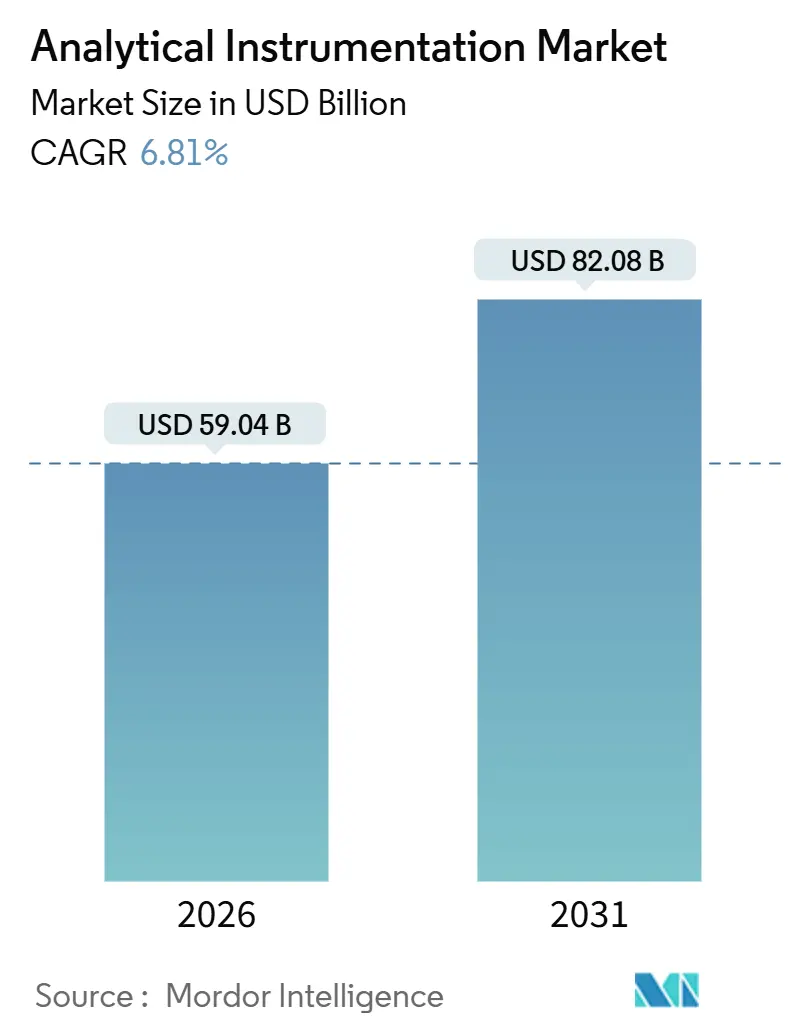
| Market Size (2026) | USD 59.04 Billion |
| Market Size (2031) | USD 82.08 Billion |
| Growth Rate (2026 - 2031) | 6.81% CAGR |
| Fastest Growing Market | Asia Pacific |
| Largest Market | North America |
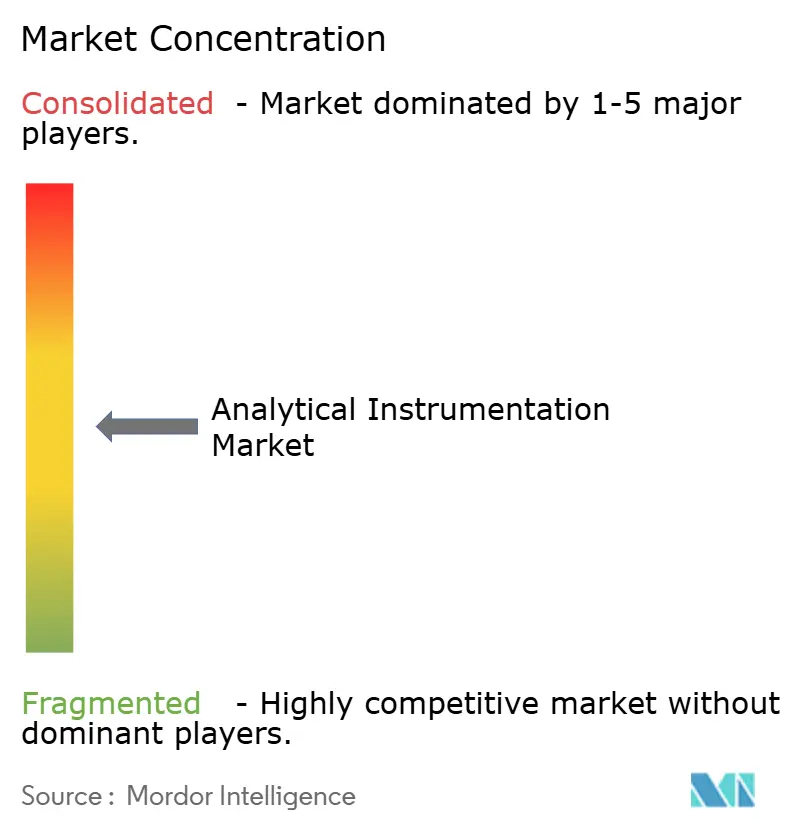
| Market Concentration | Medium |
Major Players*Disclaimer: Major Players sorted in no particular order Image © Mordor Intelligence. Reuse requires attribution under CC BY 4.0. | |
Analytical Instrumentation Market Analysis by Mordor Intelligence
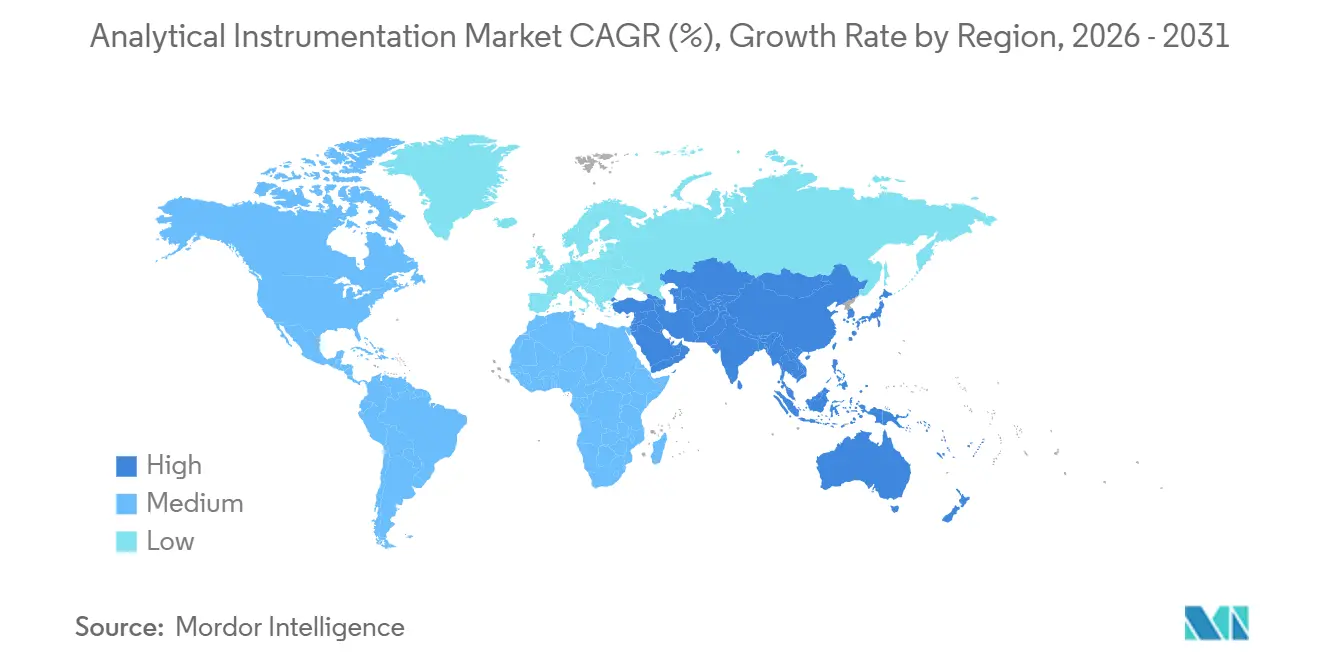
The analytical instrumentation market size reached USD 59.04 billion in 2026 and is projected to reach USD 82.08 billion by 2031, advancing at a 6.81% CAGR. Strong demand stems from tighter contaminant regulations, sub-3-nanometer semiconductor manufacturing, and the pharmaceutical shift to real-time release testing, all of which require highly sensitive, software-driven platforms. North America generated 39.82% of 2025 revenue, led by large biopharmaceutical and semiconductor bases, while Asia-Pacific is expected to post a 7.84% CAGR through 2031, as gigafactory and foundry build-outs favor inline particle-size and ICP-MS quality-control systems. Laboratories worldwide are also accelerating adoption of cloud-based data management, and portable analyzers are moving upstream into oil and gas fields where immediate results matter. Meanwhile, carrier-gas substitution initiatives have begun to mitigate helium supply shocks that once constrained gas chromatography workflows.
Key Report Takeaways
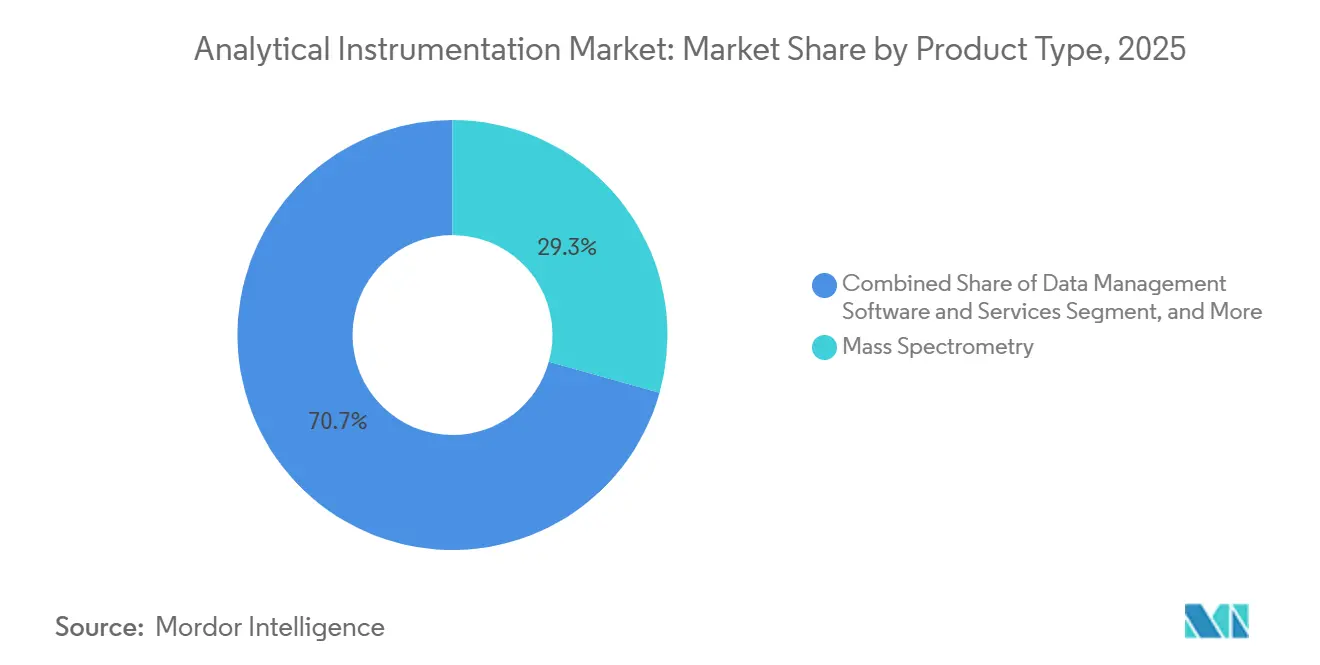
- By product type, mass spectrometry led with 29.33% of the analytical instrumentation market share in 2025, while data-management software and services are forecast to expand at an 8.46% CAGR through 2031.
- By end-user industry, pharmaceuticals and biopharmaceuticals accounted for 33.47% of 2025 revenue; environmental testing laboratories are projected to exhibit the fastest CAGR of 8.93% to 2031.
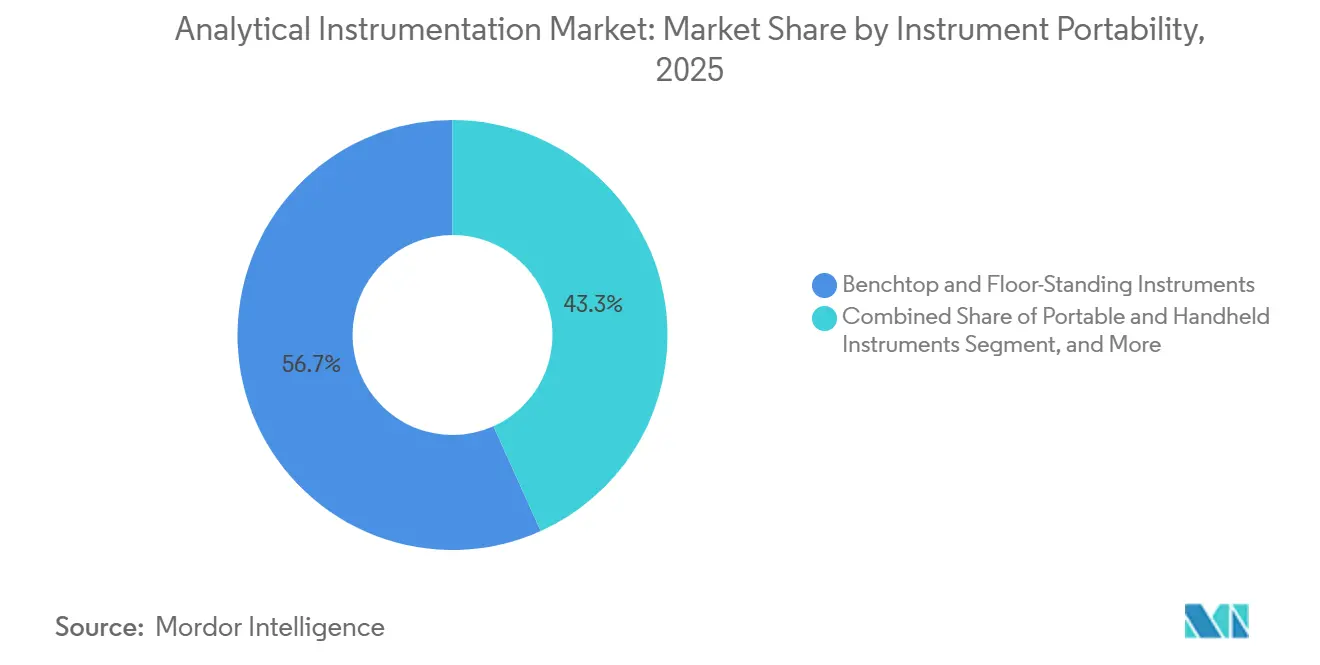
- By instrument portability, benchtop and floor-standing platforms captured 56.73% of 2025 shipments, whereas portable and handheld devices are advancing at a 7.49% CAGR.
- By sales channel, direct sales retained a 62.39% share in 2025, although eCommerce marketplaces are expected to rise at a 7.42% CAGR through 2031.
- By geography, North America accounted for 39.82% of 2025 revenues, but Asia-Pacific is the fastest-growing region at a 7.84% CAGR, driven by battery and semiconductor capacity additions.
Note: Market size and forecast figures in this report are generated using Mordor Intelligence’s proprietary estimation framework, updated with the latest available data and insights as of January 2026.
Global Analytical Instrumentation Market Trends and Insights
Drivers Impact Analysis*
| Driver | (~) % Impact on CAGR Forecast | Geographic Relevance | Impact Timeline |
|---|---|---|---|
| Rising adoption of hyphenated techniques for biologics QA/QC | +1.2% | Global, with concentration in North America and Europe | Medium term (2-4 years) |
| Stringent global limits on PFAS and microplastics boosting ultra-trace spectrometry | +1.4% | North America, Europe, Asia-Pacific (Japan, Australia) | Short term (≤ 2 years) |
| Shift toward real-time release testing in pharma production | +1.0% | North America, Europe, emerging in Asia-Pacific | Medium term (2-4 years) |
| Semiconductor node shrinkage below 3 nm requiring ultra-sensitive surface analysis | +1.1% | Asia-Pacific (Taiwan, South Korea, China), North America | Long term (≥ 4 years) |
| Expansion of renewable aviation fuel programs driving feedstock certification | +0.8% | North America, Europe, Middle East | Medium term (2-4 years) |
| In-lab analytics surge for battery gigafactory quality assurance | +1.2% | Asia-Pacific (China, South Korea), North America, Europe | Short term (≤ 2 years) |
| Source: Mordor Intelligence | |||
Rising Adoption of Hyphenated Techniques for Biologics QA/QC
Monoclonal antibodies and antibody-drug conjugates now represent more than 30% of new drug approvals, and their structural complexity has normalized liquid chromatography high-resolution mass spectrometry as the orthogonal standard for charge-variant and glycosylation profiling. Regulatory guidance issued in 2024 explicitly calls for peptide mapping via LC-MS in biosimilar dossiers, anchoring demand for Orbitrap and quadrupole-time-of-flight systems that deliver sub-5 ppm accuracy.[1]United States Food and Drug Administration, “Analytical Procedures for Biosimilar and Interchangeable Products: Guidance for Industry,” FDA.gov Instrument suppliers reported double-digit unit growth in 2025, with uptake highest among Asian biosimilar developers aiming to prove molecular equivalence. Laboratories increasingly integrate AI modules that automate method optimization, shortening validation cycles and reducing human error risk. This dynamic supports premium hardware-software bundles and recurring revenue from consumables.
Stringent Global Limits on PFAS and Microplastics Boosting Ultra-Trace Spectrometry
The United States set a maximum contaminant level of 4 ppt for key PFAS species in 2024, far below the detection limits of legacy triple-quadrupole MS platforms. Utilities and commercial laboratories, therefore, upgraded to ICP-MS/MS and Orbitrap systems equipped with collision-reaction cells that suppress polyatomic interferences to achieve sub-1 ppt detection. Europe’s pending microplastics directive adds momentum, as Raman microspectroscopy and pyrolysis-GC-MS enable single-particle polymer identification. Instrument vendors recorded order spikes of 30% or more from municipal customers in 2025, indicating that mandated compliance is reshaping capital-spending priorities.
Shift Toward Real-Time Release Testing in Pharma Production
Traditional end-product testing can lock warehoused inventory for up to two weeks, a timeline incompatible with continuous manufacturing. The 2024 pharmaceutical quality-systems guidance endorsed real-time release testing supported by validated multivariate models, legitimizing the use of near-infrared and Raman probes within blending units. Continuous lines now embed multiple sensors at each critical control point, enabling immediate batch disposition. Ruggedized, explosion-proof spectrometers certified to ATEX and IECEx standards have become procurement staples, with in-line analyzers reducing batch-release cycles from days to hours.[2]International Electrotechnical Commission, “IEC 60079 Explosive Atmospheres Standards,” IEC.ch
Semiconductor Node Shrinkage Below 3 nm Requiring Ultra-Sensitive Surface Analysis
High-volume 3 nm chip production commenced in 2024, forcing fabs to detect monolayer contaminants that degrade gate-oxide integrity. Time-of-flight secondary-ion mass spectrometry and X-ray photoelectron spectroscopy systems capable of sub-50 nm spatial resolution are now indispensable. Tool orders for advanced SIMS platforms doubled year over year in 2025 among logic chip manufacturers, reflecting the rapid transition to gate-all-around architectures.[3]Taiwan Semiconductor Manufacturing Company, “3 nm Technology,” TSMC.com Continual node migration assures a long investment runway for ultra-sensitive surface-analysis instruments.
Restraints Impact Analysis*
| Restraint | (~) % Impact on CAGR Forecast | Geographic Relevance | Impact Timeline |
|---|---|---|---|
| High total cost of ownership of high-resolution MS in emerging markets | -0.9% | Asia-Pacific (excluding Japan), Latin America, Middle East and Africa | Medium term (2-4 years) |
| Shortage of skilled analytical chemists elevating outsourcing costs | -0.7% | Global, acute in North America and Europe | Short term (≤ 2 years) |
| Helium supply-chain volatility impacting GC operations | -0.5% | Global, most severe in North America and Europe | Short term (≤ 2 years) |
| Lengthy validation cycles for novel analytical methods in regulated sectors | -0.6% | Global, concentrated in pharmaceutical and clinical diagnostics | Medium term (2-4 years) |
| Source: Mordor Intelligence | |||
High Total Cost of Ownership of High-Resolution MS in Emerging Markets
Orbitrap and Q-TOF instruments range from USD 500,000 to USD 1.2 million, but five-year ownership often exceeds USD 2 million when consumables and service contracts are included. Many laboratories in South and Southeast Asia face 180-day payment terms, double that of North American buyers, tightening cash flow and delaying replacements. Consequently, smaller facilities opt for refurbished triple-quadrupole units or outsource ultra-trace analyses, fragmenting demand and lengthening refresh cycles. Vendors respond with subscription models that bundle hardware, software, and maintenance into monthly fees, yet adoption remains modest outside multinational corporations.
Shortage of Skilled Analytical Chemists Elevating Outsourcing Costs
A 2024 survey reported 12,000 vacant analytical chemist positions in the United States, forcing laboratories to raise wages and contract rates. Method-development billing has climbed to USD 250-400 per hour, prompting pharmaceutical sponsors to consolidate work at larger contract research organizations. The talent shortfall drives interest in software that automates gradient design, spectral deconvolution, and out-of-specification flagging, but implementation requires cultural change and upgrades to data governance. Until educational pipelines improve, staffing limitations will constrain instrument throughput and slow adoption in smaller labs.
*Our forecasts treat driver/restraint impacts as directional, not additive. The impact forecasts reflect baseline growth, mix effects, and variable interactions.
Segment Analysis
By Product Type: Software Outpaces Hardware Growth
Mass spectrometry accounted for 29.33% of segment revenue in 2025, the largest share of the analytical instrumentation market. Chromatography platforms ranked second, with ultra-high-performance liquid chromatography gaining momentum as column particle sizes shrink to sub-2 µm. Molecular and elemental spectroscopy instruments remain essential to food, petrochemical, and semiconductor workflows, while analytical microscopes and surface analysis tools support nanomaterials and battery research. Data-management software and services represent the fastest-growing category at an 8.46% CAGR, mirroring laboratory migration to cloud LIMS platforms that merge acquisition, compliance, and AI analytics. This transition positions software subscriptions as an annuity layer within the wider analytical instrumentation market.
Consumables such as columns, ion sources, and calibration standards deliver stable cash flow and underpin vendor loyalty programs. Instrument makers increasingly package multiyear consumable plans with preventive-maintenance agreements that smooth revenue recognition. With software leading growth, hardware innovation now centers on modular architectures that shorten repair times and facilitate field upgrades. These features resonate with laboratories that must minimize downtime to maximize utilization.


By End-User Industry: Environmental Labs Surge
Pharmaceutical and biopharmaceutical companies accounted for 33.47% of demand in 2025, owing to discovery screening, formulation, and release testing that rely on LC, MS, and dissolution platforms. Environmental laboratories, however, are advancing the fastest, with an 8.93% CAGR, because PFAS and microplastics regulations mandate ultra-trace detection via high-resolution mass spectrometry and Raman spectroscopy. The analytical instrumentation market for utilities and contract environmental labs is therefore expanding rapidly. Clinical, food, chemical, and semiconductor segments continue to diversify spending, each seeking specialized configurations that match their respective regulatory and throughput requirements.
Battery and materials-science laboratories are directing fresh investment toward ICP-MS-MS and X-ray diffraction systems for cathode-phase stability studies. Semiconductor fabs, meanwhile, intensify purchases of SIMS and XPS equipment to safeguard yields below 3 nm. Academic and government institutes sustain demand for high-end microscopes, though flat budgets temper the frequency of orders. Collectively, these patterns illustrate a shift from traditional pharma dominance toward a broader distribution of revenue streams across adjacent sectors.
By Instrument Portability: Handheld Devices Gain Share
Benchtop and floor-standing platforms held 56.73% of shipments in 2025, a testament to their superior resolution and sensitivity, qualities regulators still deem indispensable. Yet portable and handheld analyzers are progressing at a 7.49% CAGR as field applications multiply. Upstream oil operators, mining inspectors, and warehouse auditors leverage handheld XRF and Raman units to obtain instant results, eliminating delays and logistical costs tied to central-lab analysis. These gains reinforce mobility-oriented designs' market share in the analytical instrumentation market.
Embedded process analyzers further blur the boundary between portability and embedded systems by positioning sensors directly in reactors or pipelines. Explosion-proof certifications widen adoption in hazardous environments, and continuous data feeds enable real-time release decisions. Vendors who deliver compact, rugged sensors compatible with multivariate analysis software stand to capture outsized growth as Industry 4.0 philosophies make inroads in the process industries.
By Sales Channel: Direct Sales Dominate, eCommerce Rises
Direct engagement accounted for 62.39% of revenue in 2025 because complex instruments and regulated applications warrant vendor-led method development, installation, and lifecycle support. Multinational pharmaceutical and semiconductor firms frequently negotiate bundled contracts that include hardware, software, consumables, and on-site service. Distributor networks cater to smaller laboratories lacking volume leverage, offering localized support but at higher margin costs.
eCommerce marketplaces, while starting from a small base, are forecast to compound at a 7.42% CAGR through 2031. Refurbished components, consumables, and even entry-level instruments can now be purchased online, thanks to peer reviews and transparent pricing. This channel lowers acquisition costs and diversifies supply, though customers still prefer direct channels for mission-critical capital instruments. The coexistence of consultative and digital models points to an omnichannel future in which procurement routes align with purchase complexity rather than buyer size alone.
Geography Analysis
North America accounted for 39.82% of global revenue in 2025, underpinned by the United States’ stringent FDA, EPA, and SEMI standards that require validated analytical methods. Europe followed, with Germany, the United Kingdom, and France maintaining robust pharmaceutical and chemical production bases that favor spending on chromatography and spectroscopy. The analytical instrumentation market in Europe benefited from regulatory harmonization, which enabled platform standardization across transatlantic sites.
Asia-Pacific is set to expand at a 7.84% CAGR through 2031 and already houses the fastest-growing customer segments. China’s battery gigafactory footprint exceeded 50 GWh in 2025, and each plant integrates particle-size analyzers, ICP-MS units, and X-ray diffraction systems to certify the quality of powders and slurries. India’s pharmaceutical exports climbed to USD 27.9 billion in fiscal 2025, boosting demand for LC-MS and HPLC platforms that meet USP monographs and pass U.S. FDA inspections. Japanese and South Korean chip-equipment suppliers are scaling SIMS and SEM capacity to support sub-3 nm fabrication, ensuring sustained regional demand.
The Middle East and Africa remain smaller but strategic, with petrochemical expansions in Saudi Arabia and the United Arab Emirates driving investments in gas chromatography and elemental spectroscopy. South America’s key markets, Brazil and Argentina, focus on food testing and mining, respectively, depending heavily on ICP-OES and UV-visible spectroscopy. Australia funds groundwater-monitoring programs that mandate PFAS detection at levels below 1 ppt, thereby funding high-resolution ICP-MS instruments for long-term remediation projects.

Competitive Landscape
The analytical instrumentation market features moderate concentration: Agilent Technologies, Thermo Fisher Scientific, Shimadzu, Danaher, and Waters collectively controlled roughly 45% of 2025 revenue. These firms curate vertically integrated portfolios spanning hardware, software, consumables, and services, securing sticky customer relationships via multiyear agreements. Thermo Fisher’s Orbitrap line locks laboratories into proprietary consumables, capturing up to 80% of post-sale spend and reducing attrition.
Mid-tier competitors such as Bruker, PerkinElmer’s spin-off Revvity, and SCIEX carve out share in niche high-growth applications, including lipidomics, renewable-fuel testing, and battery materials. Specialists such as Anton Paar, Metrohm, and Malvern Panalytical exploit gaps in rheology, ion chromatography, and particle characterization, though limited service networks constrain their geographic reach. Intellectual-property filings centered on sulfur analysis for sustainable aviation fuel and laser-induced breakdown spectroscopy underscore the search for white-space opportunities.
Contract research organizations, notably Charles River Laboratories and WuXi AppTec, now purchase instruments in bulk, augmenting their bargaining power. Vendors counter by offering usage-based financing, embedded AI analytics, and ISO 17025-accredited calibration to differentiate. Regulatory compliance, software openness, and lifecycle cost increasingly trump pure instrument sensitivity as procurement drivers, reshaping competitor playbooks over the forecast horizon.
Analytical Instrumentation Industry Leaders
Agilent Technologies Inc.
Thermo Fisher Scientific Inc.
Shimadzu Corporation
Bruker Corporation
PerkinElmer Inc.
- *Disclaimer: Major Players sorted in no particular order

Recent Industry Developments
- December 2025: Thermo Fisher Scientific completed the USD 912 million acquisition of CorEvitas, expanding clinical-research capabilities and positioning mass-spectrometry platforms for biomarker discovery.
- November 2025: Agilent Technologies invested USD 150 million to enlarge its Singapore facility, adding 50,000 ft² of HPLC-column cleanroom manufacturing space.
- October 2025: Waters launched the ACQUITY Premier UPLC system featuring MaxPeak surfaces that cut analyte adsorption by 90%, targeting peptide and oligonucleotide workflows.
- September 2025: Shimadzu partnered with Yokogawa Electric to co-develop process analytical technology solutions supporting continuous pharmaceutical manufacturing.


Research Methodology Framework and Report Scope
Market Definitions and Key Coverage
Our study defines the analytical instrumentation market as all new laboratory and on-line process instruments that measure, separate or identify the chemical, physical or biological make-up of materials, covering chromatography, mass and molecular spectroscopy, elemental analysis, analytical microscopes, surface or thermal characterisation tools, associated software and essential consumables.
Scope Exclusion: revenue from refurbished equipment, generic glassware and stand-alone data loggers is not counted.
Segmentation Overview
- By Product Type
- Chromatography Instruments
- Gas Chromatography (GC) Systems
- High-Performance and Ultra-High-Performance Liquid Chromatography (HPLC, UHPLC)
- Ion Chromatography (IC) Systems
- Supercritical Fluid Chromatography (SFC) Systems
- Molecular Spectroscopy
- UV-Visible Spectrometers
- Fourier Transform Infrared (FT-IR) Spectrometers
- Near-Infrared (NIR) Spectrometers
- Raman Spectrometers
- Fluorescence Spectrometers
- Elemental Spectroscopy
- Atomic Absorption Spectrometers (AAS)
- ICP-Optical Emission Spectrometers (ICP-OES)
- ICP-Mass Spectrometers (ICP-MS)
- X-Ray Fluorescence (XRF) Spectrometers
- Mass Spectrometry
- Single Quadrupole MS Systems
- Triple Quadrupole MS Systems
- Quadrupole-Time-of-Flight (Q-TOF) MS Systems
- Orbitrap and FT-MS Systems
- MALDI-TOF MS Systems
- Analytical Microscopes and Imaging
- Scanning Electron Microscopes (SEM)
- Transmission Electron Microscopes (TEM)
- Atomic Force Microscopes (AFM)
- Confocal and Optical Microscopes
- Surface, Thermal and Particle Characterisation
- X-Ray Diffraction (XRD) Systems
- Thermal Analysis Instruments (DSC, TGA, etc.)
- Particle Size and Zeta Potential Analysers
- Consumables and Accessories
- Data Management Software and Services
- Chromatography Instruments
- By End-User Industry
- Pharmaceuticals and Biopharmaceuticals
- Drug Discovery and Development
- Manufacturing QA/QC
- Clinical and Diagnostics Laboratories
- Environmental Testing Laboratories
- Food and Beverage Testing
- Chemical and Petrochemical
- Oil and Gas (Upstream, Midstream, Downstream)
- Materials Science and Metallurgy
- Semiconductor and Electronics
- Academic and Government Research Institutes
- Forensic and Security
- Water and Wastewater Utilities
- Pharmaceuticals and Biopharmaceuticals
- By Instrument Portability
- Benchtop and Floor-Standing Instruments
- Portable and Handheld Instruments
- In-Line and On-Line Process Analysers
- By Sales Channel
- Direct Sales
- Distributors and System Integrators
- eCommerce Marketplaces
- By Geography
- North America
- United States
- Canada
- Mexico
- Europe
- Germany
- United Kingdom
- France
- Russia
- Rest of Europe
- Asia-Pacific
- China
- Japan
- India
- South Korea
- Australia
- Rest of Asia-Pacific
- Middle East and Africa
- Middle East
- Saudi Arabia
- United Arab Emirates
- Rest of Middle East
- Africa
- South Africa
- Egypt
- Rest of Africa
- Middle East
- South America
- Brazil
- Argentina
- Rest of South America
- North America
Detailed Research Methodology and Data Validation
Primary Research
Mordor analysts interviewed purchase managers at pharmaceutical plants, QA heads in food testing labs, and regional distributors across North America, Europe, China, India and the GCC. These discussions verified typical replacement cycles, average selling prices and upcoming procurement budgets, allowing us to refine growth drivers flagged during desk work.
Desk Research
We started with industry-wide datasets from bodies such as the National Institute of Standards and Technology, Eurostat trade codes, the US Food and Drug Administration's 510(k) database and the Chinese General Administration of Customs, which reveal shipment and import trends for key instrument classes. Additional insight came from trade associations like the American Chemical Society, Spectaris and the International Society for Pharmaceutical Engineering, plus peer-reviewed articles in journals such as Analytical Chemistry that highlight adoption curves for emerging techniques. Company 10-Ks, investor decks and patent analytics through Questel rounded out price points and innovation pipelines. Our paid access to D&B Hoovers and Dow Jones Factiva then helped benchmark supplier revenues. The sources listed illustrate our desk work and are not exhaustive.
Market-Sizing & Forecasting
A blended top-down and bottom-up approach underpins the model. We first sized the total addressable pool by mapping production and cross-border trade statistics to build a value baseline, then corroborated it with selective supplier roll-ups and channel checks. Key variables like installed base density per 1,000 R&D staff, annual R&D spend, pharma new-molecule pipeline, semiconductor fab capacity, and environmental lab accreditation counts drive segment shares. Forecasts employ multivariate regression with lagged effects for R&D expenditure and macro GDP, while scenario analysis tests shifts in life-science funding or semiconductor cycles. Gaps in bottom-up inputs are bridged through region-specific price bands validated during interviews.
Data Validation & Update Cycle
Outputs pass three layers of analyst review, anomaly checks against independent metrics and variance thresholds. Reports refresh each year; interim updates trigger when currency swings, regulatory shifts or large mergers materially change the outlook, and a final pass is completed just before client delivery.
Why Mordor's Analytical Instrumentation Baseline Commands Reliability
Published values often diverge because firms vary instrument scope, channel mark-ups and refresh cadence.
Major gap drivers include inclusion of used units, divergent currency assumptions, or projecting aggressive life-science spend without validating fabs or environmental labs.
Benchmark comparison
| Market Size | Anonymized source | Primary gap driver |
|---|---|---|
| USD 55.29 billion | Mordor Intelligence | |
| USD 57.67 billion | Regional Consultancy A | excludes software and consumables adjustments |
| USD 61.45 billion | Global Consultancy B | treats refurbished sales as new demand and uses constant 2024 exchange rates |
| USD 51.22 billion | Industry Association C | omits process-line analyzers installed in petrochemical plants |
Mordor's USD 55.29 billion baseline, drawn from clearly defined new-equipment scope and dual-track validation, offers decision-makers a balanced starting point that is traceable to public statistics and repeatable review steps.


Key Questions Answered in the Report
What is the current value of the analytical instrumentation market?
The analytical instrumentation market size reached USD 59.04 billion in 2026.
Which product category is growing fastest?
Data-management software and services lead with an 8.46% CAGR through 2031, reflecting the shift to cloud LIMS platforms.
Why is Asia-Pacific the fastest-growing region?
Gigafactory and sub-3 nm semiconductor investments in China, India, and South Korea require in-line particle-size, ICP-MS, and SIMS systems, driving a 7.84% regional CAGR.
How are laboratories mitigating helium shortages?
Many are validating hydrogen and nitrogen carrier-gas methods for GC that still meet USP Chapter 621 system-suitability criteria.
Which companies dominate market share?
Agilent Technologies, Thermo Fisher Scientific, Shimadzu, Danaher, and Waters collectively held about 45% of revenue in 2025.
What is the outlook for portable analytical instruments?
Portable and handheld analyzers are projected to grow at a 7.49% CAGR because field applications in oil, mining, and pharmaceutical inspection demand rapid, on-site results.
Page last updated on:


