
Oscilloscope Market Size and Share
Market Overview
| Study Period | 2020 - 2031 |
|---|---|
| Market Size (2026) | USD 4.03 Billion |
| Market Size (2031) | USD 5.87 Billion |
| Growth Rate (2026 - 2031) | 7.80 % |
| Fastest Growing Market | Asia Pacific |
| Largest Market | Asia-Pacific |
| Market Concentration | Medium |
Major Players *Disclaimer: Major Players sorted in no particular order Image © Mordor Intelligence. Reuse requires attribution under CC BY 4.0. | |
Oscilloscope Market Analysis by Mordor Intelligence
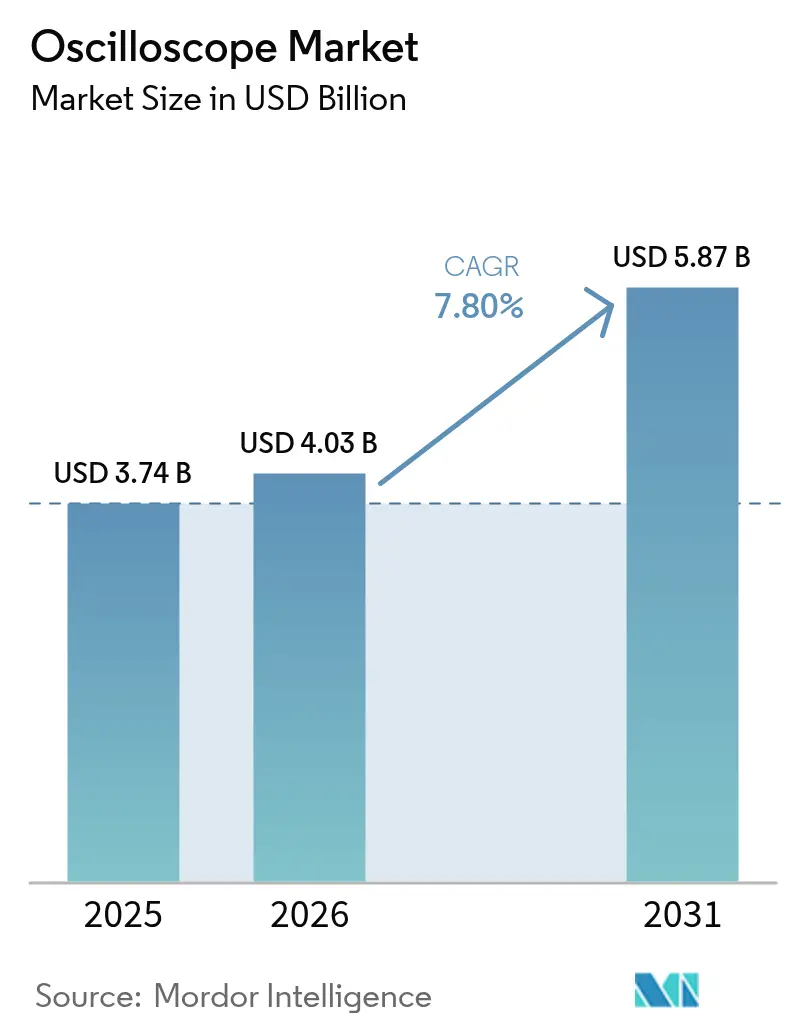
The oscilloscope market size is expected to grow from USD 3.74 billion in 2025 to USD 4.03 billion in 2026 and is forecast to reach USD 5.87 billion by 2031 at 7.8% CAGR over 2026-2031. Robust growth reflects surging demand for real-time, high-precision signal analysis as industries accelerate electric-vehicle rollouts, 5G network build-outs, and quantum-computing experiments. Automotive mixed-signal ECU designs, the commercialization of millimeter-wave radios, and tighter high-speed serial-bus margins each raise measurement complexity, pushing engineers toward higher-bandwidth, multi-channel instruments. Competitive dynamics now hinge on software-driven automation, remote-access features, and subscription pricing that lower the total cost of ownership. Supply-chain pressures around wide-bandgap A/D converters remain the chief brake on capacity expansion, yet vendors that secure component continuity and cloud-enabled workflows are poised to secure outsized share gains.
Key Report Takeaways
- By component, hardware commanded 69.52% of oscilloscope market share in 2025, while services are on track for a 9.92% CAGR to 2031.
- By type, digital/mixed-signal instruments held 51.74% revenue share in 2025; PC-based/USB variants are projected to register a 9.63% CAGR over the same horizon.
- By bandwidth, 1 GHz–4 GHz models captured 36.12% share of oscilloscope market size in 2025, whereas >4 GHz models show the highest 10.05% CAGR outlook.
- By end-user industry, automotive and transportation led with 24.95% share in 2025; IT and telecommunications is forecast to rise at a 9.42% CAGR through 2031.
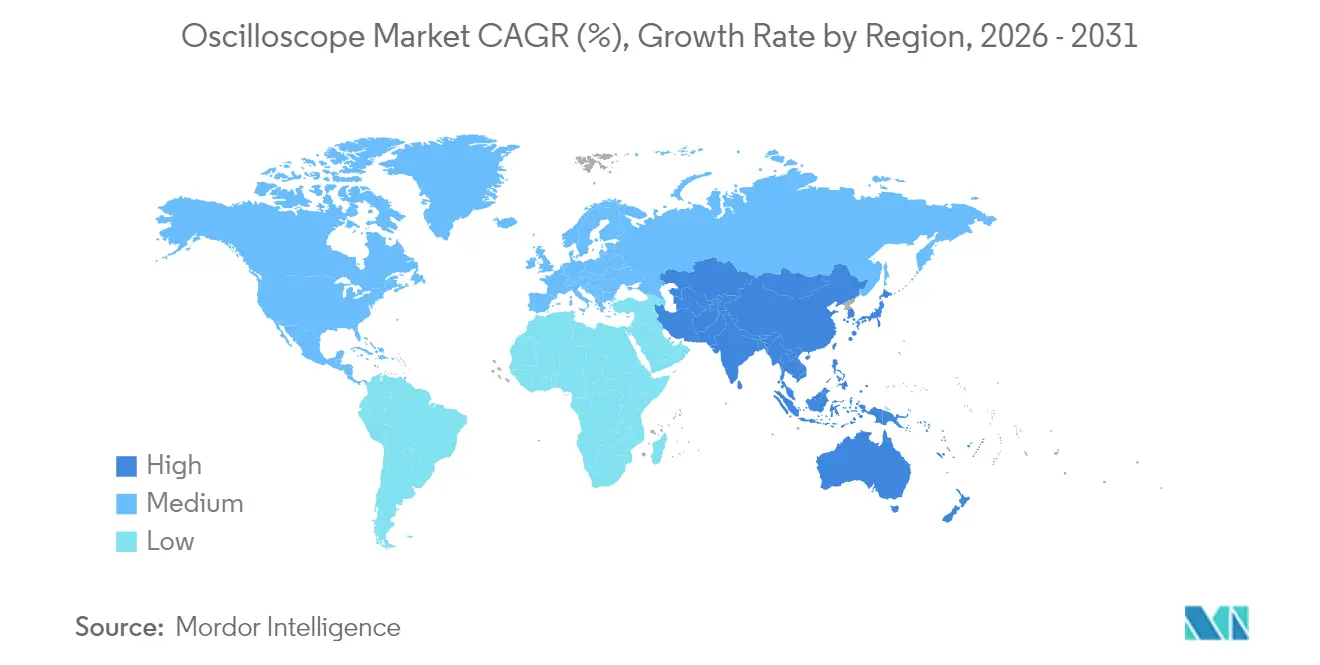
- By geography, Asia-Pacific contributed 33.05% of 2025 revenue and is set to expand at a 8.98% CAGR to 2031.
Note: Market size and forecast figures in this report are generated using Mordor Intelligence’s proprietary estimation framework, updated with the latest available data and insights as of 2026.
Market Trends and Insights
Drivers Impact Analysis of Oscilloscope Market*
| Driver | (~) % Impact on CAGR Forecast | Geographic Relevance | Impact Timeline |
|---|---|---|---|
| Accelerating adoption of mixed-signal designs in automotive ECUs | +1.2% | Global (Germany, Japan, China) | Medium term (2-4 years) |
| Rising 5G/6G RF front-end complexity | +1.8% | APAC, North America, EU | Short term (≤ 2 years) |
| Surge in high-speed serial bus standards | +1.5% | Global (Silicon Valley, Shenzhen) | Medium term (2-4 years) |
| Increased R&D funding for quantum computing instrumentation | +0.9% | North America, EU, China | Long term (≥ 4 years) |
| Growth of “oscilloscope-as-a-service” subscription pricing | +0.7% | Global (North America lead) | Short term (≤ 2 years) |
| Emergence of open-source probe ecosystems | +0.4% | Global (academia, startups) | Medium term (2-4 years) |
| Source: Mordor Intelligence | |||


Accelerating Adoption of Mixed-Signal Designs in Automotive ECUs
Automakers now integrate power-train electrification, ADAS, and over-the-air update capabilities within unified ECU architectures that blend analog sensor inputs with multi-core digital processors. As these mixed-signal environments proliferate, engineers require oscilloscopes offering synchronized analog-digital acquisition, deep protocol decoding, and domain-correlated analysis.[1]Tektronix, “Automotive Oscilloscopes,” tek.com New subsidy programs from the Japanese Ministry of Land, Infrastructure, Transport and Tourism, effective March 2025, reduce test-tool purchase hurdles for service chains, reinforcing demand pull across Asia-Pacific.[2]Ministry of Land, Infrastructure, Transport and Tourism (via Fine Piece), prtimes.jp Vendors that ship automotive-specific triggers for SENT, CAN-FD, and automotive Ethernet stand to benefit the most.
Rising 5G/6G RF Front-End Complexity Necessitating Real-Time Debug Tools
Massive-MIMO arrays, beamforming, and mmWave carrier aggregation raise measurement bandwidth requirements beyond 100 GHz while enforcing phase-coherent multi-channel capture. Keysight’s UXR-Series, delivering up to 110 GHz and 256 GSa/s, exemplifies instruments tuned for EVM and spectrum-mask validation under 5G NR FR2 conditions.[3]Keysight Technologies, “How to Test 5G NR MIMO,” keysight.com As early 6G sub-THz prototypes emerge, procurement of ultra-wide-bandwidth scopes accelerates in Korea, Japan, and U.S. research labs.
Surge in High-Speed Serial Bus Standards in Consumer Electronics
PCIe 6.0 at 64 GT/s and USB4 v2.0 push eye-diagram margins to picosecond scales, forcing measurement fidelity beyond 40 GHz with 12-bit resolution. Teledyne LeCroy’s WaveMaster 8000HD family (20–65 GHz) integrates automated PAM4 compliance libraries that cut characterization cycles for handset and laptop OEMs.[4]Teledyne LeCroy, “WaveMaster 8000HD,” teledyne.com Field teams rely on jitter-decomposition and equalization-model tools to streamline board-level revisions.
Increased R&D Funding for Quantum Computing Instrumentation
Superconducting and spin-qubit platforms mandate low-noise, high-resolution microwave readout below 20 mK. Oscilloscopes with 12-bit ADCs and high ENOB, such as Tektronix 6-Series B MSO, join custom AWGs to form closed-loop qubit-control stacks in U.S. Department of Energy labs. European collaborations between Rohde & Schwarz and IQM further spotlight the specialty-test opportunity.[5]Rohde & Schwarz, “Quantum Computing Case Study,” rohde-schwarz.com
Restraints Impact Analysis of Oscilloscope Market*
| Restraint | (~) % Impact on CAGR Forecast | Geographic Relevance | Impact Timeline |
|---|---|---|---|
| High total cost of ownership for >8 GHz models | -1.4% | Global (SME impact) | Short term (≤ 2 years) |
| Short product life cycles causing distributor inventory risk | -0.8% | Global technology hubs | Medium term (2-4 years) |
| Acute shortage of wide-bandgap A/D converters | -1.1% | Global (Asia supply chain) | Short term (≤ 2 years) |
| Cyber-security certification backlog | -0.6% | North America, EU defense | Medium term (2-4 years) |
| Source: Mordor Intelligence | |||
High Total Cost of Ownership for Greater than 8 GHz Models
Indium-phosphide front ends and precision probes lift ownership cost well above USD 200,000 for flagship scopes, limiting adoption among universities and SMEs. Factory-only calibration contracts, often exceeding USD 30,000 across five years, add further financial strain. Equipment-as-a-service programs from Electro Rent now meet pent-up demand via 12- to 36-month leases that bypass capital-expense hurdles.
Acute Shortage of Wide-Bandgap A/D Converters
Gallium-arsenide and indium-phosphide ADCs underpin real-time bandwidth above 8 GHz, yet 2025 foundry output remains constrained by export controls and Wolfspeed’s Chapter 11 restructuring. Lead times stretch beyond 50 weeks, compelling vendors to redesign front-ends or stagger product launches, thus capping oscilloscope market growth until capacity normalizes.
*Our forecasts treat driver/restraint impacts as directional, not additive. The impact forecasts reflect baseline growth, mix effects, and variable interactions.
Oscilloscope Market Segment Analysis
By Component:
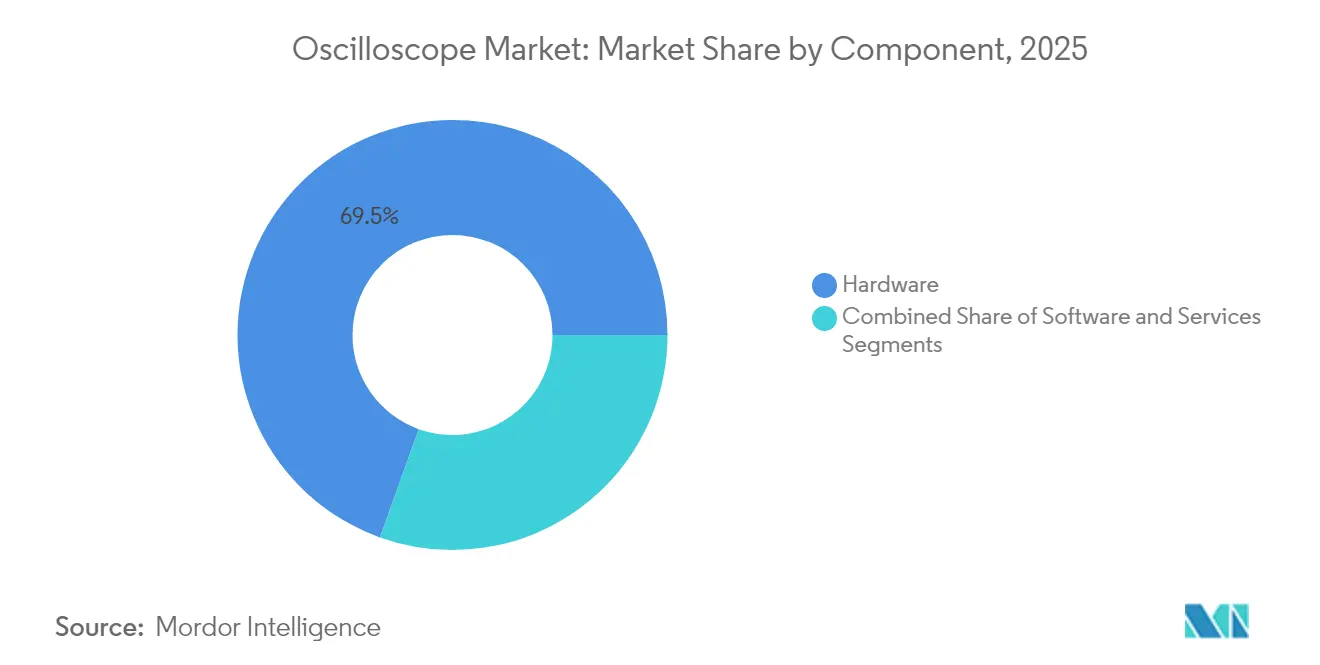
Services Drive Transformation Despite Hardware DominanceHardware provided the backbone of measurement budgets, securing 69.52% oscilloscope market share in 2025. However, services already contribute the highest 9.92% CAGR as customers pivot toward subscription access, calibration bundles, and cloud-based analytics. KeysightAccess illustrates how recurring-revenue services lower ownership friction while extending instrumentation uptime.
The oscilloscope market is gradually redefining value from product specifications to outcome assurance. Service-rich packages that combine remote diagnostics, firmware updates, and application consulting show higher renewal rates, signaling a durable shift toward solution selling. Vendors that integrate artificial-intelligence-guided measurement routines within service contracts are well-positioned to deepen wallet share.


By Type:
PC-Based Solutions Challenge Traditional ArchitecturesDigital/mixed-signal units accounted for 51.74% revenue in 2025, anchoring most R&D benches that juggle analog power stages with digital buses. Yet PC-based instruments, though starting from a smaller baseline, post a category-leading 9.63% CAGR as remote engineers seek compact, Ethernet-enabled devices. BitScope’s 100 MHz, USB-powered scopes demonstrate how software updates can unlock new decode options without hardware swaps.
As corporate policies encourage flexible work, engineers adopt laptop-centric test setups that travel between labs and field sites. While these tools lag high-end bandwidth tiers, their sub-USD 1,000 price and multi-instrument functionality resonate with education and maker communities, creating a downstream funnel for future premium-scope buyers.
By Bandwidth:
High-Frequency Applications Drive Premium Segment GrowthThe 1 GHz-4 GHz band remains the core of the oscilloscope market size, capturing 36.12% of the 2025 demand. Above this, the >4 GHz tier is set for a 10.05% CAGR on the back of 5G FR2 radios and PCIe 6.0 validation, ensuring that real-time scopes stay on engineers’ critical-tool lists. Keysight’s 110 GHz UXR line raises the ceiling, serving optical 1.6 T transceiver R&D.
Premium bandwidth growth forces parallel investment in low-loading probes, de-embedding algorithms, and automated calibration fixtures. Vendors able to deliver turnkey >40 GHz signal-integrity workflows are expected to capture incremental oscilloscope market share as serial-link roadmaps extend toward 224 G PAM4.
By End-User Industry:
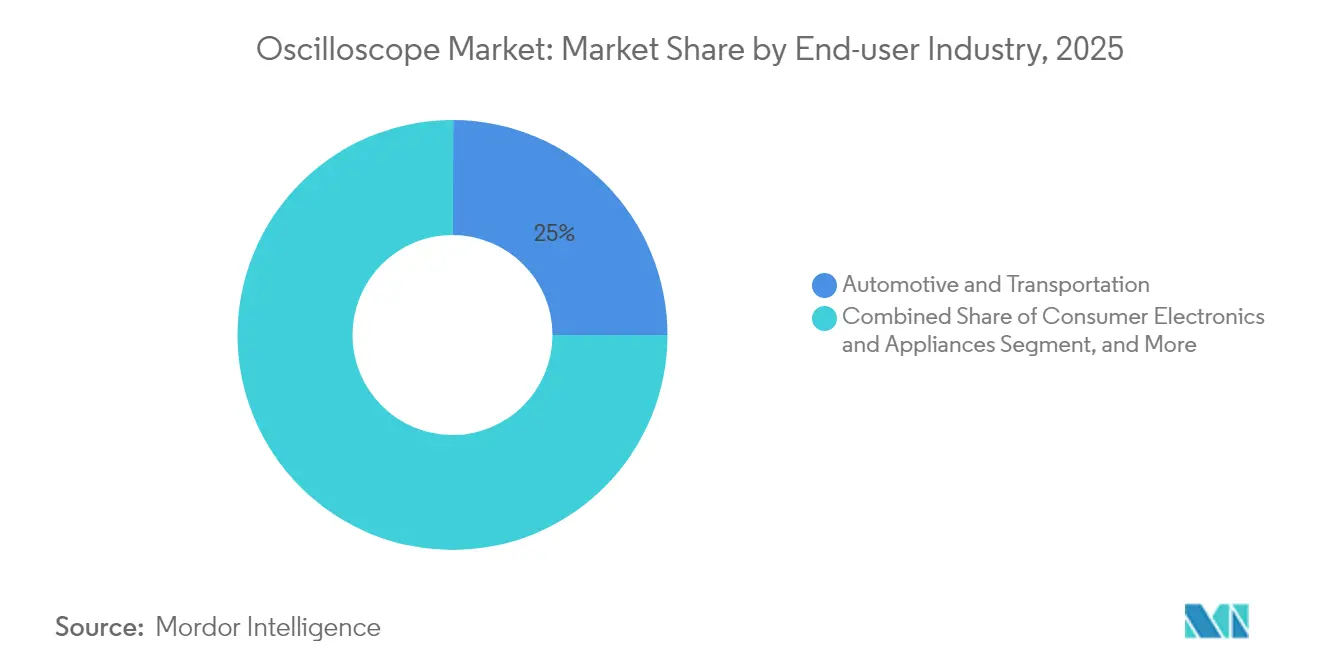
IT and Telecommunications Accelerates Past Automotive LeadershipAutomotive and transportation represented 24.95% revenue in 2025, thanks to EV powertrain and ADAS validation. Nonetheless, IT and telecommunications are projected to outpace every peer at 9.42% CAGR, buoyed by mid-band 5G densification, hyperscale data-center optics, and early 6G trial systems. National Instruments’ synchronized RF validation suites underscore telco labs’ need for multi-domain correlation.
Cross-industry convergence around high-speed serial links creates shared measurement challenges. Medical-imaging OEMs tuning MRI gradient amplifiers and aerospace primes debugging radar subsystems now leverage the same jitter-decomposition libraries originally built for PCIe 6.0, highlighting platform-economy benefits for scope makers.
By Sales Channel:
Direct Sales Maintain Premium While E-Commerce Expands AccessEnterprise-class oscilloscopes above 4 GHz still move primarily through direct-sales engineers who tailor configurations and on-site training. Middle-tier customers procure via authorized distributors that stock top-selling 500 MHz-1 GHz SKUs, minimizing lead time and financing friction. Meanwhile, e-commerce now captures design-in orders for entry-level models, with Test Equipment Connection quoting refurbished units at up to 85% savings.
Rental and leasing intermediaries like TRS-RenTelco fill episodic bandwidth spikes by shipping calibrated scopes overnight, cementing a hybrid procurement landscape. Channel partners that integrate real-time inventory apps and trade-in credits are widening addressable demand among startups and academia.
Geography Analysis
APAC Oscilloscope Market
Asia-Pacific dominated oscilloscope market revenue at 33.05% in 2025 and is heading toward a 8.98% CAGR through 2031. Local OEMs gain cost advantages from regional semiconductor ecosystems, while Chinese challengers such as RIGOL develop proprietary ADC chipsets that elevate domestic value capture. Government subsidies for automotive diagnostic gear in Japan and Korea’s aggressive 5G roll-out further underpin regional growth.
North America Oscilloscope Market
North America remains a technology vanguard, funneling large budgets into quantum-computing, aerospace, and defense programs that demand ultra-high-bandwidth oscilloscopes with stringent security certifications. Keysight’s partnership with TEVET on spectrum operations exemplifies how national-security projects drive specialized scope requirements beyond commercial norms. Despite slower aggregate growth, the region commands premium average selling prices thanks to advanced feature adoption.
Europe Oscilloscope Market
Europe’s oscilloscope landscape is anchored by German automotive engineering and pan-regional telecom infrastructure upgrades. Rohde & Schwarz leverages in-house ASIC design to ship compact eight-channel scopes optimized for vehicle Ethernet compliance. Brexit-driven logistics realignments continue to spur distributor network optimization, yet EU-wide regulatory harmonization sustains consistent demand for calibrated, traceable instrumentation.

Regulatory Landscape
Oscilloscopes are governed primarily by electrical safety and electromagnetic compatibility requirements that gate market access and shape product documentation and test regimes. In the European Union, placing an oscilloscope on the market commonly requires demonstrating conformity with the EMC Directive 2014/30/EU and Low Voltage Directive 2014/35/EU, supported by technical files and CE marking. Vendors typically align safety to EN 61010-1 and relevant parts such as EN 61010-2-030, and EMC to standards used for measurement and laboratory equipment such as EN 61326-1.
In the United States, oscilloscopes are treated as unintentional radiators/digital devices under FCC rules, commonly addressed under 47 CFR Part 15 Subpart B, with compliance measurement procedures referenced in 47 CFR 15.31. Manufacturers and importers manage market entry through FCC equipment authorization pathways (for example, Supplier Declaration of Conformity where applicable) and maintain test reports to reduce shipment delays, particularly for higher-end instruments deployed into regulated environments such as defense and aerospace labs.
Value Chain Analysis
The oscilloscope value chain starts with specialized electronic components, including high-speed ADCs/DACs, FPGAs, front-end RF components, memory, and precision probes, and then moves into instrument design (including custom ASIC and firmware), manufacturing/assembly, calibration/verification, and multi-channel distribution. Brand owners such as Keysight Technologies, Tektronix, Rohde & Schwarz, Teledyne LeCroy, and Yokogawa differentiate upstream through proprietary hardware architectures and software stacks, while mid- and entry-tier competition includes Chinese vendors such as RIGOL and Siglent that emphasize cost-efficient platforms.
Downstream, direct sales and application engineering dominate premium configurations, while distributors, VARs, e-commerce, and rental/leasing firms broaden access and help smooth episodic demand. Lifecycle services, including calibration, repair, firmware updates, and application software, form a parallel value stream and influence vendor selection through regional service footprints. The report context also points to component continuity constraints for wide-bandgap/high-speed ADC supply, which can extend lead times and force redesigns or staged launches, strengthening the case for multi-sourcing and local calibration hubs.
Competitive Landscape
The oscilloscope market exhibits a moderate concentration: the top five vendors account for ~68% combined revenue, while niche specialists thrive in application-specific corners. Tektronix, Keysight Technologies, and Rohde & Schwarz defend leadership via broad bandwidth ranges, integrated probing, and software ecosystems anchored in Python APIs and cloud collaboration.
Competition increasingly pivots on software differentiation. Automated compliance suites shave hours off test cycles, and AI-assisted setup wizards help junior engineers attain expert-level measurements quickly. Subscription programs, KeysightAccess foremost, convert one-time hardware sales into renewable revenue streams, intensifying customer-lock-in dynamics.
M&A activity accelerates as incumbents bolt on complementary IP. Viavi’s 2024 bid for Spirent and Keysight’s green light from the UK CMA in 2025 underscore sector consolidation aimed at rounding out high-speed optical and wireless test portfolios. Start-ups focusing on cloud-native measurement dashboards represent emerging acquisition targets for legacy vendors seeking digital-first growth avenues.
Oscilloscope Industry Leaders
Yokogawa Test & Measurement Corporation
Tektronix LLC
Keysight Technologies Inc.
Rohde & Schwarz GmbH & Co. KG
Teledyne LeCroy Inc.
- *Disclaimer: Major Players sorted in no particular order

Oscilloscope Market Companies Covered in this Report
- Tektronix LLC
- Keysight Technologies Inc.
- Rohde & Schwarz GmbH & Co. KG
- Teledyne LeCroy Inc.
- Yokogawa Test & Measurement Corporation
- National Instruments Corporation
- Rigol Technologies Inc.
- Fluke Corporation
- Siglent Technologies Co., Ltd.
- Pico Technology Ltd.
- B&K Precision Corporation
- Scientech Technologies Pvt. Ltd.
- Good Will Instrument Co., Ltd. (GW Instek)
- Cleverscope Ltd.
- TiePie engineering B.V.
- Advantest Corporation
- Teletek Test Solutions Ltd.
- Danaher Corporation (Tektronix brand holding)
- Anritsu Corporation
- EXFO Inc.

Market Opportunities and Future Outlook
Opportunity is expanding where oscilloscopes shift from hardware-only procurement to workflow-centric solutions that compress validation time for high-speed digital, optical, and power-integrity use cases. Keysight introduced Infiniium XR8 real-time oscilloscopes in February 2026 with the Infiniium 2026 software platform aimed at high-speed digital validation and compliance. This reflects demand for integrated compliance tooling and software-defined capabilities, not just stand-alone bandwidth specs.
A second whitespace is the convergence of power integrity and signal integrity analysis on the same bench and in remote workflows. Tektronix introduced Power Distribution Network (PDN) Analysis Software in July 2026 for 4, 5, and 6 Series B MSOs using the SEPIA methodology, aligning with the mixed-signal ECU designs and tighter high-speed serial-bus margins described in the report context. In parallel, resolution-flexible and compact form factors are being productized for embedded and field use, exemplified by Pico Technology announcing the PicoScope 5000E Series (16-bit at 200 MHz, switchable 8-bit up to 500 MHz, USB-C). These products support use cases that sit between high-precision low-noise debugging and higher-speed digital troubleshooting in constrained setups.
Recent Industry Developments in Oscilloscope Market
- July 2026: Tektronix introduced Power Distribution Network (PDN) Analysis Software for its 4, 5, and 6 Series B Mixed Signal Oscilloscopes, embedding the SEPIA methodology for power integrity analysis. The release packages transient and stability evaluation into the oscilloscope workflow, tightening the linkage between power and signal integrity debug on the same platform.
- March 2025: Keysight Technologies launched new DCA-M sampling oscilloscopes aimed at 1.6T optical transceiver testing for AI data center interconnects. This move ties oscilloscope roadmaps to high-speed optical validation needs and expands the attach opportunity for compliance and automation software in data-center-focused labs.
- September 2024: Keysight Technologies introduced the InfiniiVision HD3 Series featuring a 14-bit precision ADC for general-purpose oscilloscope applications. Higher-precision acquisition at mainstream tiers broadens addressable use cases where noise floor and measurement fidelity are purchase drivers alongside bandwidth.


Oscilloscope Market Report Scope and Research Methodology
Market Definition and Coverage
This market covers revenue generated from oscilloscopes used to view, measure, and troubleshoot electrical signals, including the associated embedded software that enables measurement, triggering, and analysis across end users.
Scope exclusions: We exclude standalone test instruments that are not oscilloscopes, such as spectrum analyzers and network analyzers, even when they are used in the same lab workflow.
Segments Covered in This Report
- By Component
- Hardware
- Software
- Services
- By Type
- Analog
- Digital/Mixed-Signal
- PC-based/USB
- By Bandwidth
- Less than 500 MHz
- 500 MHz - 1 GHz
- 1 GHz - 4 GHz
- More than 4 GHz
- By End-User Industry
- Automotive and Transportation
- IT and Telecommunications
- Consumer Electronics and Appliances
- Aerospace and Defense
- Medical and Life Sciences
- Education and Research
- By Sales Channel
- Direct
- Distributors and VARs
- E-commerce and Online Platforms
- By Geography
- North America
- United States
- Canada
- Mexico
- South America
- Brazil
- Argentina
- Rest of South America
- Europe
- Germany
- United Kingdom
- France
- Italy
- Rest of Europe
- Asia-Pacific
- China
- Japan
- South Korea
- India
- Rest of Asia-Pacific
- Middle East
- Saudi Arabia
- United Arab Emirates
- Rest of Middle East
- Africa
- South Africa
- Rest of Africa
- North America
Data Sources, Market Sizing, and Validation
Desk Research
Desk research is used to set the demand context and to avoid building the model on one data series only. We reviewed public sources such as the US Bureau of Labor Statistics for electronics and engineering employment signals, USITC trade statistics for electronics-related imports and exports, and the International Telecommunication Union for network buildout indicators tied to testing needs.
On the supply and technology side, we referenced sources such as USPTO patent publications, IEEE and other peer-reviewed engineering journals, and regulator and standards-body materials that describe test requirements (for example, EMC and RF compliance topics). Company annual reports, investor presentations, and reputable press coverage were also used to confirm product positioning and regional exposure, while a paid subscription for company financials and news was used selectively to cross-check revenue direction and corporate actions. These sources are not exhaustive, and many other public documents were referred to for data collection, validation, and clarification.
Primary Interviews and Surveys
Primary work focused on validating how oscilloscope demand is shaped by bandwidth needs, channel mix, and replacement cycles across key buying groups (electronics manufacturing, automotive and transportation electronics, telecom labs, education and research, and aerospace and defense). We also used expert inputs across APAC, EMEA, and the Americas to pressure-test ASP steps by performance tier and to confirm whether lab spending and production activity were translating into instrument purchases.
Distribution of primary research fieldwork respondents
| Company type | Respondent position | Region |
|---|---|---|
| Top tier: 33% | CXOs: 13% | APAC: 39% |
| Mid tier: 47% | Functional/Unit leaders: 41% | EMEA: 34% |
| Smaller Players: 20% | Managers: 46% | Americas: 27% |
Market-Sizing & Forecasting
Sizing was built using a top-down approach where electronics production activity and lab test intensity are converted into an addressable demand pool for oscilloscope units, and then expressed in value using realistic price ladders. To keep the numbers grounded, we then corroborated totals with selective bottom-up checks such as sampled unit shipments through key channels, supplier and distributor directionality checks, and ASP x volume sanity tests for major end-use clusters.
A few practical inputs helped shape the model, such as the mix shift toward digital and mixed-signal units, the share of demand tied to higher bandwidth classes, the replacement cycle seen in production test benches versus R&D labs, and how software features and options are priced with the hardware. Where country data was thin, gaps were handled using proxy indicators like electronics manufacturing output, telecom investment signals, and the observed regional split shared by interviewees, before being reviewed for reasonableness.
Forecasts were produced using multivariate regression, where growth was linked to electronics output, telecom upgrades, and automotive electronics complexity, and then adjusted through scenario analysis for supply constraints and pricing movement. Assumptions were stress-tested with expert feedback so the forward curve reflects what buyers and sellers are actually seeing, rather than a smooth mathematical trend.
Data Validation & Update Cycle
Outputs are validated through several checks so the final totals do not rely on one single assumption. We compare implied unit volumes and ASPs against independent market signals, and then review any sharp year-to-year moves at the region and product-performance level before sign-off.
When variances appear, the drivers are rechecked and, if needed, experts are re-contacted to confirm whether the change is real or modeling noise. Reports are refreshed annually, and interim updates are made when material events occur, such as major technology shifts, supply disruptions, or sudden end-market slowdowns. Before delivery, a fresh analyst pass is completed so clients receive an updated view based on the latest available information.
Mordor Intelligence's Oscilloscope Market Size Versus Other Published Estimates
Published oscilloscope market values can look far apart because groups do not always count the same product scope, and they also anchor pricing and mix trends in different ways. Differences in base year choice, currency timing, and whether software and services are included can all move the final number.
The main gap comes from whether optional software, paid upgrades, and service revenue are counted alongside instrument sales, where Mordor Intelligence includes these when they are packaged and monetized with oscilloscope deployments instead of treating them as a separate software market. Another driver is how ASP progression is handled across bandwidth classes, since some estimates apply one blended price curve, while others separate entry, mid, and high-performance tiers which changes the weighted average when the mix shifts.
Benchmark comparison
| Source | Market Size | Gaps in Research Methodology |
|---|---|---|
| Mordor Intelligence | USD 3.74 B (2025) | |
| Global Consultancy A | USD 2.68 B (2025) | Uses a narrower revenue view that appears closer to instrument-only sales in the base year, with less explicit treatment of paid software options and attached service revenue, which reduces the reported total. |
| Industry Publisher B | USD 3.59 B (2026) | Anchors the current market on a different starting year and applies a longer-dated growth path, which can shift the near-term value depending on currency conversion timing and how performance-tier pricing is stepped up. |
The spread in the table mainly comes down to what is counted with an oscilloscope sale and how quickly the mix is assumed to move toward higher bandwidth systems. By keeping the scope rules explicit and tying pricing and volume to observable demand indicators, we can provide a practical estimate that can be repeated and checked year after year.


Key Questions Answered in the Report
How large is the oscilloscope market in 2026?
The oscilloscope market size is valued at USD 4.03 billion in 2026, with a 7.8% CAGR forecast to 2031.
Which region leads global demand for oscilloscopes?
Asia-Pacific holds the largest 33.05% revenue share and posts the fastest 8.98% CAGR, driven by electronics manufacturing clusters.
What bandwidth segment is growing the fastest?
Devices above 4 GHz bandwidth are projected to grow at a 10.05% CAGR through 2031 as 5G, PCIe 6.0, and quantum-computing tests expand.
Why are services gaining traction in oscilloscope procurement?
Subscription access, calibration bundles, and cloud analytics reduce upfront capital outlays and deliver predictable operating costs.
How does component shortage affect instrument lead times?
Limited availability of wide-bandgap A/D converters stretches lead times beyond 50 weeks for >8 GHz scopes, constraining supply.
Which end-user vertical is the fastest growth contributor?
IT and telecommunications is set to outpace other sectors at a 9.42% CAGR, propelled by 5G densification and hyperscale data-center optics.
Page last updated on:





