
Market Overview
| Study Period | 2020 - 2031 |
|---|---|
| Forecast Data Period | 2026 - 2031 |
| Base Year Market Size (2025) | USD 58.55 Billion |
| Market Size (2026) | USD 60.98 Billion |
| Market Size (2031) | USD 75.20 Billion |
| Growth Rate (2026 - 2031) | 4.30 % |
| Market Concentration | High |
Major Players *Disclaimer: Major Players sorted in no particular order Image © Mordor Intelligence. Reuse requires attribution under CC BY 4.0. | |
United States HVAC Equipment Market Analysis by Mordor Intelligence
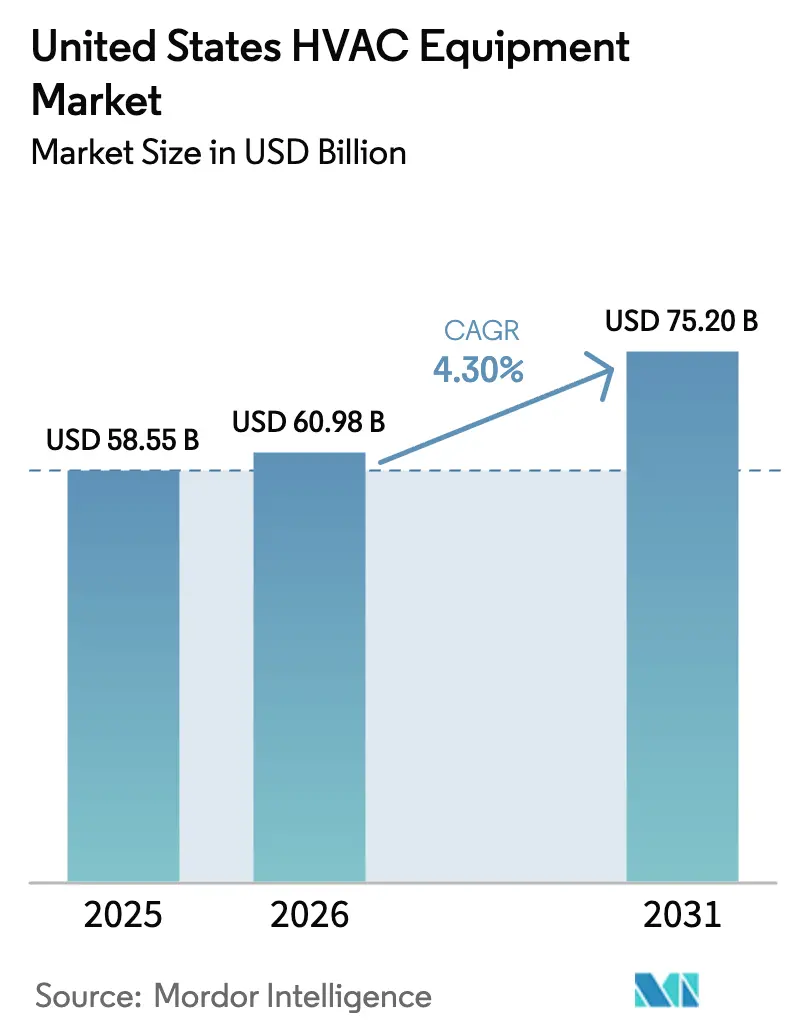
The United States HVAC Equipment Market size was valued at USD 58.55 billion in 2025 and is estimated to grow from USD 60.98 billion in 2026 to reach USD 75.20 billion by 2031, at a CAGR of 4.30% during the forecast period (2026-2031).
Strong federal electrification policies, the rapid aging of installed systems, and the mainstreaming of building automation are converging to lift demand in both residential and commercial settings. Heat-pump incentives created by the Inflation Reduction Act (IRA) have begun to redirect sales away from gas furnaces in regions once dominated by fossil-fuel heating.[1]U.S. Department of Energy, “Heat Pump Technologies,” energy.gov Simultaneously, the national refrigerant phase-down is accelerating equipment obsolescence and bringing high-efficiency, low-GWP platforms to the front of manufacturers’ roadmaps. Grid-interactive controls, predictive maintenance software, and utility rebates continue to reinforce premiumization trends, while the skilled-labour shortage imposes a natural ceiling on the annual conversion rate of the installed base.
Key Report Takeaways
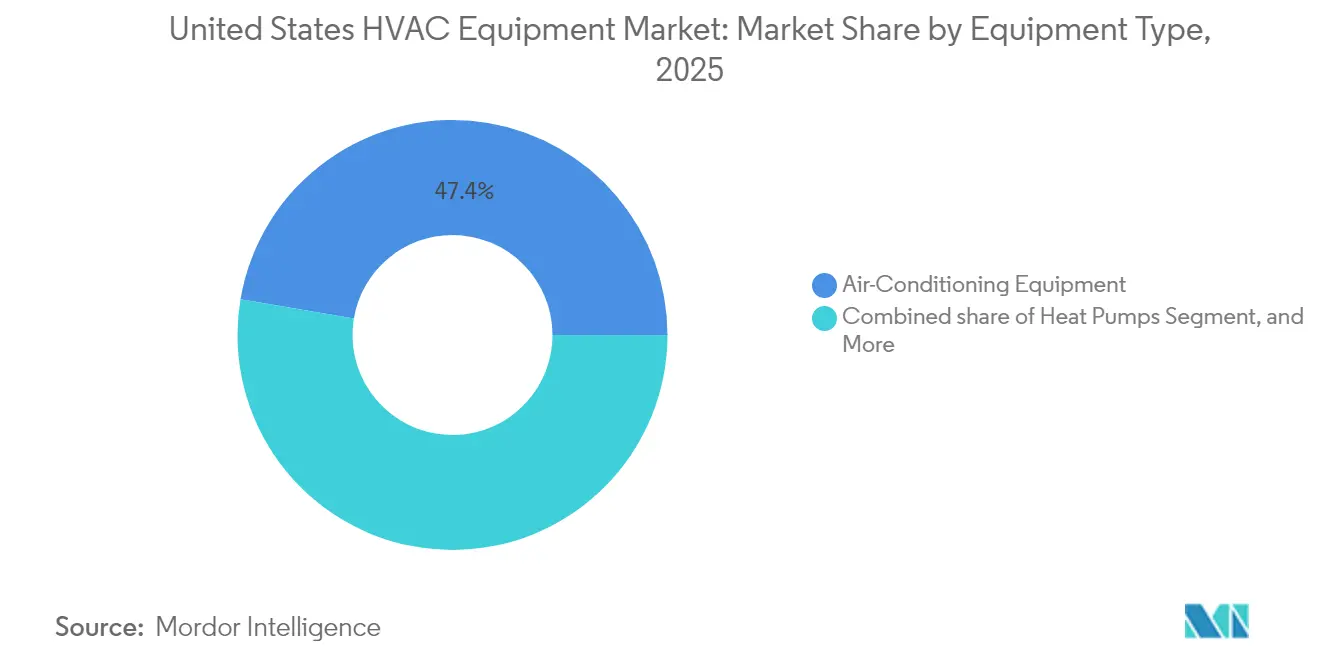
- By equipment type, air-conditioning devices captured 47.35% of the United States HVAC equipment market share in 2025; heat pumps are projected to expand at a 6.21% CAGR through 2031.
- By end user, the residential segment held 45.68% of the United States HVAC equipment market size in 2025, while commercial applications are advancing at a 5.84% CAGR to 2031.
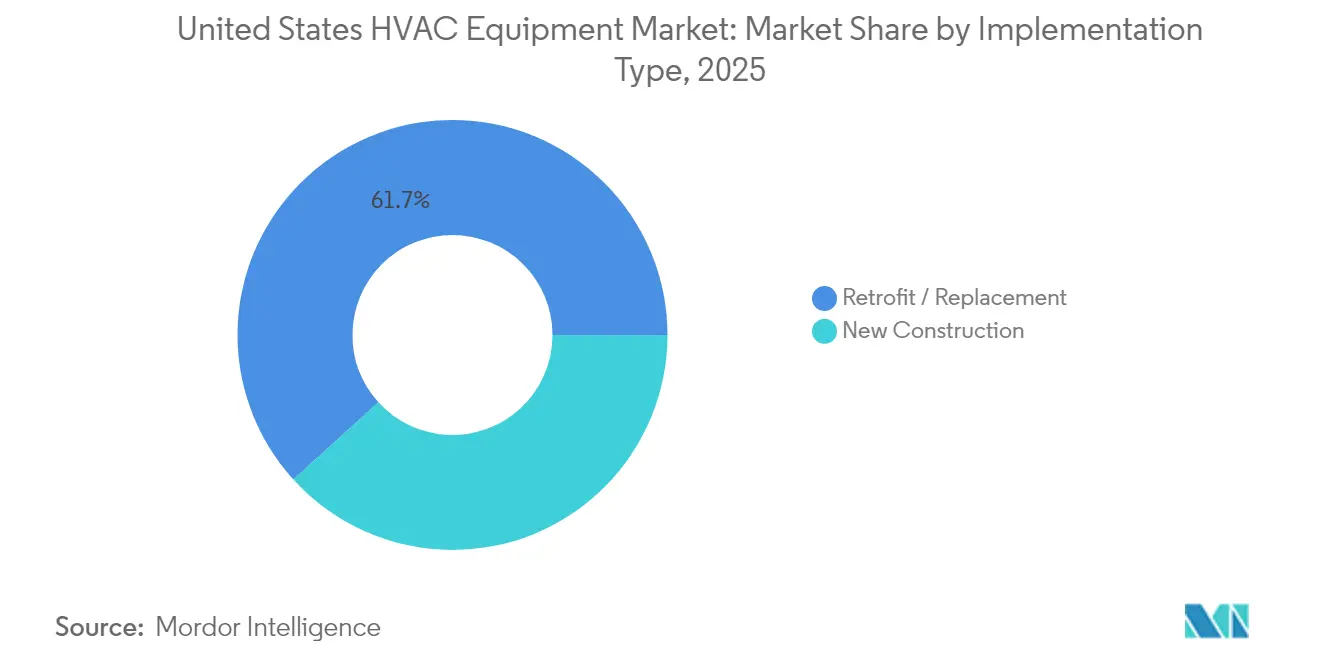
- By implementation type, retrofit and replacement projects commanded 61.74% of the United States HVAC equipment market size in 2025 and are growing at a 6.78% CAGR through 2031.
- By efficiency rating, low-efficiency products maintained a 66.12% share of the United States HVAC equipment market size in 2025; the high-efficiency tier is accelerating at a 7.02% CAGR through 2031.
Note: Market size and forecast figures in this report are generated using Mordor Intelligence’s proprietary estimation framework, updated with the latest available data and insights as of 2026.
United States HVAC Equipment Market Trends and Insights
Drivers Impact Analysis*
| Driver | (~) % Impact on CAGR Forecast | Geographic Relevance | Impact Timeline |
|---|---|---|---|
| Growing adoption of home and building automation systems | +0.80% | National, with early gains in California, New York, Texas | Medium term (2-4 years) |
| Increasing demand for energy-efficient HVAC equipment | +1.20% | National, strongest in Northeast and West Coast | Long term (≥ 4 years) |
| Stringent federal and state energy-efficiency regulations | +0.90% | National, with state variations in California, New York | Long term (≥ 4 years) |
| Accelerated equipment replacement cycles in aging building stock | +1.10% | National, concentrated in Northeast and Midwest | Short term (≤ 2 years) |
| IRA-driven heat-pump electrification incentives | +0.70% | National, highest impact in cold climate zones | Medium term (2-4 years) |
| Micro-fulfillment centre boom boosting compact HVAC demand | +0.30% | Urban centers, e-commerce distribution hubs | Short term (≤ 2 years) |
| Source: Mordor Intelligence | |||
Growing Adoption of Home and Building Automation Systems
Commercial developers and large homeowners now evaluate new units by their native connectivity as much as by efficiency. Systems with open APIs integrate seamlessly with facility management platforms, enabling schedule optimization and predictive maintenance that trim energy use by 15-20%. IoT-ready thermostats and zoning kits are becoming base-spec items, shortening replacement cycles because legacy units cannot communicate with modern software. Corporations chasing ESG targets view connected HVAC as low-hanging fruit for measurable carbon cuts, driving bulk procurement during capital-planning cycles. Integrators profit from long-tail software subscriptions, a model that reshapes how revenue is earned throughout the equipment life cycle.
Increasing Demand for Energy-Efficient HVAC Equipment
Title 24 updates, minimum SEER uplifts, and smart-grid interoperability rules have triggered field-level specification shifts toward premium gear. While high-efficiency units carry a 15-25% price premium, rising electricity tariffs and time-of-use billing tilt life-cycle economics in their favour. Utilities now pair demand-response payments with equipment rebates, nudging owners toward variable-speed compressors and cold-climate heat pumps. As electrification marches forward, peak-demand fees become pronounced, sharpening attention on kilowatt-level performance during design. Manufacturers, in response, phase variable refrigerant flow (VRF) features into mainstream product lines to satisfy code and financial metrics simultaneously.
Stringent Federal and State Energy-Efficiency Regulations
The HFC phase-down requires an 85% production cut in R-410A by 2036, compelling OEMs to redesign every high-volume chiller, rooftop, and split system around R-32, R-454B, or equivalent blends.[2]Environmental Protection Agency, “Phasing Down Hydrofluorocarbons,” epa.gov States overlay these federal rules with independent timelines New York’s Climate Leadership and Community Protection Act mandates electrification for buildings above 25,000 ft², pulling forward capital spending.[3]Climate Leadership and Community Protection Act, climate.ny.gov Compliance adds 10-15% to equipment cost, incentivizing scale and potentially choking smaller brands unable to fund dual-refrigerant portfolios. For owners, regulatory certainty clarifies the cost of procrastination, reinforcing near-term replacement decisions.
Accelerated Equipment Replacement Cycles in Aging Building Stock
Roughly 40% of commercial floor space dates back more than four decades, meaning the original chillers, boilers, and air handlers are simultaneously reaching end-of-life. Bulk failures have pushed lead times on large units to 16-24 weeks, well above historical norms. Because owners want connectivity and high efficiency in their next systems, simple component swaps no longer suffice. Instead, entire system overhauls are specified, creating a step-change in both ticket size and technological complexity. Contractors face project queues that extend quarterly, elongating revenue recognition but compressing the delivery schedule once products arrive.
Restraints Impact Analysis*
| Restraint | (~) % Impact on CAGR Forecast | Geographic Relevance | Impact Timeline |
|---|---|---|---|
| High upfront cost of advanced HVAC systems | -0.90% | National, strongest impact in price-sensitive residential segment | Medium term (2-4 years) |
| Skilled labour shortages for installation and service | -1.10% | National, acute in rural and secondary markets | Long term (≥ 4 years) |
| Electrical-grid capacity constraints for all-electric retrofits | -0.60% | Urban centers, aging grid infrastructure regions | Medium term (2-4 years) |
| Uncertain compliance costs from refrigerant phase-down | -0.40% | National, highest impact on commercial segment | Short term (≤ 2 years) |
| Source: Mordor Intelligence | |||
High Upfront Cost of Advanced HVAC Systems
Connected, high-SEER heat pumps cost 30-50% more than legacy furnaces, and adding networked controls lifts project budgets by another 15-20%. For single-family homeowners, the absence of subsidized financing keeps payback periods outside a three-year psychological threshold. Commercial real-estate operators have shortened ROI requirements to five years or less, excluding many cutting-edge offerings. While rebates alleviate some pain, funding caps inject uncertainty into long-term planning. Consequently, many buyers stage upgrades, holding on to sub-optimal solutions for another season.
Skilled Labour Shortages for Installation and Service
A forecast deficit of 115,000 HVAC technicians by 2030 threatens to limit the annual conversion rate that the United States HVAC equipment market can sustain. Smart-system commissioning now demands cybersecurity know-how alongside refrigerant-handling certification, widening the skills gap. Install-backlogs add 4-6 weeks to residential cycles and double that for complex commercial jobs, forcing property owners to run inefficient units through another peak season. Workforce training programs lag behind technology evolution, keeping labour capacity structurally tight even as demand grows.
*Our forecasts treat driver/restraint impacts as directional, not additive. The impact forecasts reflect baseline growth, mix effects, and variable interactions.
Segment Analysis
By Equipment Type: Heat Pumps Drive Electrification Shift
The United States HVAC equipment market size for air-conditioning products stood highest in 2025, when they delivered 47.35% of total value. Cooling remains the core need across U.S. climates, especially in rapidly growing Sun Belt states. Yet heat pumps, aided by federal credits, are forecast to register a 6.21% CAGR through 2031, the fastest among all categories. As cold-climate performance improves, these units take share from both gas furnaces and straight-cool splits.
Regulatory refrigerant bans will accelerate chiller replacements, and vendors that offer R-32 or R-454B compatibility are set to gain volume early in the cycle. Meanwhile, ventilation equipment rises in priority as air-quality norms evolve, and UV-C or MERV-13 filtration is increasingly embedded in packaged units for hospitality and health-care projects. The holistic turn toward indoor environmental quality keeps demand resilient even when new construction slows, supporting the long-run trajectory of the United States HVAC equipment market.



By End User: Residential Segment Leads Smart Technology Adoption
Residential buyers retained a 45.68% slice of the United States HVAC equipment market share in 2025 and are embracing smart controls at an exceptional pace. More than one-third of new single-family homes shipped with connected thermostats that link seamlessly to heat pumps eligible for up to USD 8,000 in IRA credits. While upfront cost sensitivity remains, low-interest utility loans improve the affordability of premium gear.
Commercial demand centers on building automation, occupancy-based ventilation, and ESG-aligned energy reporting. Offices and retail stores pivot toward adaptive operation strategies that cut idle energy draw. Industrial users require tighter temperature and humidity windows for production consistency, reinforcing demand for specialized, high-capacity designs. Though decision cycles lengthen, each transaction is larger, injecting stability into the overall revenue profile of the United States HVAC equipment market.
By Implementation Type: Retrofit Market Dominates Equipment Demand
Retrofit and replacement undertakings generated 61.74% of market value in 2025, far outpacing the capex tied to new construction. With 1990s-era equipment failing end masse, owners prefer whole-system swaps to ensure futureproof connectivity and compliance with low-GWP rules. The IRA sweetens economics, pushing the segment to a 6.78% CAGR to 2031.
New construction, representing the remaining 38.26%, contends with high interest rates and skilled labour scarcity. Yet every ground-breaking today specifies advanced controls and higher SEER baselines, guaranteeing a richer bill of materials per square foot. Modular system designs gain favour where project schedules are compressed, reducing on-site work and installation risk.
By Efficiency Rating: High-Efficiency Tier Accelerates Market Premiumization
Standard-efficiency units still occupy 66.12% of United States HVAC equipment market size in 2025, a reflection of contractor habit and price considerations. However, the high-efficiency cohort, growing at 7.02% CAGR, is steadily eroding that base. ENERGY STAR labelling and variable-speed technology migrate down the price curve, aided by mandatory SEER-2 thresholds that remove the lowest-tier products from the catalogue.
Cold-climate heat-pump breakthroughs further tilt the calculus toward efficient electrification in northern states. Commercial specifiers, under pressure to publish Scope-2 carbon data, increasingly pick high-efficiency VRF or dedicated outdoor-air systems with energy-recovery modules that satisfy both ventilation and energy codes in one shot.
Geography Analysis
Climatic diversity and regulatory heterogeneity shape local demand profiles across the United States HVAC equipment market. The Northeast leads high-efficiency adoption as elevated electricity rates and stringent state laws make premium equipment financially sensible. Massachusetts and New York impose building performance standards that implicitly favour inverter-driven heat pumps and advanced controls. Cold-climate breakthroughs now allow electrified heating to replace fossil systems without comfort compromises, catalysing a wave of oil-to-heat-pump conversions.
The Southeast captures significant cooling-centric growth. Florida and Texas absorb migration inflows and commercial expansions, putting air-conditioning equipment at the heart of mechanical plans. Humidity challenges spur demand for units capable of latent-load control, and mold-prevention features are routinely specified in hospitality and multifamily builds. Time-of-use tariffs across Southern utilities encourage adoption of demand-response-ready thermostats in both residential and light-commercial markets, anchoring smart-grid traction in the region.
On the West Coast, California sets the regulatory pace under its Title 24 code, a template that other states often copy. High rebate levels covering up to 60% of heat-pump installs make electrification cost-competitive with gas, even before lifecycle savings are considered. The technology sector’s dense footprint fuels specialized cooling demand for data centers, propelling sales of precision environmental control systems. Water-scarcity concerns shift preference toward air-cooled chillers, cementing a long-term equipment mix different from that in other climate zones.
Regulatory Landscape
United States HVAC equipment demand and product roadmaps are being shaped by overlapping federal rules on refrigerants and energy performance, led by the US Environmental Protection Agency (EPA) and the US Department of Energy (DOE). On refrigerants, the national HFC phase-down is pushing OEMs to redesign high-volume platforms away from legacy blends. EPA compliance provisions also include limited installation extensions through January 1, 2027 for certain VRF systems that use components manufactured or imported prior to January 1, 2026, which creates a defined transition window for commercial project planning and inventory drawdown.
On efficiency and compliance infrastructure, DOE minimum-efficiency standards and associated test procedures continue to govern central air conditioners and heat pumps, while compliance mechanics are also evolving. DOE delayed implementation of Controls Verification Procedure (CVP) provisions at 10 CFR 429.134 until July 7, 2026, easing near-term compliance timing for covered controls-related requirements. Model certification and reporting obligations still shape how quickly manufacturers can roll out refreshed, regulation-aligned product families.
Competitive Landscape
The United States HVAC equipment market features moderate concentration. Tier-one brands Carrier Global Corporation, Trane Technologies, and Daikin Industries leverage scale to spread R-D expenses tied to refrigerant shifts and IoT integration. Carrier alone commits roughly USD 200 million per year to future platforms and has earmarked additional capex to ramp heat-pump capacity at its Indiana plant. Trane’s full consolidation of its Mitsubishi Electric Trane HVAC US venture hands its direct control over VRF technology that is central to commercial electrification agendas.
While incumbents reinforce moats with dense dealer networks and nationwide after-sales operations, software-centric startups disrupt value capture. Firms such as Nest Labs and Ecobee monetize analytics and demand-response aggregation rather than hardware margins, forcing OEMs to embrace open-API philosophies. Patent filings on predictive-maintenance algorithms signal a pivot toward service-driven recurring revenue models, a notable shift from historically product-centric competition.
Niche opportunities emerge where conventional designs fall short micro-fulfilment centers require compact, high-BTU-per-cubic-foot units, and edge-data-center operators seek liquid-cooling hybrids. Mid-sized manufacturers deploy agile engineering teams to tailor solutions quickly, trading breadth for depth. As a result, the United States HVAC equipment market maintains a balanced rivalry: scale advantages endure, yet innovation opportunities remain open.[4]Carrier Global Corporation, “Corporate Responsibility and Innovation,” corporate.carrier.com
United States HVAC Equipment Industry Leaders
Daikin Industries Ltd
Lennox International Inc.
Rheem Manufacturing Company
Trane Inc. (Trane Technologies PLC)
Mitsubishi Electric Hydronics & IT Cooling Systems (Mitsubishi Electric Corporation)
- *Disclaimer: Major Players sorted in no particular order


Market Opportunities and Future Outlook
The refrigerant transition and electrification incentives are accelerating replacement and upgrade cycles across residential and commercial equipment lines, especially where owners are seeking low-GWP platforms packaged with higher-efficiency operation and native connectivity. The clearest whitespace remains in commercial retrofit segments, where VRF and rooftop systems need redesigns for low-GWP refrigerants and updated controls requirements. Manufacturers have been filling these gaps with R-32-based offerings, including Daikin's VRV EMERION commercial heat pump and heat recovery systems that use R-32, and an expanded R-32 VRV portfolio with a dedicated fresh-air solution (VKM-JM), which maps product refresh timing to regulatory-driven obsolescence of incumbent equipment.
A second opportunity area sits where grid-interactive operation meets building performance compliance, with connected controls, verification-ready commissioning, and demand-response enablement increasingly treated as part of the equipment decision rather than an add-on. DOE's delay of certain CVP provisions to July 7, 2026 gives suppliers and integrators additional runway to harden verification workflows. With retrofit and replacement already dominating market value, vendors can package equipment together with controls, monitoring, and service agreements. In light-commercial applications, Daikin's NEXIO Max rooftop heat pump using R-32 signals ongoing repositioning toward electrified, regulation-compliant packaged systems that can be specified in both replacement and new-build projects.
Recent Industry Developments
- July 2026: Daikin Comfort Technologies North America, Inc. launched NEXIO Max inverter-driven rooftop heat pump for light commercial applications using R-32 refrigerant. The launch expands high-efficiency rooftop offerings in the US HVAC market and strengthens Daikin's portfolio in commercial retrofits and new builds, supporting premiumization and regulatory alignment.
- June 2026: Daikin Industries, Ltd. expanded its R-32 VRV portfolio with the VKM-JM fresh air solution for commercial buildings. This directly impacts US demand for VRV solutions in the commercial sector and enhances Daikin’s decentralized RSU/VRV capabilities, enabling greater energy efficiency and fresh-air integration in US projects.
- May 2026: Daikin Comfort Technologies North America, Inc. introduced the Daikin VRV EMERION commercial heat pump and heat recovery systems using R-32 refrigerant. This expands high-efficiency VRV heat pump offerings in the US commercial segment and advances premiumization and refrigerant transition strategy aligned with IRA targets and low-GWP mandates.


Research Methodology Framework and Report Scope
Market Definition and Coverage
This market is counted as the value of HVAC equipment sold in the United States, covering heating, cooling, and ventilation equipment supplied into residential and commercial buildings, covering both new installations and replacement demand.
Scope exclusions: Services revenue (installation labor, maintenance, and repairs) and most non-HVAC building systems are not counted in this equipment-only market total.
Segmentation Overview
- By Equipment Type
- Air-Conditioning Equipment
- Unitary Air Conditioners
- Room Air Conditioners
- Packaged Terminal Air Conditioners
- Chillers
- Heating Equipment
- Warm-Air Furnaces (Gas and Oil)
- Boilers
- Room and Zone Heating Equipment
- Heat Pumps (Air-Source and Geo-thermal)
- Ventilation Equipment
- Air Handling Units
- Fan Coil Units
- Building Humidifiers and Dehumidifiers
- Air-Conditioning Equipment
- By End User
- Residential
- Commercial
- Industrial
- By Implementation Type
- New Construction
- Retrofit / Replacement
- By Efficiency Rating
- Low-Efficiency Tier
- High-Efficiency Tier
Data Sources, Market Sizing, and Validation
Desk Research
Desk research is used to build the market boundary and the main demand indicators that explain how much equipment is needed each year. We mainly pull public series such as U.S. Census construction spending and building permits, EIA data on heating fuels and energy use, and AHRI shipment trend releases that indicate replacement activity and product mix changes. We also reference rulemaking and program documentation (such as DOE efficiency standards and EPA refrigerant transition updates), since these can shift average selling prices and change when replacement cycles begin.
On the supply and pricing side, we cross-check company filings, investor presentations, and earnings call comments to understand revenue splits and pricing actions. A few paid subscriptions are used in a limited way for company financials, broader news and financials screening, and patent lookups to track technology intensity and timing. The desk sources listed here are illustrative only, and other public and paid references are used for data collection, validation, and clarification.
Primary Interviews and Surveys
Primary work is used to pressure-test what we learned from public data, especially on replacement behavior, channel pricing, and mix shifts across equipment types. We speak with manufacturers, distributors, contractors, and large buyers across major US climate zones so assumptions reflect real ordering patterns, not just national averages. These inputs are then used to confirm the final market totals and to align forecast drivers with what participants expect under current codes and incentive programs.
Distribution of primary research fieldwork respondents
| Company type | Respondent position |
|---|---|
| Top tier: 34% | CXOs: 12% |
| Mid tier: 52% | Functional/Unit leaders: 35% |
| Smaller Players: 14% | Managers: 53% |
Market-Sizing & Forecasting
Sizing starts with a top-down build where construction activity and installed base signals are used to reconstruct the annual demand pool for HVAC equipment in the United States. The equipment value is then derived using representative pricing.
We corroborate the total using selective bottom-up approximations, where sampled shipment volumes and typical channel ASPs are rolled up and compared against the top-down result before finalizing.
Key inputs used in the model include housing starts and permits, nonresidential floor space additions and retrofit intensity, equipment replacement cycles, DOE minimum efficiency steps that shift mix toward higher-SEER and higher-AFUE units, and refrigerant transition timing that can pull forward purchases and affect pricing. Where a direct volume series is not available for a product line, we fill gaps using proxy indicators (such as category shipment direction, construction mix, and installer feedback) and then reconcile to the full-market control totals.
Forecasting is completed using scenario analysis supported by short-run smoothing on the core drivers, and then validated with primary feedback on expected pricing and mix. Assumptions are kept traceable so a change in permits, replacement rates, or ASP progression can be seen clearly in the final forecast.
Data Validation & Update Cycle
Outputs are checked in multiple steps so the totals make sense versus independent signals like shipment direction, construction spending, and reported price moves. We run variance checks across years, look for outliers at the category level, and revisit any jump that cannot be explained by a clear driver such as regulation timing or a construction cycle change.
Before sign-off, a separate review pass is completed to confirm formulas, units, and year alignment, and then key assumptions are rechecked with select interviewees when gaps remain. Reports are refreshed annually, and interim updates are made when material events occur. An analyst then performs a final freshness pass before delivery so clients receive the latest view.
Mordor Intelligence's US Hvac Equipment Market Size Measured Against Other Published Estimates
Published market sizes for US HVAC equipment can look different even when the topic sounds similar, because scope lines are often drawn in different places and the pricing logic is not always the same. The biggest swings usually come from whether the figure is equipment-only or if it also includes installation and contractor revenue, plus how fast average prices are assumed to rise.
Key gap drivers in this market include mixing manufacturing-level revenue with downstream channel markups, counting services and parts as equipment, and using a single blended price that does not reflect the move toward higher-efficiency products. Another common difference is the base year and currency timing, where some estimates effectively blend older prices into a newer demand year. The table spread is mainly explained by counting equipment sales only, with price updates tied to efficiency and refrigerant-driven mix changes, which is then refreshed each cycle after shipment and channel checks are completed, a practice used by Mordor Intelligence.
Benchmark comparison
| Source | Market Size | Gaps in Research Methodology |
|---|---|---|
| Mordor Intelligence | USD 58.55 B (2025) | |
| Industry Data Publisher A | USD 65.30 B (2026) | This figure reflects manufacturing industry revenue for a defined set of producers, which can differ from equipment market value because imports, distributor pricing, and product coverage are treated differently. |
| Industry Research Group B | USD 33.00 B (2030) | This estimate appears narrower in equipment scope and mixes years, which can understate the total when replacement-heavy categories and higher-efficiency price premiums are not fully captured. |
Across the three figures, the main lesson is that scope and price-mix choices matter more than the math. By keeping the model tied to construction and replacement signals, and then sanity-checking with channel and shipment feedback, the result stays repeatable and easy to trace back to a short list of real-world drivers.


Key Questions Answered in the Report
How large is the United States HVAC equipment market in 2026?
It is valued at USD 60.98 billion in 2026 and is forecast to reach USD 75.20 billion by 2031.
What CAGR is expected for heat pumps through 2031?
Heat pumps are projected to post a 6.21% CAGR, the fastest among all equipment categories.
Which segment commands the greatest share of replacement demand?
Retrofit and replacement projects account for 61.74% of market value in 2025 and maintain a 6.78% CAGR outlook.
How do federal incentives influence residential adoption?
IRA tax credits of up to USD 8,000 make heat pumps cost-competitive, accelerating residential uptake.
Which regions are adopting high-efficiency systems the quickest?
The Northeast leads, driven by stringent state codes and higher electricity prices that favor premium equipment.
Why is the skilled-labor shortage a critical restraint?
A projected deficit of 115,000 technicians by 2030 extends installation lead times and caps the annual replacement rate.
Page last updated on:


 Your data is secure and never sold or shared.


