Market Overview
| Study Period | 2020 - 2031 |
|---|---|
| Forecast Data Period | 2026 - 2031 |
| Historical Data Period | 2020 - 2024 |
| Market Size (2026) | USD 37.62 Billion |
| Market Size (2031) | USD 47.71 Billion |
| Growth Rate (2026 - 2031) | 4.86% CAGR |
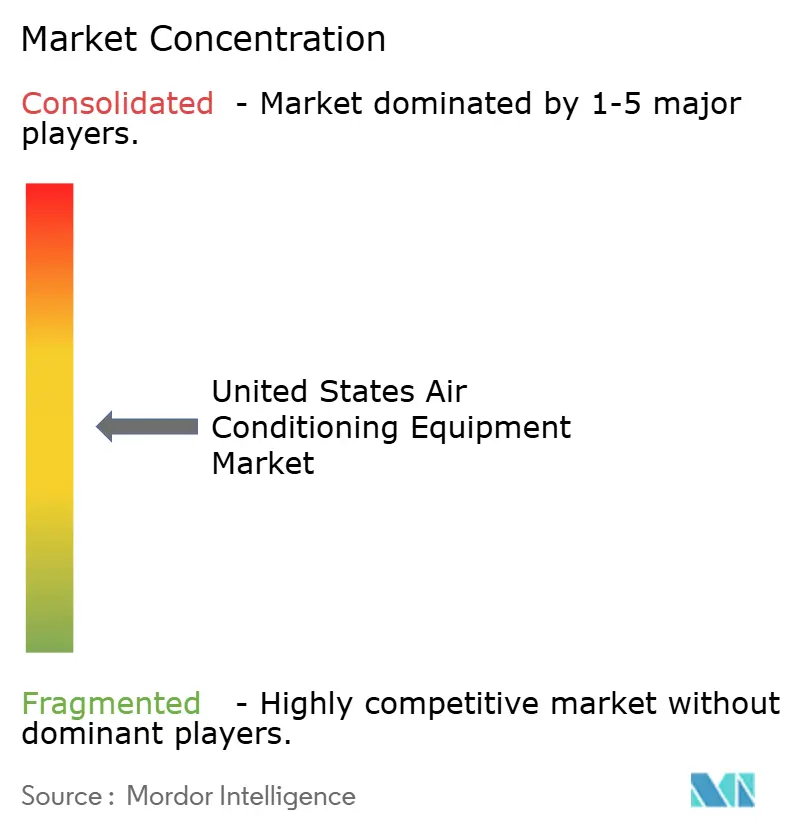
| Market Concentration | Medium |
Major Players *Disclaimer: Major Players sorted in no particular order Image © Mordor Intelligence. Reuse requires attribution under CC BY 4.0. | |

United States Air Conditioning Equipment Market Analysis by Mordor Intelligence
The United States air conditioning equipment market size is USD 37.62 billion in 2026 and is projected to reach USD 47.71 billion by 2031, reflecting a 4.86% CAGR over the forecast period. Ongoing regulatory upgrades, accelerated replacement of aging units, electrification mandates, and rising demand for smart, connected systems underpin this trajectory. Variable-speed inverter platforms dominate due to January 2023 efficiency standards that sidelined fixed-speed compressors, while heat pump shipments now outstrip gas furnace sales. Commercial retrofits in data centers and mixed-use buildings complement robust residential replacement cycles, and federal as well as state incentives continue to compress the payback period for high-efficiency equipment. Supply side investments in Gulf Coast refrigerant production and domestic compressor plants further steady the value chain, even as skilled labor shortages and PFAS policy uncertainty temper near-term momentum.
Key Report Takeaways
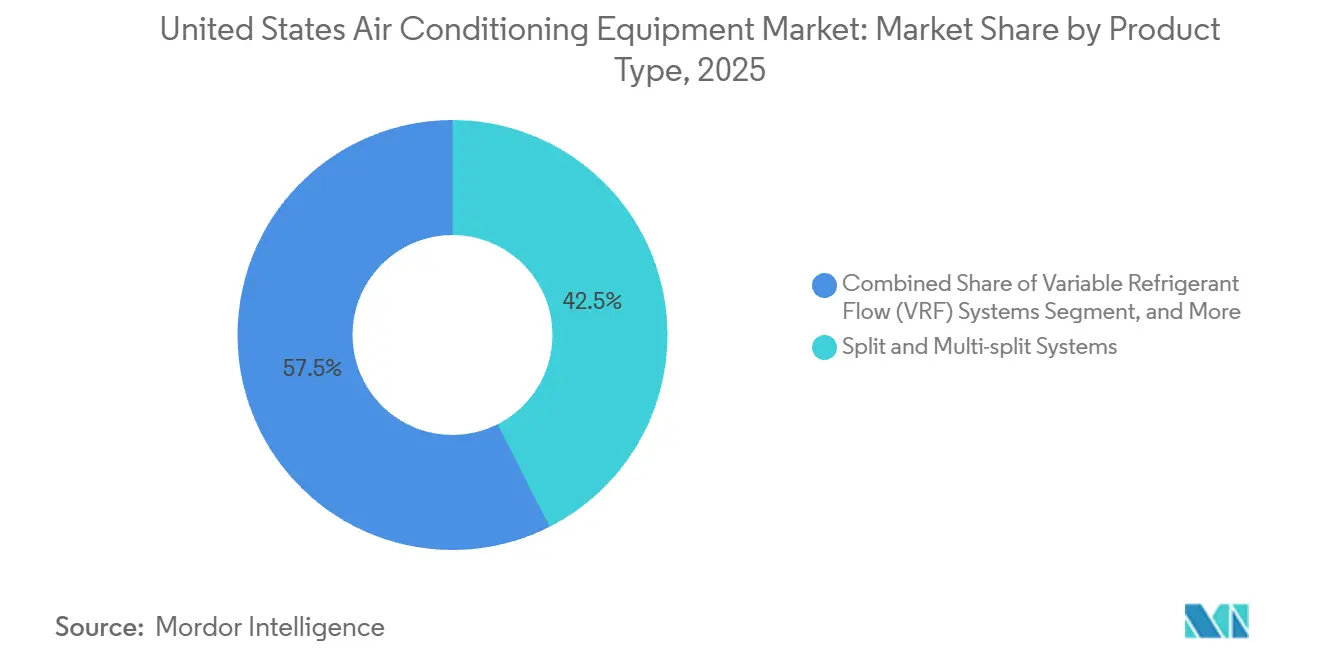
- By product type, split and multi-split systems led with 42.53% revenue share in 2025, while variable refrigerant flow systems are forecast to advance at a 5.73% CAGR through 2031.
- By technology, inverter platforms accounted for 68.86% of 2025 revenue and are projected to grow at a 5.53% CAGR to 2031.
- By end-user, residential applications captured 64.12% of the United States air conditioning equipment market share in 2025, whereas commercial installations are expected to expand at a 5.85% CAGR over 2026-2031.
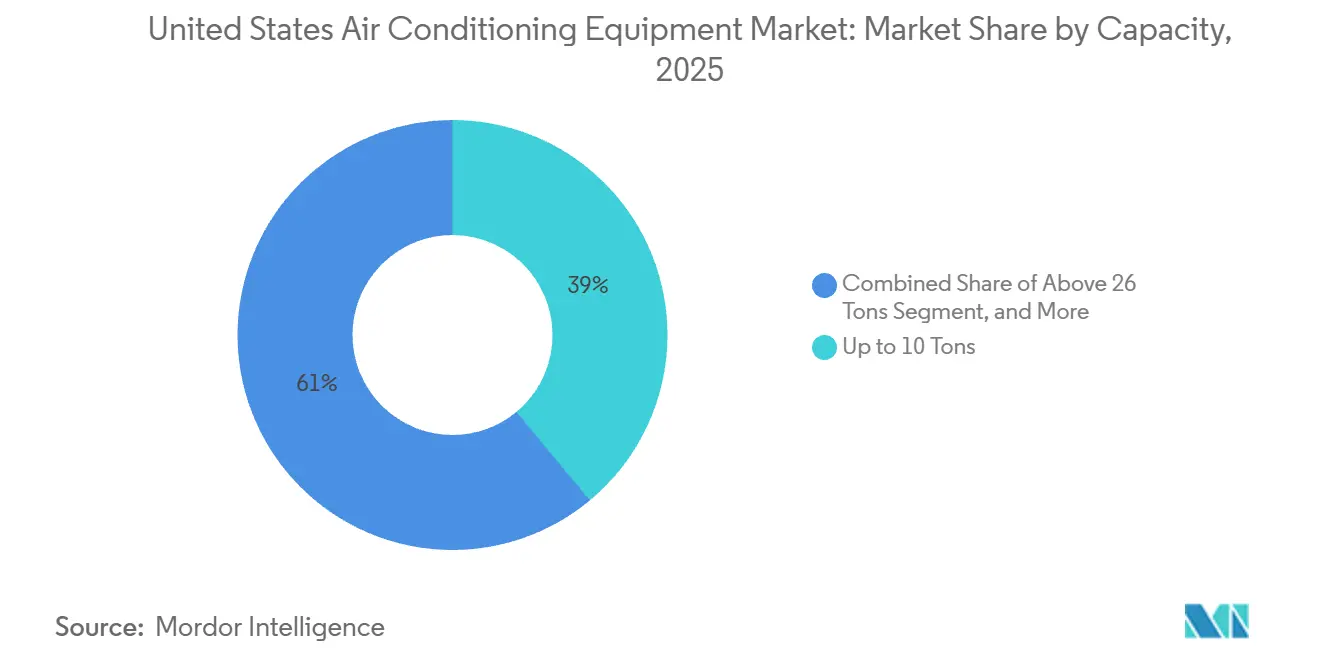
- By capacity, equipment up to 10 Tons accounted for 38.97% of the United States air conditioning equipment market share in 2025, and equipment above 26 tons of refrigeration is set to grow at a 6.01% CAGR, the fastest among all capacity bands between 2026 and 2031.
- By distribution channel, dealer and retail stores distributed 42.12% of units in 2025, yet direct sales are poised to increase at a 5.68% CAGR through 2031.
Note: Market size and forecast figures in this report are generated using Mordor Intelligence’s proprietary estimation framework, updated with the latest available data and insights as of January 2026.
United States Air Conditioning Equipment Market Trends and Insights
Drivers Impact Analysis*
| Driver | (~) % Impact on CAGR Forecast | Geographic Relevance | Impact Timeline |
|---|---|---|---|
| Replacement of Existing Systems with Energy-Efficient Units | +0.8% | National, concentration in Sun Belt states | Medium term (2-4 years) |
| Government Tax Credits and Efficiency Standards Adoption | +1.2% | National, amplified where additional rebates exist | Short term (≤ 2 years) |
| Rapid Penetration of Heat Pumps Driven by Electrification Goals | +1.4% | Northeast and Pacific Northwest, expanding to Mid-Atlantic and Upper Midwest | Long term (≥ 4 years) |
| Rising Demand for Smart and Connected AC Systems | +0.6% | National, early uptake in large metros | Medium term (2-4 years) |
| Electrification of Commercial Rooftops via Utility Thermal Energy Networks | +0.4% | Select urban cores with district energy | Long term (≥ 4 years) |
| Growth of Low-GWP Refrigerant Manufacturing Capacity in Gulf Coast | +0.3% | National supply, production in Texas and Louisiana | Short term (≤ 2 years) |
| Source: Mordor Intelligence | |||
Replacement of Existing Systems with Energy-Efficient Units
A base of more than 90 million units in 2025 translated into 35%-40% of systems operating past the 15-year design life, pushing emergency replacements toward compliant inverter equipment. Utilities in Texas and Florida reinforced this shift by paying USD 300-USD 500 for scrapping pre-2010 units, which lifted replacement volumes during peak cooling seasons. A 16 SEER2 inverter model cuts annual cooling bills by USD 200-USD 350 in hot-humid cities, yielding a five-to-seven-year payback even without tax credits. Manufacturers responded decisively, with Lennox and Rheem ending fixed-speed compressor production by mid-2024. The resulting inventory mix now steers contractors and homeowners toward higher-efficiency solutions as the default.
Government Tax Credits and Efficiency Standards Adoption
Homeowners may claim 30% of equipment and installation costs, up to USD 2,000 for heat pumps and USD 600 for central air conditioners, that meet Energy Star “Most Efficient” criteria through 2032.[1]Internal Revenue Service, “Energy Efficient Home Improvement Credit,” irs.gov Separately, the USD 8.8 billion Home Energy Efficiency Rebates Act offers point-of-sale incentives reaching USD 8,000 for qualifying heat pump projects, compressing the inverter premium from USD 3,500 to USD 1,200 in 2025.[2]U.S. Department of Energy, “Home Energy Rebate Programs,” energy.gov Commercial rules tightened as well, with the DOE mandating energy recovery ventilators on large packaged units, lifting upfront equipment prices by 8-12% but trimming lifetime operating costs 15-20%. States such as California and Washington, which prohibit fossil-fuel HVAC in most new construction after 2025, amplify these federal levers and effectively steer the specification base toward electric heat pumps and VRF systems.
Rapid Penetration of Heat Pumps Driven by Electrification Goals
Heat pump shipments reached 4.3 million units in 2024, eclipsing gas furnace volumes for the first time in five decades. Cold-climate designs that hold coefficients of performance above 2.0 at 5 °F unlocked adoption in the Northeast, where utility rebates of USD 10,000-USD 15,000 now offset 50%-60% of installed costs. New York will require all-electric new construction by 2027, while California’s Title 24 revisions raise the electric share of single-family HVAC installations to 85% in 2025.[3]California Energy Commission, “2022 Building Energy Efficiency Standards,” energy.ca.gov The Mid-Atlantic and Upper Midwest follow suit as volatility in natural gas prices and carbon penalty proposals cut into fossil fuel cost advantages. Equipment makers with proven cold-climate portfolios gain a first-mover edge in these expanding markets.
Rising Demand for Smart and Connected AC Systems
Connected thermostats and IoT-enabled controllers equipped 45% of new homes in 2025, up from 28% in 2022, reflecting builder standardization of smart packages and utility demand-response enrollment. Johnson Controls introduced OpenBlue in 2024, a cloud platform that merges HVAC, lighting, and security data, driving 12%-18% cooling energy savings in early deployments. Utilities in California, Texas, and New York together enrolled more than 2 million smart thermostats in automated curtailment programs, freeing USD 500 million in deferred grid investment. The National Institute of Standards and Technology's zero-trust architecture guidelines, published in 2024, catalyzed the segmentation of HVAC networks, limiting cyber-risk exposure. As predictive maintenance gains traction, contractors deploy data-driven service contracts that lift recurring revenue while cutting downtime for building owners.
Restraints Impact Analysis*
| Restraint | (~) % Impact on CAGR Forecast | Geographic Relevance | Impact Timeline |
|---|---|---|---|
| High Upfront Cost of Inverter and Heat Pump Technologies | -0.5% | National, acute in low-income and rural markets | Short term (≤ 2 years) |
| Supply Chain Bottlenecks in Semiconductor and Compressor Components | -0.4% | National, variable by distributor inventory | Medium term (2-4 years) |
| Skilled Labor Shortages for Installation and Service | -0.3% | National, most severe in Sun Belt states and rural areas | Long term (≥ 4 years) |
| Emerging PFAS Regulations Targeting HFO Refrigerants | -0.2% | State-level (Maine, California, Minnesota) with potential federal expansion | Long term (≥ 4 years) |
| Source: Mordor Intelligence | |||
High Upfront Cost of Inverter and Heat Pump Technologies
Installed costs for a 3-ton inverter heat pump range from USD 8,000 to USD 12,000, versus USD 5,500-USD 7,500 for a central air conditioner paired with a gas furnace, leaving a residual premium even after federal credits. Low-income households, which represent 35% of owner-occupied homes, often lack access to financing, and PACE programs remain unavailable in 22 states. Rollout delays in the Home Energy Efficiency Rebates Act meant only USD 1.2 billion of the USD 8.8 billion allocation had reached consumers by December 2025. Tariffs imposed in 2024 added 15%-25% to landed inverter controller costs, diluting manufacturer efforts to compress price premiums. Consequently, adoption lags in rural Southeast and Midwest communities, slowing near-term market penetration.
Supply Chain Bottlenecks in Semiconductor and Compressor Components
Inverter systems contain three to five times more semiconductor content than fixed-speed units, making them vulnerable to chip shortages that extended lead times to 18-24 weeks in early 2024. Domestic compressor output, even after Mitsubishi Electric’s 1.2 million-unit Kentucky plant opened in late 2024, still covers only 25%-30% of national demand. Port congestion on the West Coast added two to three weeks to shipping, prompting Carrier and Lennox to divert 15%-20% of imports to Eastern ports and Mexican assembly hubs. Component scarcity weighed heaviest on VRF projects, which integrate multiple inverter indoor units, forcing specifiers to favor traditional chiller solutions on tight timelines. Although multiple capacity expansions are underway, supply stability will take another one-to-two years to normalize.
*Our forecasts treat driver/restraint impacts as directional, not additive. The impact forecasts reflect baseline growth, mix effects, and variable interactions.
Segment Analysis
By Product Type: VRF Systems Capture Commercial Retrofit Wave
Variable refrigerant flow systems are projected to grow at a 5.73% CAGR, surpassing the broader United States air conditioning equipment market rate as building owners replace constant-volume rooftops with modular VRF architectures. In 2025, split and multi-split units held 42.53% revenue share thanks to deep penetration in single-family homes, yet multifamily developers and school districts increasingly specify VRF to cut energy use 30%-40% and free rooftop real estate.
A thriving retrofit pipeline in Class B office buildings and mixed-use properties accelerates VRF adoption. Trane Technologies partnered with Mitsubishi Heavy Industries in 2024 to localize VRF production and leverage Trane’s distribution footprint, unlocking access to a USD 4 billion commercial retrofit opportunity. Split systems remain the preferred choice in small homes, especially where ductless mini-split formats avoid costly ductwork. Packaged units keep a solid niche in light commercial spaces, though new DOE ventilation mandates raise their upfront cost and coax specifiers toward VRF for higher energy productivity.


By Technology: Inverter Dominance Reshapes Cost Structures
Inverter platforms controlled 68.86% of 2025 revenue and will expand at a 5.53% CAGR through 2031, powered by DOE minimum efficiency rules that effectively ban fixed-speed compressors in many applications. Limited pockets of resistance persist where builders push first-cost targets, yet utilities increasingly deny rebates to non-inverter products, reinforcing market migration.
Inverters vary compressor speed from 20%-100% of capacity, eliminating short-cycling and yielding 25%-35% residential and 30%-45% commercial energy savings. Electronic content rises 40%-50%, pressuring margins, yet scale economies and domestic sourcing gradually offset cost burdens. Twelve states had adopted code language by 2025 that requires inverter technology in all new residential HVAC systems, embedding the approach in future construction.
By End-User: Commercial Segment Outpaces Residential on Data Center Demand
Residential applications represented 64.12% of 2025 value, but commercial installations are set to post a 5.85% CAGR through 2031, faster than the United States air conditioning equipment market average. Hyperscale data centers from Amazon Web Services, Microsoft Azure, and Google Cloud installed 1,500 MW of new capacity in 2024-2025, each megawatt demanding up to 1.5 MW of cooling, driving record orders for large-tonnage chillers.
Single-family replacements still create a stable baseline of 6 million-7 million units per year. Yet electrification ordinances in California and New York shift new residential installations toward ducted and ductless heat pumps, marginally slowing traditional air conditioner volumes. Industrial cooling keeps pace with the overall United States air conditioning equipment market size as semiconductor fabs, food processors, and micro-fulfillment centers offset legacy plant closures.
By Capacity: Large-Tonnage Equipment Rides AI Infrastructure Wave
Units above 26 tons are forecast to grow at 6.01% CAGR, the highest among all capacity brackets, fueled by AI training clusters that release 50-70 kW of heat per rack and require high-efficiency centrifugal chillers for heat rejection. Trane’s 1,200-ton magnetic-bearing unit launched in 2024 captured roughly one-quarter of hyperscale project specs in 2025, illustrating demand for deep part-load efficiency.
Equipment up to 10 tons, which served 38.97% of 2025 revenue and underpins most single-family demand, expands at a slower 4.2%-4.5% CAGR as the installed base saturates. The 11-18 ton category, typical in restaurants and retail, grows alongside commercial construction, although VRF substitution trims rooftop counts by up to 40%. Mid-capacity machines between 19-26 tons deliver steady institutional replacement demand across schools and healthcare facilities.
By Distribution Channel: Direct Sales Gain as Contractors Consolidate
Dealer and retail stores accounted for 42.12% of 2025 unit flow, yet direct channels - spanning contractor procurement, builder supply agreements, and national accounts - are expected to expand at a 5.68% CAGR to 2031, outpacing the broader United States air conditioning equipment market. Carrier’s direct e-commerce portal, launched in 2024, already accounts for 12% of its residential shipments and offers next-day delivery to 85% of zip codes.
Contractor consolidation drives this channel shift as regional service firms acquire smaller outfits to unlock purchasing discounts and factory incentives. Production homebuilders leverage national deals with Lennox, Rheem, and Goodman, capturing 8%-10% volume rebates that wholesale distributors cannot match. Online marketplaces remain niche at 3%-5% of volume given installation complexity and state permitting, though mini-split kits sold via Amazon and Home Depot grew to 400,000 units in 2025 targeting do-it-yourself projects.
Geography Analysis
Sun Belt states, including Texas, Florida, Arizona, and California, account for more than half of residential cooling demand, with annual cooling degree days often exceeding 2,500. Heat pump adoption in these states rose to 65% of shipments in 2025, as mild winters enabled equipment to deliver space heating without backup resistance elements. California’s Title 24 update moved the share of heat pumps in new single-family homes to 85% in 2025, nearly doubling the 2022 level.
The Northeast and Mid-Atlantic are the fastest-growing regions for cold-climate models, with a 40% increase in shipments in 2024-2025, fueled by rebates covering up to 60% of installed costs. New York alone lifted orders from 120,000 units in 2023 to 280,000 in 2025 as the state accelerates toward its 2027 all-electric construction deadline. Washington and Oregon mimic this trajectory, though smaller populations cap absolute volume.
Data center build-outs in Iowa, Nebraska, Ohio, and Virginia underpin commercial growth across the Midwest and Mid-Atlantic. Urban cores such as New York City, Boston, Seattle, and Denver introduce utility thermal energy networks that replace rooftop units with centralized chilled-water service, opening opportunities for large-tonnage chillers. Rural Southeast and Plains markets lag on inverter adoption due to limited financing and workforce constraints, but manufacturing investments in Alabama, Tennessee, and Kentucky build regional supply resilience.
Competitive Landscape
The United States Air Conditioning Equipment market is moderately consolidated, with a few major companies including Daikin Industries, Carrier Global, Trane Technologies, Johnson Controls, Lennox International, and others. Domestic manufacturing is the strategic thrust as firms attempt to derisk semiconductor and compressor imports: Carrier completed USD 1 billion of U.S. plant upgrades in January 2026, Daikin finished a USD 500 million Tennessee expansion in late 2025, and Trane is adding a USD 400 million VRF plant in North Carolina by 2027.
Japanese and South Korean brands such as Mitsubishi Electric, LG Electronics, and Samsung have significant market share in 2025, primarily through leadership in ductless mini-split and cold-climate heat pump systems. Chinese entrants Midea and Gree leverage cost advantages in inverter electronics to penetrate builder channels, eroding share in price-sensitive new construction.
Competitive differentiation now turns on inverter algorithms, low-GWP refrigerant readiness, and software ecosystems. Johnson Controls’ OpenBlue captured 8%-10% of commercial retrofits by layering machine learning over HVAC, lighting, and security controls. Patent filings concentrate on variable-speed compressors, microchannel heat exchangers, and predictive analytics, averaging 1,200-1,500 HVAC submissions to the U.S. Patent and Trademark Office annually. Emerging disruptors explore CO₂ and propane refrigerants and integrate HVAC assets into virtual power plants, yet they remain below 1% of current volume.
United States Air Conditioning Equipment Industry Leaders
Daikin Industries, Ltd.
Gree Electrical Appliances Inc.
Emerson Electric Company
Hitachi-Johnson Controls Air Conditioning Inc.
Carrier Global Corporation
- *Disclaimer: Major Players sorted in no particular order

Recent Industry Developments
- January 2026: Carrier Global completed a USD 1 billion domestic expansion, adding 2 million units of annual heat pump capacity across Indiana, Tennessee, and Georgia.
- December 2025: Trane Technologies and Mitsubishi Heavy Industries formed a USD 400 million joint venture for U.S. VRF production, with a North Carolina plant slated for late 2027 start-up.
- November 2025: Daikin Industries finalized a USD 500 million Goodman Manufacturing expansion in Tennessee, boosting inverter air conditioner capacity by 1.5 million units.
- October 2025: Johnson Controls released OpenBlue Enterprise Manager 6.0, embedding generative AI to cut cooling costs up to 20%.


United States Air Conditioning Equipment Market Report Scope
Air conditioning is changing a space's temperature and air quality to improve the comfort of its occupants. With this procedure, severe natural surroundings can be adjusted to fit a person's preferences in the privacy of their homes by removing too much moisture and heat from enclosed spaces.
The United States Air Conditioning Equipment Market Report is Segmented by Product Type (Split and Multi-Split Systems, Variable Refrigerant Flow Systems, Packaged and Rooftop Units, and Chillers), Technology (Inverter Systems, and Non-Inverter Systems), End-User (Residential, Commercial, and Industrial), Capacity (Up to 10 Tons, 11-18 Tons, 19-26 Tons, and Above 26 Tons), Distribution Channel (Direct Sales, Dealer and Retail Stores, and Online). The Market Forecasts are Provided in Terms of Value (USD).
By Product Type
| Split and Multi-Split Systems |
| Variable Refrigerant Flow (VRF) Systems |
| Packaged and Rooftop Units |
| Chillers |
By Technology
| Inverter Systems |
| Non-Inverter Systems |
By End-User
| Residential |
| Commercial |
| Industrial |
By Capacity (Tons of Refrigeration)
| Up to 10 Tons |
| 11 - 18 Tons |
| 19 - 26 Tons |
| Above 26 Tons |
By Distribution Channel
| Direct Sales |
| Dealer / Retail Stores |
| Online |
| By Product Type | Split and Multi-Split Systems |
| Variable Refrigerant Flow (VRF) Systems | |
| Packaged and Rooftop Units | |
| Chillers | |
| By Technology | Inverter Systems |
| Non-Inverter Systems | |
| By End-User | Residential |
| Commercial | |
| Industrial | |
| By Capacity (Tons of Refrigeration) | Up to 10 Tons |
| 11 - 18 Tons | |
| 19 - 26 Tons | |
| Above 26 Tons | |
| By Distribution Channel | Direct Sales |
| Dealer / Retail Stores | |
| Online |


Key Questions Answered in the Report
How large is the United States air conditioning equipment market in 2026?
The United States air conditioning equipment market size is USD 37.62 billion in 2026 and is projected to reach USD 47.71 billion by 2031.
What is the forecast CAGR for United States air conditioning equipment between 2026 and 2031?
The market is expected to expand at a 4.86% CAGR during the 2026-2031 period.
Which product category is growing fastest?
Variable refrigerant flow systems are projected to rise at a 5.73% CAGR, the highest among major product types.
Why are heat pumps gaining share over traditional systems?
Federal tax credits, state rebates, and cold-climate technology advances have cut initial cost gaps and delivered strong operating savings, driving shipments past gas furnaces in 2024.
How will data center expansion affect equipment demand?
Hyperscale and AI data centers require large-tonnage chillers and precision cooling, pushing equipment above 26 tons to a 6.01% CAGR through 2031.
What role do direct sales play in distribution?
Contractor and builder direct purchasing is set to outpace dealer channels, growing at a 5.68% CAGR as consolidation boosts buying power and manufacturers launch e-commerce portals.
Page last updated on:


