Industrial Cybersecurity Market Size and Share
Market Overview
| Study Period | 2020 - 2031 |
|---|---|
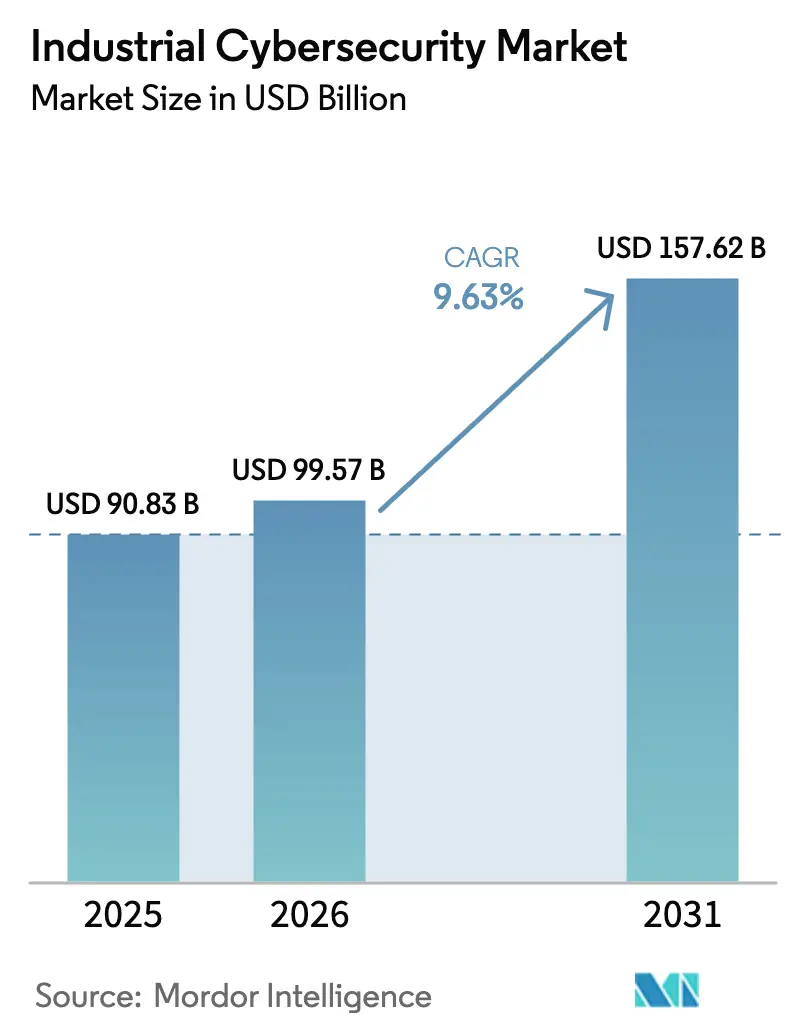
| Market Size (2026) | USD 99.57 Billion |
| Market Size (2031) | USD 157.62 Billion |
| Growth Rate (2026 - 2031) | 9.63% CAGR |
| Fastest Growing Market | Asia Pacific |
| Largest Market | North America |
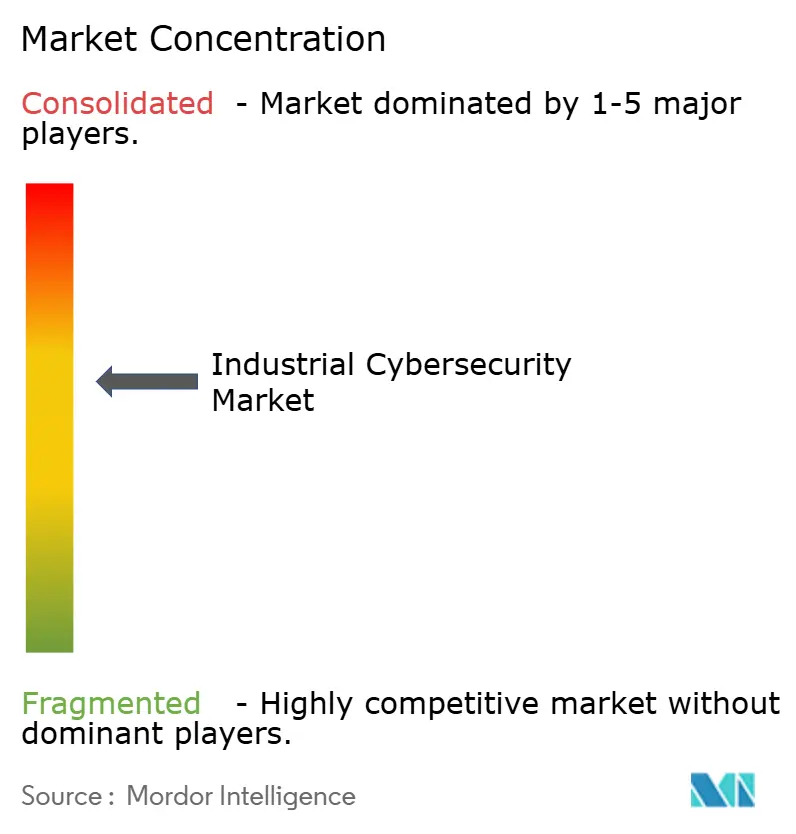
| Market Concentration | Medium |
Major Players *Disclaimer: Major Players sorted in no particular order Image © Mordor Intelligence. Reuse requires attribution under CC BY 4.0. | |
Industrial Cybersecurity Market Analysis by Mordor Intelligence
The industrial cybersecurity market size is expected to grow from USD 90.83 billion in 2025 to USD 99.57 billion in 2026 and is forecast to reach USD 157.62 billion by 2031 at 9.63% CAGR over 2026-2031. Rapid OT/IT convergence, escalating ransomware campaigns, and an expanding roster of IIoT devices are widening the threat landscape and driving sustained budget growth across asset-intensive sectors. Mandatory alignment with frameworks such as NIS 2 and IEC 62443 is tightening governance requirements, while cloud-centric security architectures and zero-trust principles are displacing perimeter-based defenses. Heightened merger activity among OEMs, cybersecurity pure-plays, and cloud vendors is reshaping competitive dynamics as vendors race to combine industrial domain knowledge with advanced analytics and AI-driven detection. Services demand is outpacing license sales as organizations seek managed support to offset persistent OT-focused talent shortages and to meet complex compliance mandates.
Key Report Takeaways
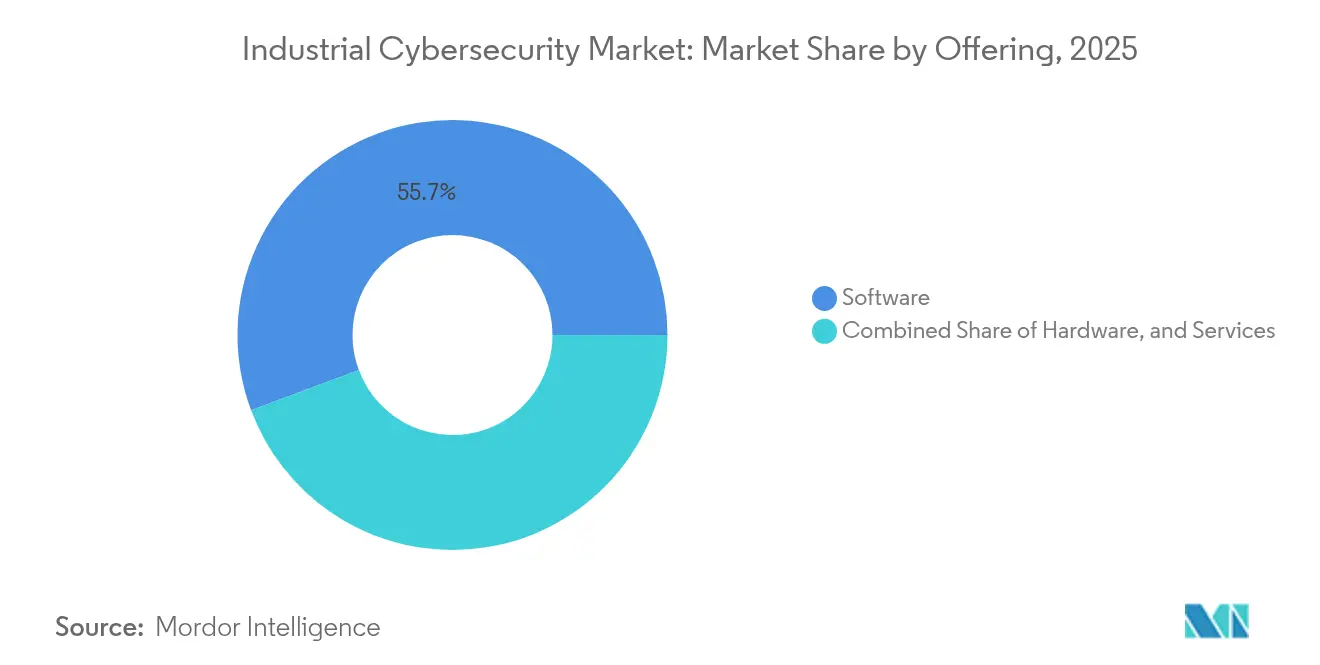
- By offering, software held 55.70% of 2025 revenue, while services are advancing at a 14.55% CAGR through 2031.
- By deployment, cloud implementations captured 54.10% of industrial cybersecurity market share in 2025; the segment leads growth at 15.48% CAGR.
- By end-user enterprise size, large organizations controlled 70.20% of industrial cybersecurity market size in 2025, but SMEs post a 14.31% CAGR to 2031.
- By security type, endpoint controls commanded 39.80% of industrial cybersecurity market share in 2025; cloud security is expanding at a 18.34% CAGR.
- By end-use industry, manufacturing led with 64.60% industrial cybersecurity market share in 2025; healthcare is the fastest mover at 16.91% CAGR.
- By region, North America accounted for 35.70% of 2025 revenue, while Asia-Pacific registers the highest regional CAGR at 14.69% through 2031.
Note: Market size and forecast figures in this report are generated using Mordor Intelligence’s proprietary estimation framework, updated with the latest available data and insights as of 2026.
Global Industrial Cybersecurity Market Trends and Insights
Drivers Impact Analysis*
| Driver | (~) % Impact on CAGR Forecast | Geographic Relevance | Impact Timeline |
|---|---|---|---|
| Industry-4.0 led OT/IT convergence boosts cyber-spend | +3.2% | Global, with concentration in North America and Europe | Medium term (2-4 years) |
| Escalating ransomware attacks on critical infrastructure | +2.8% | Global, with higher impact in North America | Short term (≤ 2 years) |
| Mandatory compliance with NIS 2, IEC 62443 and CISA directives | +1.5% | Europe, North America, with gradual adoption in Asia-Pacific | Medium term (2-4 years) |
| Surge in IIoT device volumes requiring zero-trust frameworks | +2.1% | Global, with higher adoption in manufacturing hubs | Medium term (2-4 years) |
| Edge-cloud security meshes for real-time analytics | +1.8% | North America, Europe, advanced Asia-Pacific markets | Long term (≥ 4 years) |
| Cyber-insurance premium hikes driving proactive security | +1.2% | North America, Europe | Short term (≤ 2 years) |
| Source: Mordor Intelligence | |||
Industry 4.0-led OT/IT Convergence Boosts Cyber-Spend
More than half of OT assets will be directly addressable on IT networks by 2025, creating lateral-movement paths unseen in air-gapped plants of the past [1]Telstra International, “How Cyber Risk Increases as IT and OT Systems Come Together,” telstrainternational.com. In North Asia, 88% of firms report at least one OT incident in the last 12 months, underscoring the urgency of joint visibility across engineering and security teams. Industrial enterprises cite digital twins and predictive maintenance as convergence drivers, but only 44% rank their current controls as “mature.” Managed security partners are filling gaps; 73% of global manufacturers now plan to outsource both IT and OT defenses. Boards increasingly link cyber KPIs to production uptime, placing cybersecurity alongside safety and quality as core metrics.
Escalating Ransomware Attacks on Critical Infrastructure
Ransomware incidents targeting operational technology rose 46% in 2024, and FBI complaints covering critical infrastructure climbed another 9% in early 2025. Manufacturing, energy, and healthcare facilities now experience an average of 6,000 intrusion attempts per week, with breach costs averaging USD 5.56 million per event. Threat actors such as Medusa tailor payloads for industrial protocols, heightening the value of segmentation and immutability. Executive teams are accelerating multi-layer backup, rapid isolation, and extended detection programs despite margin pressure in process industries. Insurance carriers respond by raising premiums, effectively tying policy renewal to demonstrated resilience measures.
Mandatory Compliance with NIS 2, IEC 62443 and CISA Directives
Europe’s NIS 2 Directive expands obligatory security practices to more than 15,000 additional entities and enforces fines up to EUR 10 million or 2% of global turnover for non-compliance. CISA’s cross-sector performance goals provide U.S. operators with baseline controls, while IEC 62443 is now recognized by the United Nations as the global benchmark for industrial control security. Organizations adopt unified reference architectures to streamline audits, accelerating demand for professional services and integrated platforms. Vendors emphasize “NIS 2-ready” packaging in sales cycles to shorten procurement. The regulatory tide improves baseline maturity yet also exposes legacy gaps that require phased modernization investment.
Surge in IIoT Device Volumes Requiring Zero-Trust Frameworks
Industrial IoT endpoints will exceed 29 billion by 2030, magnifying authentication and segmentation complexity. Forty-one percent of global businesses have already moved to zero-trust models; analyst studies forecast 60% penetration by 2025 as device counts soar. Real-time identity validation prevents compromised sensors from pivoting into control networks, and adaptive policies defend bandwidth-limited edge hardware. Constraints include legacy protocol compatibility and compute limits at field sites, but cloud-delivered identity brokers help overcome these hurdles. Integrators now position zero-trust as the default stance for greenfield smart-factory projects.
Restraints Impact Analysis*
| Restraint | (~) % Impact on CAGR Forecast | Geographic Relevance | Impact Timeline |
|---|---|---|---|
| Scarcity of OT-focused cyber talent | -1.8% | Global, with severe impact in emerging markets | Medium term (2-4 years) |
| Legacy brown-field installations with proprietary protocols | -1.5% | Global, with higher concentration in mature industrial markets | Long term (≥ 4 years) |
| CFO push-back amid margin pressure in process industries | -1.2% | Global, with higher impact in cost-sensitive markets | Short term (≤ 2 years) |
| Fragmented OT vendor ecosystem complicates interoperability | -0.9% | Global | Medium term (2-4 years) |
| Source: Mordor Intelligence | |||
Scarcity of OT-Focused Cyber Talent
A forecast 3.5 million cyber vacancies will remain unfilled by 2025, with the steepest shortage in roles requiring both engineering and security acumen. Skills gaps lengthen incident containment, adding USD 1.76 million to average breach costs. Forty-eight percent of manufacturers plan to reskill employees for cyber duties, but training cycles trail threat evolution. Emerging markets face stricter constraints, driving 73% of operators to managed service contracts. Salary inflation is prompting multinationals to establish regional cyber hubs near talent pools, yet certification pipelines have not scaled at the same pace.
Legacy Brown-Field Installations with Proprietary Protocols
Claroty’s 2025 audit uncovered 111,000 OT devices with known exploitable vulnerabilities, 68% linked to ransomware toolchains. Industrial assets often remain active for 15–20 years—long beyond vendor patch commitments—locking plants into unsupported firmware. Proprietary networks hamper standard encryption and monitoring, producing blind spots exploited by advanced actors. Operators must weigh downtime, regulatory exposure, and capital replacement cycles when hardening legacy estates. Compensating controls such as inline intrusion detection and secure data diodes are therefore prioritized in phased remediation roadmaps.
*Our forecasts treat driver/restraint impacts as directional, not additive. The impact forecasts reflect baseline growth, mix effects, and variable interactions.
Segment Analysis
By Offering: Services Momentum Surpasses Solutions Growth
Solutions still hold 55.70% revenue, yet service lines—managed detection, incident response, and compliance consulting—are on track for 14.55% CAGR through 2031. Companies lacking round-the-clock SOC staff tap managed detection and response subscriptions that promise sub-15-minute alert triage. Professional services draw demand from the industrial cybersecurity market size allocated to audit preparation, framework mapping, and continuous improvement cycles. Regulations such as NIS 2 push multi-site operators toward standardized controls, fostering recurring engagements. Solution vendors increasingly bundle hardware firewalls and anomaly-detection software with multi-year service wraps to create predictable annuities.
The industrial cybersecurity market share for services rises as boards realize that technology alone cannot close capability gaps. Engagement scopes now include tabletop exercises, emergency response retainers, and secure-by-design reviews during digital-twin rollouts. Vendors highlight certifications—IEC 62443-3-3 assessments or ISO 27001 roadmaps—to differentiate in a crowded advisory space.


By Deployment: Cloud Dominance Reflects Architectural Shift
Cloud deployments account for 54.10% of current spend and represent the fastest track of the industrial cybersecurity market, growing at 15.48% CAGR. Shared responsibility models enable rapid security updates and centralized asset discovery across distributed factories . Multi-tenant analytics engines ingest telemetry from thousands of pumps, drives, and PLCs, correlating anomalies that single-site tools miss. Edge-cloud meshes bring compute next to machinery for millisecond decision-making while tiered cloud layers run heavier analytics engines.
On-premise remains mandatory for air-gapped utilities and defense plants, yet even these sectors pilot hybrid models, using secure brokers to govern selective data flows. The industrial cybersecurity market size for hybrid deployments is forecast to surpass pure on-premise spend by 2028 as organizations balance sovereignty with agility.
By End-user Enterprise Size: SMEs Accelerate Security Investments
Large enterprises wield 70.20% share, but SME outlays rise at 14.31% CAGR, tied to rising attacker focus—43% of 2024 breaches impacted smaller firms. Consumption-based cloud controls reduce up-front costs, while government subsidies and cyber clinics help resource-constrained manufacturers meet baseline mandates. Managed service bundles such as Telefónica Tech’s “Tu Empresa Segura” include EDR, secure VPN, and 24 × 7 monitoring, providing enterprise-grade protection without capital expenditure.
They pioneer digital twins, AI-driven inspection, and deception grids that smaller firms adopt later at reduced cost. Consolidated procurement yields volume discounts, but agility favors SMEs that can greenfield zero-trust architectures without legacy drag.
By Security Type: Cloud Security Leads Innovation Wave
Endpoint defenses capture 39.80% share, yet cloud security posts a 18.34% CAGR as workloads migrate to multi-cloud architectures. Misconfiguration, credential reuse, and supply-chain exploits top cloud risk registers. Customers deploy cloud security posture management to reconcile divergent policies across AWS, Azure, and on-premise OpenStack. Network segmentation stays foundational in OT, but application and data-centric controls gain urgency after notable source-code poisoning events.
Extended detection and response (XDR) packages converge endpoint, network, and cloud streams into curated alerts, reducing mean-time-to-detect by 44% in early adopter studies. Vendors integrating asset context—location, firmware version, process criticality—outperform generic IT-focused platforms for industrial use cases.

By End-use Industry: Manufacturing Dominance, Healthcare Acceleration
Manufacturing commanded 64.60% industrial cybersecurity market share in 2025 and remains attackers’ top target, responsible for 25.7% of all breaches. Plants budget 7% of IT spending for cyber—up from 6% in 2024—and 95% of operators plan to embed AI/ML analytics to spot anomalous production-line behaviors.
Healthcare shows the fastest trajectory at 16.91% CAGR. Connected imaging devices and hospital information systems lure attackers with high-value personal data; a single record fetches up to USD 1,000 on illicit markets. Breach notifications affected 70% of U.S. residents in 2024, forcing boards to elevate cybersecurity to patient-safety status. Energy, utilities, and defense sectors intensify investment under geopolitical tension, embedding encryption, anomaly detection, and secure remote access into grid-modernization projects.
Geography Analysis
North America retains 35.70% share, propelled by CISA performance goals and a dense vendor ecosystem. Ransomware complaints on U.S. critical infrastructure rose 9% in 2025’s first quarter.
Asia-Pacific records the fastest CAGR at 14.69%. China, Japan, and India modernize fast, while Malaysia expects cybersecurity staffing to surge from 15,248 to 27,000 by 2025, a 17.05% CAGR . Government stimulus and local framework rollouts fuel demand for managed service providers that bridge talent gaps.
Europe’s momentum is regulatory-driven, anchored by NIS 2 and the Cyber Resilience Act. Trend Micro’s Cyber Risk Index shows the region posting the sharpest risk-score improvement in 2025. Organizations accelerate zero-trust adoption and cloud migration while audit teams enforce EUR-level penalties for non-compliance.


Competitive Landscape
The industrial cybersecurity market skews toward vendors coupling factory automation pedigree with cyber competence. Siemens and Palo Alto Networks jointly deliver threat-aware firewalls embedded in automation gear. Consolidation remains brisk; Cisco averages five security acquisitions annually to fill AI analytics and OT detection gaps.
Specialists such as Dragos and Claroty address asset discovery, protocol-aware DPI, and incident response for control systems. Vendors differentiate on IEC 62443 certifications, AI-powered risk scoring, and service breadth. Cloud hyperscalers expand into OT security, partnering with OEMs to deliver secure industrial edge nodes, intensifying coopetition.
Players rank market opportunities in securing brown-field edge environments, where legacy equipment and low-bandwidth links defy conventional IT tools. Solutions embedding lightweight agents or agentless network sensors gain traction among process manufacturers reluctant to shut down lines for upgrades.
Industrial Cybersecurity Industry Leaders
Siemens AG
Fortinet, Inc.
ABB Ltd.
Honeywell International Inc.
Schneider Electric SE
- *Disclaimer: Major Players sorted in no particular order

Recent Industry Developments
- June 2025: Honeywell issued its 2025 Cyber Threat Report, citing a 46% ransomware surge against OT systems and ranking USB plug-and-play vectors among the top incident causes.
- April 2025: Hewlett Packard Enterprise broadened its Aruba Networking and GreenLake services with threat-adaptive controls that auto-isolate sites to comply with DORA.
- February 2025: Claroty released “State of CPS Security 2025,” listing 111,000 exploitable OT devices and confirming manufacturing as the most exposed vertical.
- October 2024: Kaspersky has rolled out upgraded cybersecurity solutions specifically designed for industrial firms, aiming to combat the rising cybersecurity threats targeting operational technologies (OTs) and critical infrastructure.


Research Methodology Framework and Report Scope
Market Definitions and Key Coverage
According to Mordor Intelligence, the industrial cybersecurity market captures all hardware, software, and managed services deployed to protect Operational Technology and Industrial Control Systems across factories, utilities, oil and gas fields, and other critical infrastructure. The study values revenue earned from prevention, detection, response, and recovery solutions that sit inside or straddle OT networks, including secure gateways, endpoint agents, anomaly-detection platforms, and specialist services.
Scope exclusion: standard IT-only security spending for office networks or consumer IoT devices is kept outside the model.
Segmentation Overview
- By Offering
- Hardware
- Firewalls and Gateways
- Intrusion Detection and Prevention (IDPS)
- Security Appliances (UTM)
- Networking Devices
- Industrial Routers and Switches w/ Embedded Security
- Other Hardware
- Software
- Services
- Managed Services
- Professional Services
- Hardware
- By Deployment
- On-premise
- Cloud
- Hybrid
- By End-user Enterprise Size
- Large Enterprises
- Small and Medium Enterprises (SMEs)
- By Security Type
- Endpoint Security
- Network Security
- Cloud Security
- Application Security
- Other Security Types
- By End-use Industry
- Aerospace and Defense
- Energy and Utilities
- BFSI
- Healthcare
- Oil and Gas
- Chemical
- Government Organizations
- Manufacturing
- Other End-use Industries
- By Geography
- North America
- United States
- Canada
- Mexico
- South America
- Brazil
- Argentina
- Rest of South America
- Europe
- Germany
- United Kingdom
- France
- Italy
- Spain
- Russia
- Rest of Europe
- Asia-Pacific
- China
- Japan
- India
- South Korea
- Australia and New Zealand
- Rest of Asia-Pacific
- Middle East and Africa
- Middle East
- Saudi Arabia
- United Arab Emirates
- Turkey
- Rest of Middle East
- Africa
- South Africa
- Nigeria
- Egypt
- Rest of Africa
- Middle East
- North America
Detailed Research Methodology and Data Validation
Primary Research
Conversations with plant engineers, OT integrators, and regional CERT officials across North America, Europe, and Asia clarified real attack frequency, average security spend per production line, and adoption timelines for zero-trust. Short surveys of solution providers verified price dispersion for threat-detection licenses and managed response retainers.
Desk Research
Our analysts began with public domain anchors such as US CISA advisories, ENISA threat reports, IEC 62443 drafts, and UN Comtrade flow codes for industrial routers. Government cyber budgets, trade-body surveys from MESA and ISA, plus listed vendor 10-Ks supplied baseline shipment, pricing, and installed-base clues. Paywalled snapshots from D&B Hoovers and Dow Jones Factiva helped validate company revenues and merger activity. The sources cited here are illustrative; a wider pool was reviewed to cross-check data and close gaps.
Market-Sizing & Forecasting
We first built a top-down demand pool using global manufacturing value added, yearly IIoT node counts, ransomware incident tallies, regulatory rollout timetables, and average security outlay per facility, which are then aligned with industrial production indices to reflect cyclical shifts. Selective bottom-up supplier roll-ups and channel checks act as reasonableness tests. Forecasts to 2030 rely on a multivariate regression that links spend to IIoT growth, attack prevalence, and compliance deadlines, with scenario analysis adjusting for macro shocks. Data shortfalls in niche geographies are bridged by ratio-based proxies derived from similar industry structures.
Data Validation & Update Cycle
Outputs pass three-layer variance tests, peer review, and senior analyst sign-off. We refresh models annually and trigger interim updates after major regulatory changes or material breaches; a brief reconfirmation with key respondents precedes every client delivery.
Why our Industrial Cybersecurity Baseline commands trust
Published estimates often diverge because firms select dissimilar scopes, refresh cadences, and pricing assumptions.
Key gap drivers include whether OT services are bundled with enterprise IT security, how legacy maintenance contracts are treated, currency conversion points, and the snapshot year each publisher uses.
Benchmark comparison
| Market Size | Anonymized source | Primary gap driver |
|---|---|---|
| USD 90.83 B (2025) | Mordor Intelligence | - |
| USD 93.73 B (2025) | Global Consultancy A | Includes IT cloud security and cyber-insurance revenues, single mid-2024 refresh |
| USD 52.93 B (2025) | Industry Association B | Omits managed services and counts hardware at factory gate prices only |
| USD 25.34 B (2025) | Trade Journal C | Focuses on discrete manufacturing, excludes energy, utilities, and oil and gas |
The comparison shows that once common scope filters and consistent service definitions are applied, Mordor's balanced approach offers a dependable, transparent baseline that decision-makers can replicate and audit with limited effort.


Key Questions Answered in the Report
What is the industrial cybersecurity market worth today?
The market is valued at USD 99.57 billion in 2026 and is forecast to reach USD 157.62 billion by 2031.
Which deployment model leads growth?
Cloud-based architectures hold 54.10% share and register the fastest growth at a 15.48% CAGR through 2031.
Why are managed services gaining traction?
Service adoption offsets a global OT talent shortage and helps plants comply with frameworks such as NIS 2 and IEC 62443.
Which sector spends the most on industrial cybersecurity?
Manufacturing commands 64.60% of the 2025 market due to high attack frequency and costly production downtime.
Who are the primary threat actors targeting industrial facilities?
Sophisticated ransomware groups like Medusa now tailor payloads for industrial protocols, exploiting legacy equipment and weak segmentation.
How does zero-trust architecture improve OT security?
Zero-trust validates each user, device, and data flow, preventing lateral movement across converged IT/OT networks and safeguarding IIoT devices.
Page last updated on:


