
Market Overview
| Study Period | 2020 - 2031 |
|---|---|
| Forecast Data Period | 2026 - 2031 |
| Base Year Market Size (2025) | USD 3.64 Billion |
| Market Size (2026) | USD 4.05 Billion |
| Market Size (2031) | USD 6.93 Billion |
| Growth Rate (2026 - 2031) | 11.31 % |
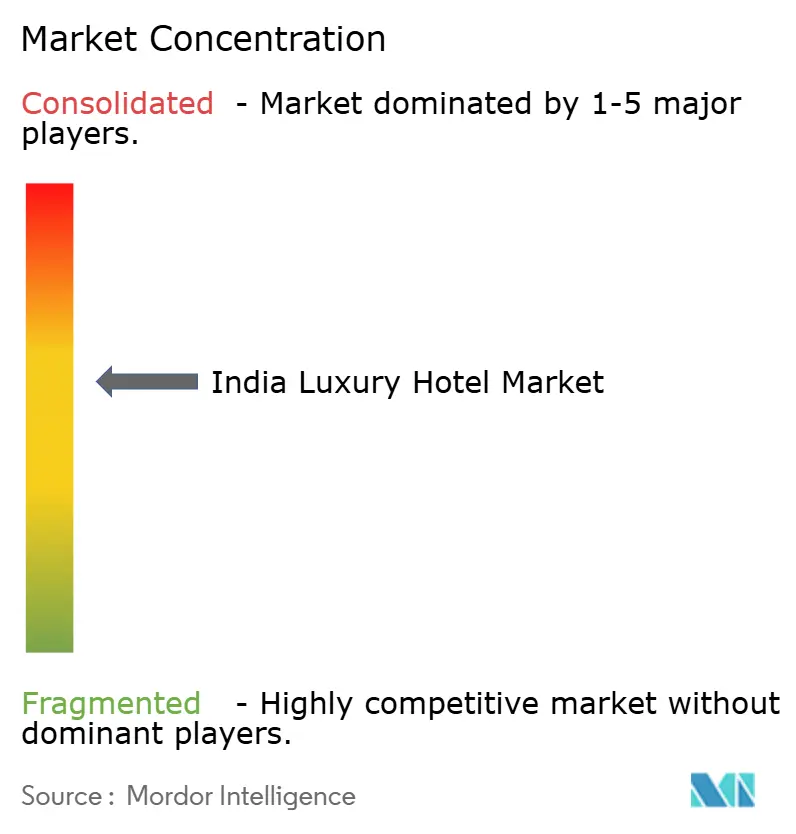
| Market Concentration | Medium |
Major Players *Disclaimer: Major Players sorted in no particular order Image © Mordor Intelligence. Reuse requires attribution under CC BY 4.0. | |
India Luxury Hotel Market Analysis by Mordor Intelligence
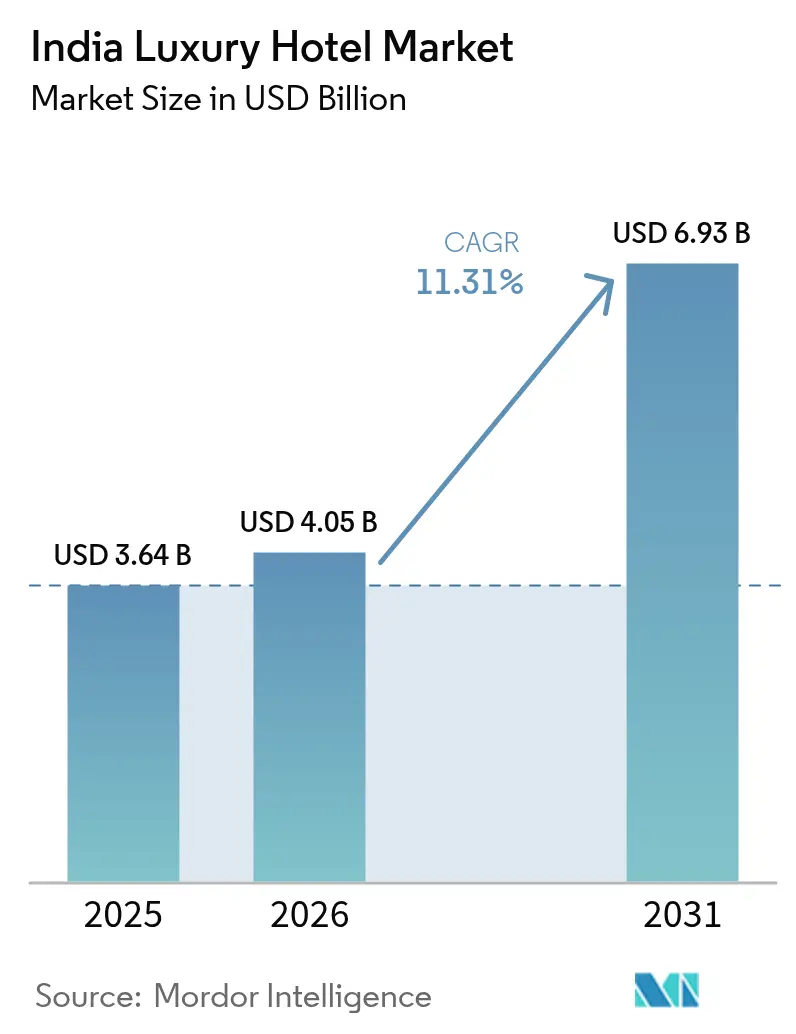
The India Luxury Hotel Market size was valued at USD 3.64 billion in 2025 and estimated to grow from USD 4.05 billion in 2026 to reach USD 6.93 billion by 2031, at a CAGR of 11.31% during the forecast period (2026-2031).
Strong domestic purchasing power, sustained infrastructure spending, and policy support, such as the Coastal Regulation Zone (CRZ-2019) liberalization, have firmly positioned the country as Asia’s fastest-growing premium hospitality destination[1]Source: Press Information Bureau, “Cabinet approves Coastal Regulation Zone (CRZ) Notification 2018,” pib.gov.in. A 50.1% rise in India’s ultra-high-net-worth (UHNW) population projected through 2028 is reshaping demand toward experiential and wellness-oriented stays, while digital adoption is compressing booking cycles and lifting direct-to-hotel margins. International brands announced six luxury signings within four days in April 2025, underscoring heightened investor confidence and sharpening competitive intensity. At the same time, the April 2025 GST restructuring lifted the dining tax on rooms above INR 7,500 to 18%, temporarily pressuring food-and-beverage spend even as hotels gained input-tax-credit eligibility.
Key Report Takeaways
- By geography, north India held a 42.60% of the India luxury hotel market share in 2025, while east & north-east India are advancing at a 14.6% CAGR through 2031.
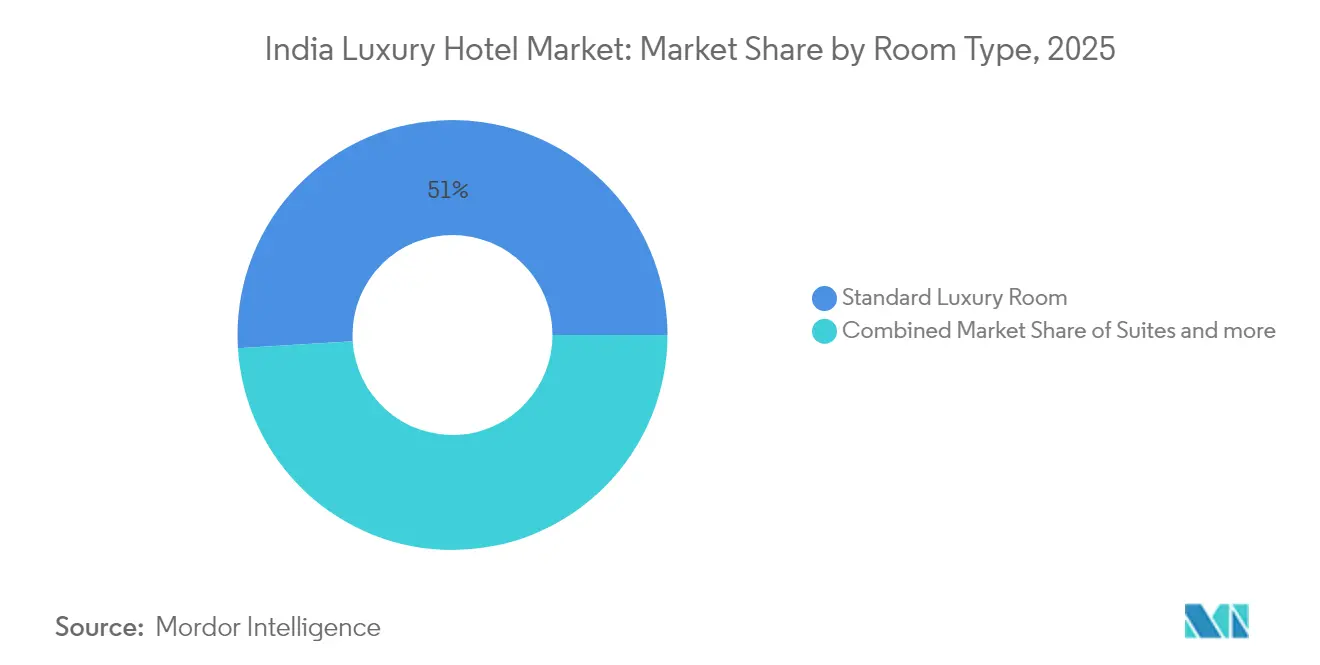
- By room type, standard luxury rooms commanded 50.98% of the India luxury hotel market share in 2025; villas/bungalows are expanding at a 12.1% CAGR to 2031.
- By booking channel, direct booking led with a 37.40% of the India luxury hotel market share in 2025 2025, whereas online travel agencies are forecast to rise at a 13.7% CAGR through 2031.
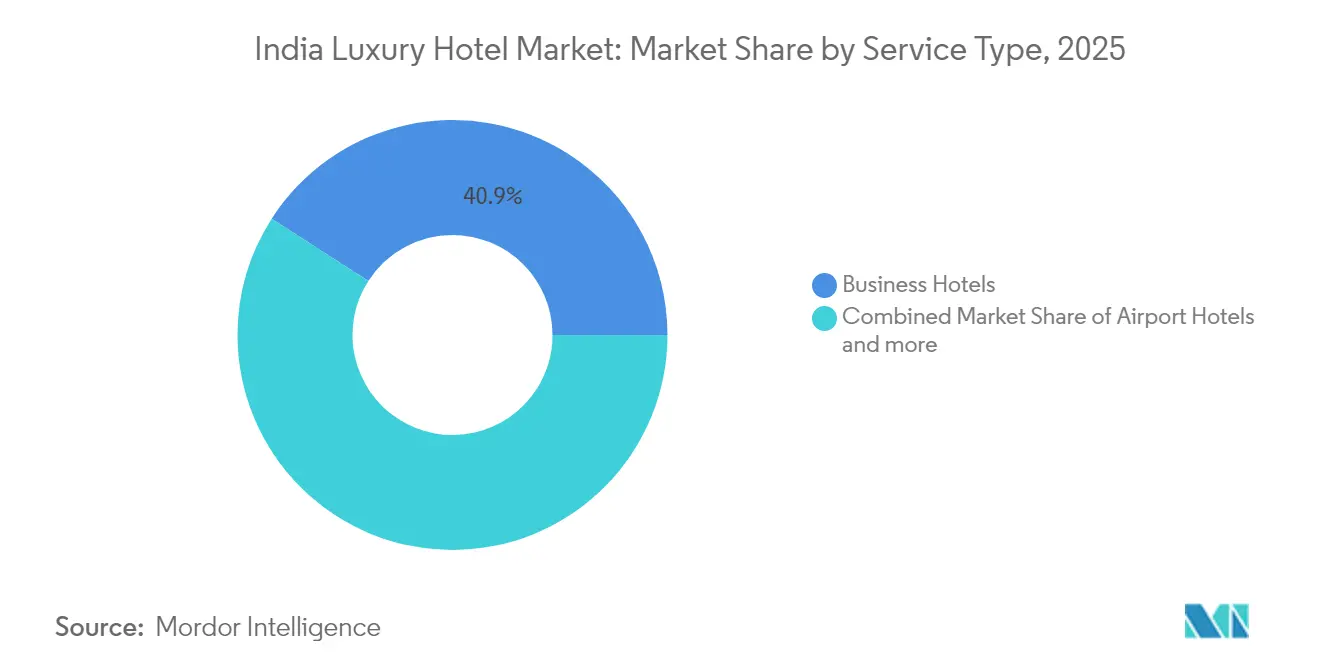
- By service type, business hotels accounted for 40.90% of the India luxury hotel market size in 2025, and resorts are set to grow at a 13.2% CAGR between 2026-2031.
Note: Market size and forecast figures in this report are generated using Mordor Intelligence’s proprietary estimation framework, updated with the latest available data and insights as of 2026.
India Luxury Hotel Market Trends and Insights
Drivers Impact Analysis*
| Driver | (~) % Impact on CAGR Forecast | Geographic Relevance | Impact Timeline |
|---|---|---|---|
| Rising disposable incomes & affluent base | +2.8% | Tier-I metros and fast-growing Tier-II cities | Long term (≥ 4 years) |
| Domestic luxury-staycation boom | +2.1% | Goa, Rajasthan, Kerala | Medium term (2-4 years) |
| International chains’ expansion inland | +1.9% | Tier-II cities such as Jaipur, Kochi, Indore | Long term (≥ 4 years) |
| CRZ-2019 beachfront unlock | +1.4% | Coastal states—Goa, Kerala, Tamil Nadu, Maharashtra | Medium term (2-4 years) |
| UHNW wedding demand surge | +1.8% | Rajasthan, Goa, Kerala, Uttarakhand | Medium term (2-4 years) |
| High-end medical-tourism recovery stays | +1.0% | Kerala, Karnataka, Tamil Nadu | Long term (≥ 4 years) |
| Source: Mordor Intelligence | |||
Rising Disposable Incomes and Affluent Domestic Traveller Base
The India luxury hotel market is underpinned by a swift rise in UHNW households, whose ranks are set to jump 50.1% by 2028. Nearly one-third of UHNW spending now flows into premium real estate and upscale experiences, prompting hotel chains to seed properties beyond metros into aspirational Tier-III towns. Credit-card outlays above INR 200,000 (USD 2,294.46) per year quadrupled in smaller cities, illustrating an untapped luxury appetite. Tata CLiQ Luxury reports that 55% of sales originate outside the eight largest metros, signaling a democratization of high-end consumption. Hyatt targets 100 domestic hotels by 2030, and Radisson plans 200 by 2027, each intentionally allocating pipelines to secondary and tertiary locations. The purchasing power that previously fueled outbound holidays—28.2 million departures in 2023, spending USD 17 billion—has begun to redirect toward local staycations. Together, these factors anchor a durable, long-range demand curve for premium hospitality products.
Domestic Luxury-Staycation Boom Post-COVID
Domestic leisure surged after pandemic-era travel restrictions, elevating nationwide occupancy to 67.5% in 2024—the highest in ten years. Average Daily Rates (ADR) for luxury hotels climbed to INR 8,055 (USD 92.38), confirming price resilience. High-net-worth households increasingly favor resort-style escapes within driving distance of major cities, a habit accelerated by health-security considerations and amplified by flexible work models. The branded rental villa sub-segment expanded from USD 329.6 million to an expected USD 1.377 billion by 2028, translating to a 33.2% CAGR, as guests opt for privacy-rich inventory such as pool villas and heritage bungalows. Jaipur, Goa, and Kochi now rank among the top leisure circuits, with over half of surveyed travelers planning another domestic vacation in the next 12 months. Contactless check-in, IoT housekeeping, and virtual concierge tools have become baseline expectations, reinforcing technology’s role in sustaining the staycation trend[2]Source: Hotelivate, “Sizing Up Indian Hospitality,” hotelivate.com.
Expansion of International Chains in Tier-I & Tier-II Cities
Branded key inventory is projected to jump from 180,000 rooms in FY 2024 to 300,000 by 2030, spearheaded by global operators scaling inland. Hilton’s Conrad Jaipur, Accor’s Sofitel Jaipur and Raffles Ranthambore, and Hyatt’s Grand Hyatt Indore typify an aggressive land-grab for first-mover advantage in high-growth provincial hubs. Tech centers such as Bengaluru catalyze this expansion, having expanded from 1,400 rooms in 2000 to 18,500 in 2023. Each new luxury key is estimated to create ten downstream jobs, magnifying socioeconomic impact. Better airlift is pivotal; India is on track to double operational airports within the decade, reducing travel times to previously inaccessible destinations. The compressed development cycle from announcement to opening averages five years for premium projects, reflecting both streamlined clearances and heightened capital efficiency. In aggregate, international participation elevates brand standards and encourages local operators to upgrade offerings.
Coastal Regulation Zone 2019 Unlock Enabling Beachfront Villas
CRZ-2019 amended setbacks and simplified environmental clearances, allowing resorts nearer to the shoreline and enabling a higher Floor Space Index in designated tourism nodes. Goa and Kerala have seen a pronounced uptick in applications for beachfront villas featuring private plunge pools and on-demand butler services. Luxury tented camps and beach clubs—once hampered by regulatory uncertainty—now benefit from a clearly defined approval pathway under CRZ-IIIA and IIIB rules. State governments deploy revenue-sharing land-lease models that lower upfront capital while ensuring public oversight. Concerns persist among fishing communities and conservation advocates, yet adaptive reuse of existing coastal structures has reduced ecological footprints. Early projects such as Accor’s Raffles Ranthambore signal the brand's appetite for combining natural assets with top-tier hospitality. Collectively, CRZ liberalization is expected to add 7,500 premium keys across coastal states by 2030[3]Source: Press Information Bureau, “Tourism Expansion in India,” pib.gov.in.
Restraints Impact Analysis*
| Restraint | (~) % Impact on CAGR Forecast | Geographic Relevance | Impact Timeline |
|---|---|---|---|
| High capex & long pay-back | -1.8% | Nationwide, acute in greenfield projects | Long term (≥ 4 years) |
| GST 18% on luxury dining | -2.2% | Hotels with room tariffs above INR 7,500 (USD 85.99) | Short term (≤ 2 years) |
| Pronounced seasonality & monsoons | -1.5% | Goa, Kerala, Himachal Pradesh | Medium term (2-4 years) |
| Rising ESG compliance costs | -0.9% | Metros & new developments pursuing international certifications | Long term (≥ 4 years) |
| Source: Mordor Intelligence | |||
High Capex & Long Pay-Back Periods
Luxury construction averages INR 236.25 lakh (USD 270,896.66) per key—more than six-times budget-hotel ratios—and timelines frequently stretch beyond 40 months. Land acquisition, multi-agency clearances, and interest during construction elevate total project cost and extend the pay-back window. Roughly 30% of announced hotels stall mid-build from funding gaps or design revisions. Sector lobby groups seek infrastructure status for projects costing over INR 10 crore (USD 1.15 million) to unlock cheaper long-tenor credit. Notwithstanding these hurdles, the listed hospitality firms’ combined market capitalization leapt from INR 20,700 crore (USD 2,373.26 million) in 2015 to INR 250,000 crore (USD 28,675.86 million) in 2025, signaling investor faith in long-term returns. IHCL alone earmarked INR 5,000 crore (USD 573.52 million) for expansion under its “Accelerate 2030” plan, illustrating the scale necessary for portfolio depth. Developers are increasingly adopting asset-light management contracts to reduce balance-sheet leverage while preserving brand reach.
GST Slab (18%) Inflates Luxury Tariffs
Effective April 2025, dining at hotels with room rates above INR 7,500 (USD 85.99) now attracts an 18% GST, replacing the earlier 5% slab. Operators welcome the concomitant input-tax-credit benefit yet fear softer restaurant footfall as total bills rise sharply. The Federation of Hotel & Restaurant Associations of India continues to lobby for a uniform 12% structure, citing competitive disadvantages versus Thailand and Singapore, where tourism taxes are lower. Hotels may freeze room-rate hikes to keep tariff-inclusive value under the GST trigger, thereby squeezing RevPAR in the short term. Some operators are unbundling meal plans from packages to preserve headline rate optics. Technology-driven dynamic pricing is also being explored to optimize occupancy without breaching GST cut-offs during peak periods. While the rule is unlikely to derail demand fundamentally, it introduces revenue-management complexity for at least the next two fiscal cycles.
*Our forecasts treat driver/restraint impacts as directional, not additive. The impact forecasts reflect baseline growth, mix effects, and variable interactions.
Segment Analysis
By Room Type: Villas Redefine Premium Personal Space
Standard Luxury Rooms led 2025 revenue with a 50.98% share, underscoring their universal appeal for corporate and leisure travelers seeking familiar luxury amenities. However, Villas/Bungalows are charting a 12.1% CAGR to 2031, signaling a pivot toward privacy, larger footprints, and bespoke services. The branded villa pipeline is expected to inject 27,000 keys into the India luxury hotel market, particularly across resort hubs in Goa and Kerala. Major chains now bundle villa stays with dedicated butlers, private plunge pools, and curated local excursions to justify nightly rates exceeding INR 50,000 (USD 573.61). Suites retained a 28.20% slice, buoyed by extended-stay executives and multi-generational families, while Penthouses & Presidential Suites, though only 5.10% of inventory, remain critical for brand positioning and high-margin ancillary spend. The India luxury hotel market size in Villas is projected to jump from USD 546.3 million to USD 857.9 million by 2029, reflecting escalating consumer willingness to pay for solitude and exclusivity.
Continued interest in home-style layouts, amplified by remote-work flexibility, underpins new product innovations such as modular villa clusters that hotels can rent as a single estate for destination weddings. Operators are also leveraging hybrid ownership models, pre-selling branded residences to finance development. Such initiatives shorten pay-back periods and create built-in demand through fractional-use owners. Sustainability certifications—using local materials and renewable power—are increasingly advertised as points of differentiation. Collectively, these factors ensure Villas/Bungalows will remain the fastest-expanding room category within the India luxury hotel market.



By Booking Channel: Digital Disruption Shifts Commission Economics
Direct Booking captured a 37.40% share in 2025 as brands reward loyalty-program members with room upgrades and flexible check-in. Yet Online Travel Agencies (OTAs) are surging at a 13.7% CAGR through 2031, propelled by comparison-site culture and personalized upsell algorithms that resonate with mobile-first consumers. OTAs already exceed 2019 transaction volumes by 52% across Asia, although commission structures of 15-25% dent hotel margins. To rebalance, groups deploy rate-parity clauses and guarantee best-price widgets on proprietary sites. Travel Agents/Tour Operators account for a 15.10% share, mostly channeling inbound groups and weddings requiring complex logistics. Corporate Contracts contribute another 14.80%, anchored in Fortune 500 headquarters across Delhi-NCR, Mumbai, and Bengaluru.
Customer-experience research shows 65% of guests prioritize seamless mobile check-in, prompting chains to integrate AI-driven chatbots that handle 70% of pre-arrival queries. Hotels also employ cloud-based revenue-management engines that recalibrate prices in real time to hedge high OTA cancellation rates. Ultimately, a balanced multichannel strategy appears optimal, ensuring brand control while tapping OTA reach. The evolution of distribution will decisively shape profitability in the India luxury hotel market over the next decade.
By Service Type: Resorts Capture Leisure Tailwinds
Business Hotels commanded 40.90% of 2025 revenue, supported by India’s expanding services economy and MICE demand centered on Delhi, Mumbai, and Bengaluru. Nevertheless, Resorts are slated to outpace all categories with a 13.2% CAGR to 2031, fueled by the wedding economy, wellness tourism, and a burgeoning bleisure culture. The India luxury hotel market size for Resorts is boosted by destination weddings valued at USD 603 million in annual hotel bookings, with palace conversions in Rajasthan and beachfront venues in Goa setting global benchmarks. Suite Hotels hold 12.10%, attracting expatriates and senior executives on long assignments. Airport Hotels, although just 8.20%, will scale as aviation capacity doubles foreign arrivals to a targeted 25 million by 2030.
Medical tourism acts as an ancillary growth engine; Kerala alone generates INR 100 crore (USD 11.47 million) monthly from high-end recovery stays that blend clinical care with spa-grade amenities. Other niche formats—eco-retreats, heritage havelis, and wellness ashrams—occupy the balance, yet punch above their weight in brand equity and occupancy yield. Over the forecast period, Resorts will remain the face of leisure-led diversification across the India luxury hotel market.
Geography Analysis
North India, accounting for 42.60% of 2025 revenue, benefits from Delhi-NCR’s diplomatic and corporate gravity, Rajasthan’s palace-driven wedding segment, and Uttarakhand’s luxury hill-station resorts. Indira Gandhi International Airport’s capacity expansion and expressway upgrades enable seamless multi-city itineraries that combine business and leisure. Luxury ADR in Delhi breached INR 11,000 (USD 126.14) during the 2023 G20 Summit, affirming pricing power in peak periods. The region’s mature infrastructure underpins an 7.7% CAGR to 2031, with growth pockets emerging in Agra, Lucknow, and Chandigarh.
South India secures a 24.10% share, anchored by Bengaluru’s IT corridor and Kerala’s wellness tourism. Bengaluru alone houses 18,500 branded rooms, the nation’s largest single city inventory. Kerala’s medical-value-travel ecosystem adds INR 100 crore (USD 11.47 million ) monthly to upscale hotel receipts, while Tamil Nadu’s temple circuits lure affluent cultural explorers. Projected growth stands at 9.6% CAGR through 2031, buoyed by coastal resort developments in the Andaman & Nicobar archipelago.
West India claims 22.70% share on the back of Mumbai’s financial-services concentration and Goa’s perennial beach appeal. Upcoming projects in Pune, Nashik, and Ahmedabad will diversify regional supply, sustaining a 8.7% CAGR. Meanwhile, East & North-East India though only 10.60% of 2025 revenue emerges as the fastest riser at a 14.6% CAGR, catalyzed by public-private flagship projects like Taj Vivanta Guwahati and DoubleTree Siliguri. Enhanced air links to Southeast Asia and government tourism incentives position the region as the next frontier in the India luxury hotel market.
Regulatory Landscape
India's luxury hotel sector operates under a multi-layered framework spanning central, state, and local approvals, with national-level facilitation led by the Ministry of Tourism (MoT). MoT runs the voluntary hotel classification and re-classification system for operational 3-star to 5-star hotels through the Hotel and Restaurant Approval and Classification Committee (HRACC), which functions as a quality signaling mechanism for upscale inventory.
Digitization and standardization have also become more prominent in compliance and recognition processes. The National Integrated Database of Hospitality Industry (NIDHI+) acts as a unified digital portal for lodging and processing hotel classification applications and tourism service provider recognition. Policy direction has additionally focused on improving the operating environment, including the simplified GST structure for hospitality that took effect on 22.09.2025, alongside central destination and infrastructure schemes such as Swadesh Darshan 2.0, PRASHAD, and Challenge Based Destination Development, which influence where and how premium hotel capacity is developed.
Value Chain Analysis
The India luxury hotel value chain spans (1) investment and land aggregation, (2) development and construction, (3) operations and asset management, and (4) distribution and guest service delivery. Upfront stages are capital intensive and permission heavy, with developers moving through sequential clearances across local bodies, state departments, and central agencies. To reduce balance-sheet load and shorten time-to-market for premium assets, owners and operators increasingly use management contracts, revenue-share leases, and selective acquisitions.
On the demand-capture side, distribution is shifting toward a mixed model of direct channels (brand websites, loyalty programs, call centers) and intermediaries (OTAs and MICE planners). Centralized revenue management, CRM, and property technology stacks influence pricing and ancillary monetization. Recent operator actions reflect an emphasis on portfolio expansion and conversion-focused growth, with IHCL communicating large, multi-year capex plans anchored by projects such as Taj Bandstand in Mumbai. Global groups such as Accor have also outlined brand introductions and additional signings, reinforcing how brand platforms, owner partners, and digital distribution shape the scaling of luxury supply across metro and emerging leisure markets.
Competitive Landscape
The Indian luxury hotel market is moderately concentrated, with the leading operators accounting for more than half of 2024 revenues, yet no single player holds more than a 25% share. Taj leads at 20%, supported by its 120-year legacy and a bold target of 700 hotels by 2030 under an INR 5,000 crore (USD 573.52 million) capex plan. Marriott follows closely at 18%, focusing on asset-light growth in Tier-II cities to limit capital exposure. ITC Hotels commands 12%, promoting its “Responsible Luxury” platform with over 60% renewable energy usage across premium properties. Oberoi and Radisson pursue divergent strategies—premium selectivity and Tier-III expansion, respectively.
Sustainability is becoming a major factor in corporate travel RFPs, with ITC setting benchmarks by recycling 100% of its wastewater and 99% of solid waste. Digital tools are also shaping competitive advantage, for instance, Taj’s advanced revenue-management systems enhance yield, while Hilton’s Connected Room allows personalized in-room experiences. Accor’s entry with its Fairmont, Raffles, and Sofitel brands in Rajasthan is intensifying brand competition. These developments are redefining guest expectations around sustainability and digital service delivery. Operators are increasingly investing to meet evolving standards and maintain relevance.
Opportunities for luxury expansion remain in East and North-East India, where branded supply is still limited. Hotel Polo Towers Group is investing INR 150 crore (USD 17.20 million) to build Nagaland’s first five-star hotels, signaling confidence in frontier markets. The competitive landscape now hinges on speed to market, ESG leadership, and technological innovation. Global and domestic brands are racing to secure first-mover advantages in emerging regions. This momentum is reshaping the structure and priorities of India’s luxury hospitality sector.
India Luxury Hotel Industry Leaders
The Indian Hotels Company Ltd (Taj)
Marriott International – India
ITC Hotels
EIH Ltd (Oberoi Group)
The Leela Palaces Hotels & Resorts
- *Disclaimer: Major Players sorted in no particular order

Market Opportunities and Future Outlook
White space for luxury supply creation is clearest where branded presence is still thin, but destination momentum and public programs are active. Government destination-development schemes (Swadesh Darshan 2.0, PRASHAD, and Challenge Based Destination Development) and the Ministry of Tourism's NIDHI+ platform support a more standardized pathway for recognition and classification. Policy reform discussions also target a key friction point for new luxury projects, with NITI Aayog's July 2026 tourism and hospitality reform recommendations centered on the 36 to 48 month setup and commissioning cycle.
Capital deployment by leading operators provides near-term evidence of expansion headroom across both gateway cities and experiential leisure circuits. In July 2026, IHCL disclosed a planned Rs 6,000 crore to Rs 7,500 crore capex program over five years and reported heavy signing momentum. ITC Hotels has pursued inorganic and asset-light growth through acquisitions and management agreements, including a Kerala backwaters resort buyout and new Welcomhotel signings. Together, these moves support opportunities around (a) accelerating conversions and brownfield upgrades into luxury positioning, (b) scaling resort, wellness, and wedding-led formats in coastal and nature destinations where regulations such as CRZ-2019 have enabled new configurations, and (c) strengthening direct and digital distribution to reduce commission drag as OTA usage expands.
Recent Industry Developments
- July 2026: Indian Hotels Company Ltd (IHCL) announced 20 hotel signings and 11 openings in Q1 FY2027, taking its portfolio to 645 hotels with over 66,000 keys. The update highlights rapid network scaling across brands, giving the company more leverage in procurement, loyalty, and distribution while expanding luxury and premium coverage beyond gateway cities.
- May 2026: ITC Hotels entered into a definitive agreement to acquire 100% of Zuri Hotels and Resorts Private Limited, owner of a luxury resort along the backwaters of Kumarakom, Kerala, for an enterprise value of Rs 205 crore. The acquisition increases ITC Hotels' control over a high-end leisure asset in a signature destination, in line with the sector's push to add premium resort capacity through faster inorganic routes.
- May 2025: ITC inaugurated ITC Royal Bengal in Kolkata after an outlay of about INR 1,400 crore, adding 456 keys and 61,000 sq ft of banqueting space. The opening strengthened luxury supply and MICE-ready inventory in East India, supporting the region's positioning for corporate events and large-format social functions.


Research Methodology Framework and Report Scope
Market Definition and Coverage
This market covers revenues earned by luxury hotels in India from selling rooms and related in-property services that are typically bundled with a luxury stay, counted for the period in which the stay is delivered.
Scope exclusions: Standalone restaurants and bars that mainly serve non-resident customers are excluded, as are pure real estate transactions such as hotel asset sales and leases.
Segmentation Overview
- By Room Type
- Standard Luxury Room
- Suites
- Villas / Bungalows
- Penthouses & Presidential Suites
- By Booking Channel
- Direct Booking (Brand Website, Call Centre)
- Online Travel Agencies (OTA)
- Travel Agents / Tour Operators
- Corporate Contracts
- By Service Type
- Business Hotels
- Airport Hotels
- Suite Hotels
- Resorts
- Other Service Types
- By Geography
- North India
- South India
- West India
- East & North-East India
Data Sources, Market Sizing, and Validation
Desk Research
Desk research was used to set the market boundaries, build the demand context, and cross-check the direction of supply growth. We reviewed public travel and tourism indicators and hotel performance signals from sources such as India Ministry of Tourism publications, Reserve Bank of India data on travel receipts, Airports Authority of India traffic statistics, and India tourism and aviation dashboards where available.
To understand room supply and pricing direction, we also referenced sources such as national statistics releases, state tourism department updates, listed company filings and investor presentations, and industry press coverage. In some cases, paid subscriptions for company financials and intelligence, news and financials, and global contracts and tenders were used to validate ownership structures, property openings, and pipeline announcements. This list is indicative only, and additional sources were used during the study for data collection, validation, and clarification.
Primary Interviews and Surveys
Primary work focused on validating what drives luxury room revenue in India, and on reducing gaps that desk sources cannot address cleanly, such as effective rate realization, channel mix, and how new luxury inventory is ramped after opening. We spoke with a mix of hotel operators, asset managers, travel intermediaries, and corporate travel buyers across major Indian regions, and then used their inputs to pressure-test assumptions like occupancy ranges, premium season uplift, and discounting practices.
Distribution of primary research fieldwork respondents
| Company type | Respondent position |
|---|---|
| Top tier: 26% | CXOs: 18% |
| Mid tier: 56% | Functional/Unit leaders: 36% |
| Smaller Players: 18% | Managers: 46% |
Market-Sizing & Forecasting
Market sizing was built using a top-down demand pool reconstruction. Room-nights were inferred from luxury room supply and utilization patterns, then translated into revenue through realized average daily rate (ADR) and length-of-stay checks. After shaping the national total, we ran selective bottom-up approximations using sampled property and operator roll-ups and channel checks, which were used to correct for overcounting and undercounting in specific regions.
Key inputs that materially move the model include luxury room inventory additions by region, occupancy progression for stabilized versus newly opened properties, ADR and RevPAR movement in business versus leisure-heavy locations, booking channel mix (direct, OTAs, agents, and corporate contracts), and seasonality tied to holiday and event calendars. For forecasting, scenario analysis was applied around room supply pipeline delivery, domestic and inbound travel momentum, and rate inflation, and then the final path was aligned to expert consensus from interviews for the most probable case. Where bottom-up visibility was thin (for example, for smaller independent luxury properties), gaps were filled using region-level utilization and rate bands, and then the implied revenue per room was rechecked against interview ranges.
Data Validation & Update Cycle
Outputs were checked in multiple ways to ensure the final value is consistent with how hotels actually earn revenue. Modeled totals were compared against independent signals such as trends in luxury room supply announcements, observable pricing direction in major cities and resort corridors, and travel demand indicators. We then reviewed variances that did not align with interview feedback.
Before sign-off, results were reviewed by another analyst to confirm arithmetic consistency, scope alignment, and year-over-year logic. Reports are refreshed annually, with interim updates when material events occur, such as policy shifts, large opening waves, or sharp demand changes. Before delivery, we run a final pass to make sure the latest public updates and primary feedback are incorporated.
Mordor Intelligence's India Luxury Hotel Market Size Measured Against Other Published Estimates
Published market sizes for India luxury hotels can vary because authors count different revenue lines, use different price realization assumptions, and do not always treat new room additions and ramp-up in the same way. Differences also show up when the base year is not aligned, or when currency conversion timing is handled inconsistently.
In our review, the biggest gap drivers were whether estimates include only room revenue or also attach broader on-property spends, whether alternative luxury stays are blended into hotel numbers, and whether ADR growth is pushed aggressively without checking occupancy limits in peak months. The table points to a tighter spread when luxury hotel revenue is tied back to room inventory, occupancy, and realized ADR by region, which is the discipline followed in the Mordor Intelligence approach.
Benchmark comparison
| Source | Market Size | Gaps in Research Methodology |
|---|---|---|
| Mordor Intelligence | USD 3.64 B (2025) | |
| Trade Journal A | USD 3.60 B (2025) | This figure is presented as a broad luxury hospitality number and appears to mix hotel and adjacent luxury lodging themes, which can compress or inflate totals depending on what is counted as a hotel stay. |
| Regional Consultancy B | USD 6.30 B (2025) | The estimate is closer to a wider premium and luxury revenue pool that likely adds non-room spends and may apply faster ADR progression without a region-wise occupancy and ramp-up check for new supply. |
Across these sources, the spread is mainly explained by scope choices around which revenue lines are included and how quickly rates are assumed to rise. When the model is anchored to rooms, utilization, and rate realization by region, the resulting market size is easier to audit and replicate year to year.


Key Questions Answered in the Report
What is the current value of the India luxury hotel market?
It reached USD 4.05 billion in 2026 and is projected to hit USD 6.93 billion by 2031.
How fast is the segment for Villas and Bungalows growing?
Villas/Bungalows are expanding at a 12.1% CAGR, outpacing all other room categories.
Which region is forecast to grow fastest in premium hospitality?
East & North-East India is set to grow at a 14.6% CAGR through 2031 on new infrastructure and flagship projects.
How does the April 2025 GST change affect luxury hotels?
Dining bills at hotels charging above INR 7,500 (USD 85.99) per night now carry an 18% GST, which may dampen restaurant spend even as hotels gain input-tax credits.
Page last updated on:




