
Market Overview
| Study Period | 2021 - 2031 |
|---|---|
| Forecast Data Period | 2026 - 2031 |
| Base Year Market Size (2025) | USD 20.11 Billion |
| Market Size (2026) | USD 21.54 Billion |
| Market Size (2031) | USD 30.39 Billion |
| Growth Rate (2026 - 2031) | 7.12 % |
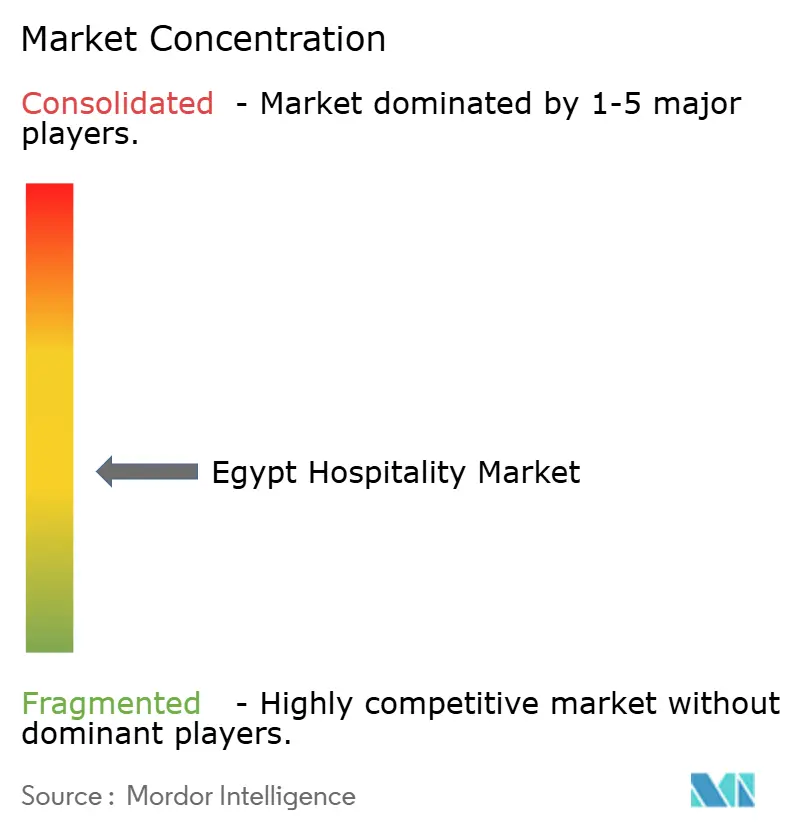
| Market Concentration | Medium |
Major Players *Disclaimer: Major Players sorted in no particular order Image © Mordor Intelligence. Reuse requires attribution under CC BY 4.0. | |
Egypt Hospitality Market Analysis by Mordor Intelligence
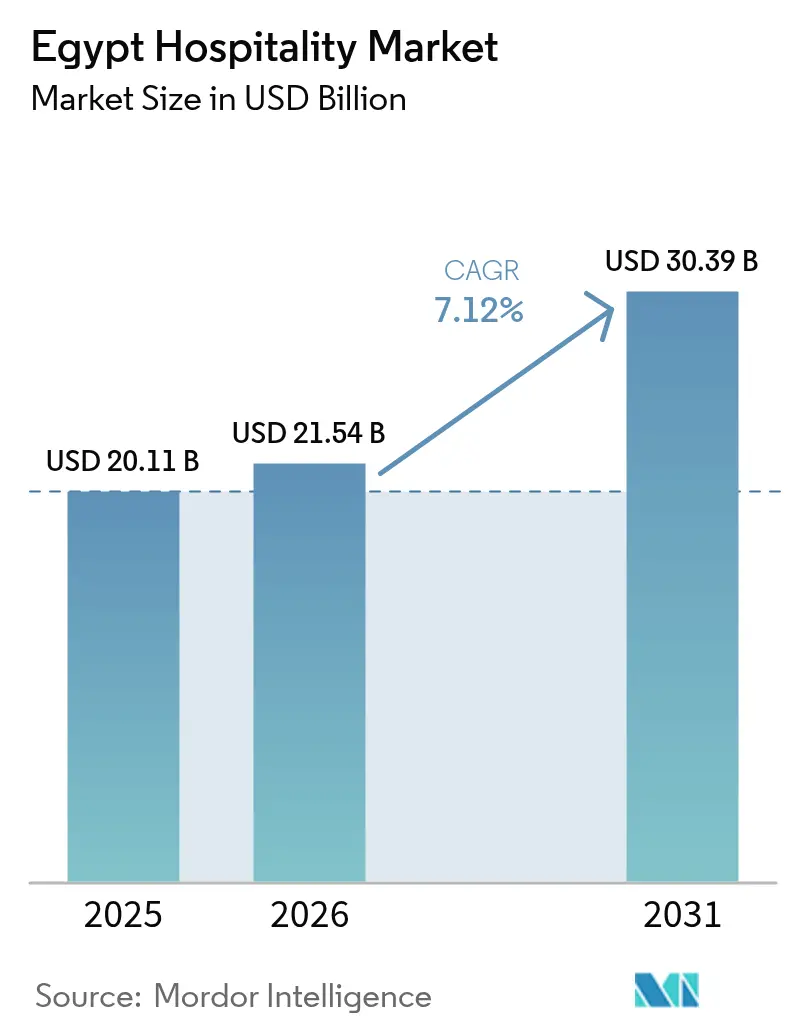
The Egypt Hospitality Market size in 2026 is estimated at USD 21.54 billion, growing from 2025 value of USD 20.11 billion with 2031 projections showing USD 30.39 billion, growing at 7.12% CAGR over 2026-2031.
The sector’s growth trajectory reflects an expanding room pipeline, strong inbound tourism recovery, and a supportive investment climate, particularly for coastal and capital-city developments. In 2024, the country welcomed 15.78 million visitors, a record that underscores resilient demand and rising average daily rates[1]BUSINESS TODAY Staff, “Egypt’s tourism revenues reach USD15.3 billion in 2024,” Business Today, businesstodayegypt.com. . Large-scale projects such as the New Administrative Capital, Ras El-Hekma, and extensive airport upgrades position the Egyptian hospitality market for continued expansion. Chain affiliations, service-apartment formats, and digitized direct-booking platforms are reshaping competitive dynamics, while inflation-linked construction costs and currency volatility temper near-term returns.
Key Report Takeaways
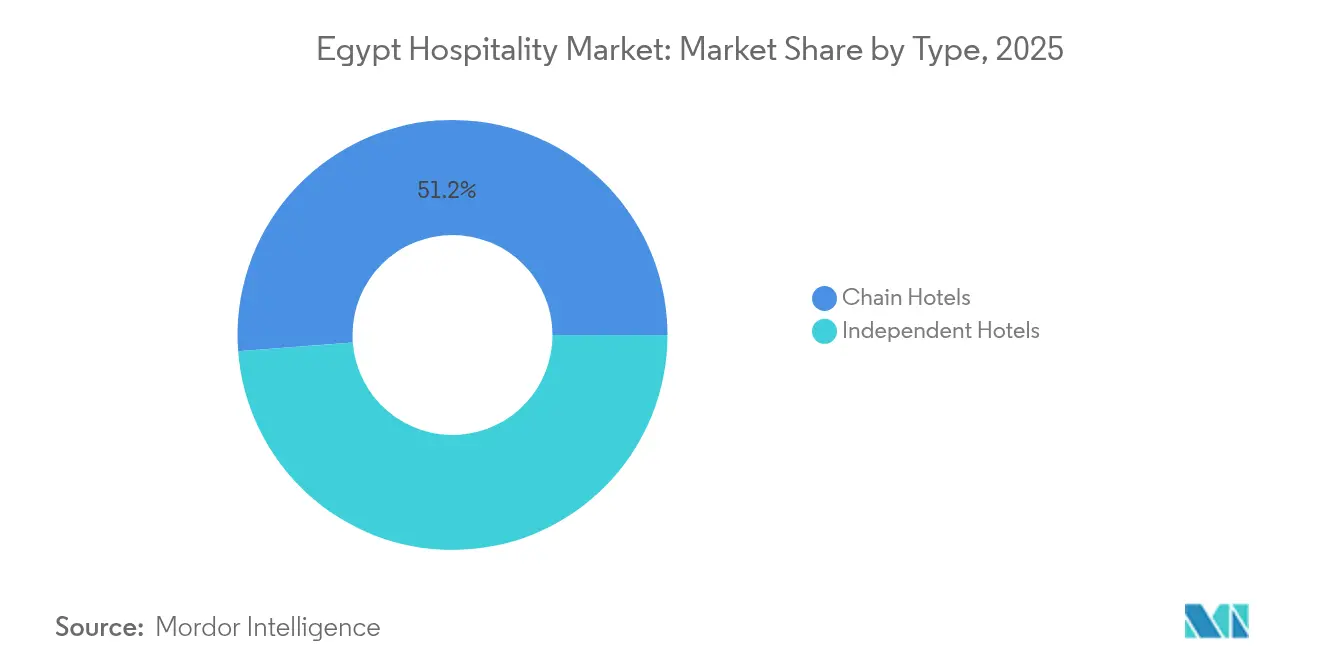
- By type, chain hotels captured 51.20% of Egypt hospitality market share in 2025; independent hotels recorded a 10.52% CAGR outlook to 2031.
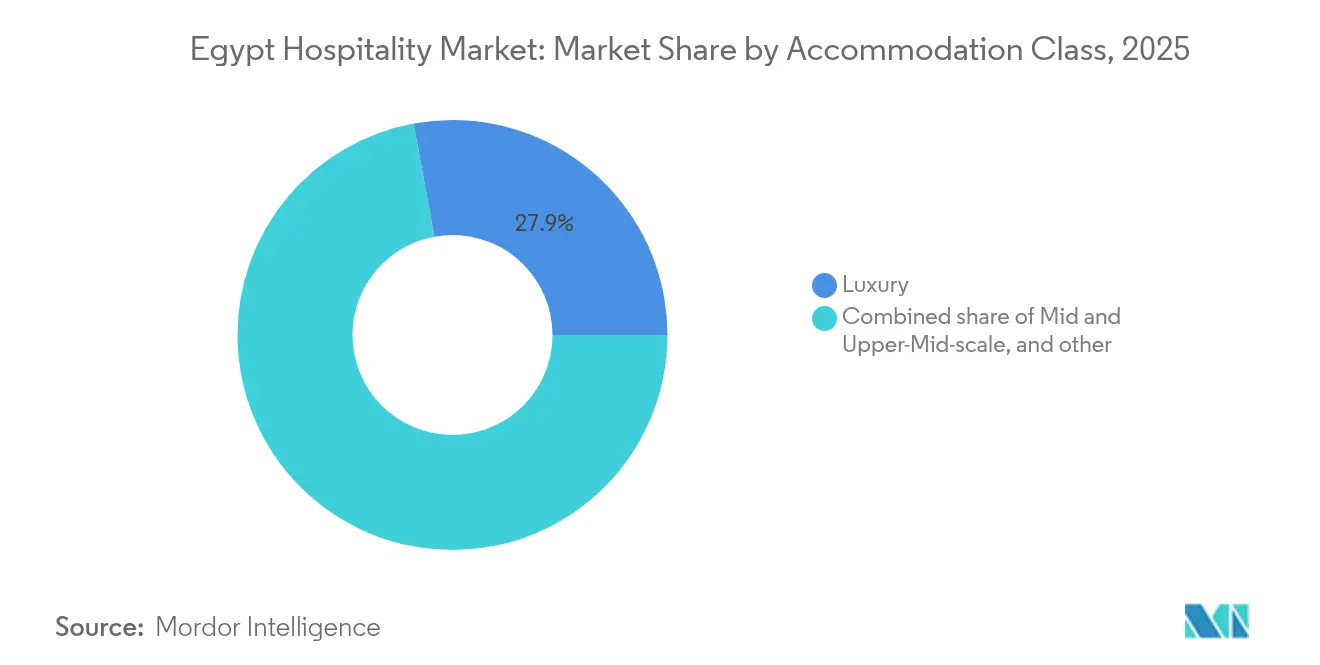
- By accommodation class, luxury accounted for 27.90% of Egypt hospitality market share, and service apartments are forecast to expand at a 13.85% CAGR through 2031.
- By booking channel, OTAs held 47.70% of Egypt hospitality market share in 2025, whereas direct digital bookings are advancing at a 14.45% CAGR to 2031.
- By geography, Greater Cairo commanded 51.60% of Egypt hospitality market share in 2025; the North Coast & Alexandria region is poised for the12.55% CAGR to 2031.
Note: Market size and forecast figures in this report are generated using Mordor Intelligence’s proprietary estimation framework, updated with the latest available data and insights as of 2026.
Egypt Hospitality Market Trends and Insights
Drivers Impact Analysis*
| Driver | (~) % Impact on CAGR Forecast | Geographic Relevance | Impact Timeline |
|---|---|---|---|
| Surge in inbound tourists post-COVID-19 recovery & promotional campaigns | +1.8% | Global, with strongest gains in Red Sea & Sinai Resorts, Upper Egypt | Medium term (2-4 years) |
| Government-led room-key expansion target of +500k keys by 2030 | +2.1% | National, with concentration in Greater Cairo, North Coast & Alexandria | Long term (≥ 4 years) |
| Expansion of low-cost carriers increasing domestic & regional arrivals | +0.9% | National, with spill-over effects to Suez Canal Cities & Delta | Short term (≤ 2 years) |
| New capital city & mega-projects driving hotel demand | +1.4% | Greater Cairo, North Coast & Alexandria | Long term (≥ 4 years) |
| Digitally enabled direct-booking incentives by leading chains | +0.6% | Global, with early adoption in Greater Cairo | Medium term (2-4 years) |
| Rise of alternative accommodations attracting longer stays | +0.5% | Greater Cairo, Red Sea & Sinai Resorts | Medium term (2-4 years) |
| Source: Mordor Intelligence | |||
Surge in Inbound Tourists
Egypt's tourism sector has demonstrated remarkable resilience, with a 25% surge in Q1 2025 arrivals following strategic promotional campaigns targeting eight European markets. The recovery extends beyond volume metrics, as Russian bookings surged 40% in 2024, indicating diversified source market strength that reduces dependency on traditional Western European visitors. Hotel occupancy rates averaged 69% in December 2024, representing a 25% increase from December 2023, with key destinations like Sharm El-Sheikh and Hurghada exceeding 75% occupancy. The anticipated opening of the Grand Egyptian Museum on July 3, 2025, positions Egypt to capture significant cultural tourism demand, with travel advisors reporting 250% increases in conversion rates from November 2024 to January 2025. This momentum supports the government's ambitious target of 30 million annual tourists by 2030, requiring sustained hospitality capacity expansion.
Government-Led Room-Key Expansion Target of +500k Keys by 2030
The Egyptian government's commitment to doubling room supply through 500,000 new keys by 2030 represents the most significant hospitality infrastructure initiative in the region, with immediate implications for foreign direct investment flows and construction activity. Egypt currently leads hotel development in Africa, accounting for 28% of the market share with 26,250 rooms across 109 hotels in the development pipeline[2]HOSPITALITYNET, “Saudi Arabia and Egypt Lead Middle East’s Hotel Pipeline Q4 2024,” hospitalitynet.org. . The government has established an Investment Opportunities Bank listing 156 tourism investment opportunities as of January 2025, complemented by the Central Bank's EGP 50 billion funding initiative specifically targeting tourism projects. This expansion strategy aligns with Egypt Vision 2030 objectives and is already materializing through major international chain commitments, including Hilton's plan to triple its portfolio with 25 new hotels and Marriott's record-breaking 291 deal signings across the EMEA region in 2024.
New Capital City & Mega-Projects Driving Hotel Demand
The New Administrative Capital, designed to accommodate 6.5 million residents and create over 2 million jobs, has catalyzed a hospitality development boom with multiple international brands securing prime locations within this USD 45 billion urban project. Marriott's St. Regis Almasa opened as the first luxury hotel in the capital, while upcoming properties include The Ritz-Carlton Cairo, Palm Hills (2027) featuring 150 guestrooms and 50 serviced apartments, and IHG's Holiday Inn Express Cairo New Capital scheduled for 2030. The Ras El-Hekma mega-project, representing Egypt's largest foreign direct investment at USD 35 billion from UAE's Modon Properties, has already doubled land prices and tripled residential unit prices along the North Coast, creating premium hospitality opportunities. Accor has secured two Swissôtel properties in Ras El-Hekma with 250 hotel keys and 100 branded residences set to open in Q3 2027, marking the brand's Mediterranean coast debut.
Expansion of Low-Cost Carriers Increasing Domestic & Regional Arrivals
The proliferation of low-cost carriers, particularly Air Arabia Egypt's expansion of short-haul routes from GCC markets, has democratized access to Egyptian destinations while reducing travel costs for price-sensitive segments. This trend is reinforced by TUI's launch of non-stop flights from the UK to Luxor, supporting their expanded Nile cruise operations with two luxury vessels, TUI Al Horeya (74 cabins) and TUI Bahareya (68 cabins). The low-cost carrier expansion particularly benefits domestic tourism, which contributed USD 6.9 billion in visitor spending in 2023, representing a 9% increase from the previous year. Regional connectivity improvements are evident in the 25% year-over-year growth in Q1 2025 tourist arrivals, with Germany, Russia, and Saudi Arabia emerging as the top three source countries. This enhanced accessibility supports the government's strategy to diversify source markets and reduce dependency on traditional European charter operations.
Restraints Impact Analysis*
| Restraint | (~) % Impact on CAGR Forecast | Geographic Relevance | Impact Timeline |
|---|---|---|---|
| Construction-material price inflation squeezing investor IRRs | -1.2% | National, with acute pressure in Greater Cairo, North Coast developments | Short term (≤ 2 years) |
| Persistent FX volatility impacting RevPAR budgeting & debt servicing | -0.8% | National, with heightened exposure for international chains | Medium term (2-4 years) |
| Government-backed tourism-infrastructure program | -0.9% | National, strongest pull in Greater Cairo and Red Sea corridors | Medium term (2–4 years) |
| Streamlined e-visa and multiple-entry visa policies expanding international arrivals | -0.7% | National, with pronounced gains for coastal resort destinations (Sharm El-Sheikh, Hurghada) | Short term (≤ 2 years) |
| Source: Mordor Intelligence | |||
Construction-Cost Inflation
Construction material costs have surged 18% year-over-year, creating significant pressure on hotel development economics and forcing investors to reassess project viability across Egypt's hospitality pipeline. Real estate developers anticipate additional price increases of 10-30% in 2025, compounding the challenge for hospitality projects that typically operate on thin construction margins. The construction industry's projected 8% CAGR growth through 2029, while positive for overall economic activity, reflects underlying inflationary pressures that disproportionately impact hospitality developments requiring extensive fit-out and specialized equipment. Egypt holds USD 515 billion in unawarded projects across the MENA region, with residential projects valued at USD 36 billion and mixed-use projects at USD 115 billion, indicating substantial competition for construction resources and materials. These cost pressures are particularly acute for luxury and resort developments along the North Coast, where international standards require premium materials and specialized contractors, potentially delaying project timelines and reducing developer returns on investment.
Persistent FX Volatility Impacting RevPAR Budgeting & Debt Servicing
Egypt's currency challenges, including a significant devaluation that contributed to 28.70% inflation rates, create complex revenue management dynamics for hospitality operators while inflating debt servicing costs for leveraged projects. The Peterson Institute for International Economics notes that Egypt narrowly avoided a full-blown economic crisis in early 2024, with ongoing governance issues and external factors continuing to create currency pressures. While this volatility artificially inflates RevPAR metrics when converted to USD with Egypt leading global RevPAR gains at 42% year-over-year it complicates long-term financial planning and investment decision-making for international operators. The IMF's third review under the Extended Fund Facility reported net international reserves at USD 38.194 billion, exceeding performance criteria, yet consumer price inflation remained at 27.51% in June 2024[3]International Monetary Fund Staff Report, “Arab Republic of Egypt: Third Review,” elibrary.imf.org..
*Our forecasts treat driver/restraint impacts as directional, not additive. The impact forecasts reflect baseline growth, mix effects, and variable interactions.
Segment Analysis
By Type: Chain Consolidation Builds Scale
Chain hotels held 51.20% of Egypt hospitality market share in 2025 and are projected to climb as signed projects come online. Pipeline visibility, brand loyalty programs, and access to global distribution systems allow chains to achieve higher average daily rates and occupancy than independents. Independent properties remain relevant in boutique and heritage niches but increasingly opt for soft-brand conversions to capture international demand flows. The Egypt hospitality market size attributable to chains will therefore widen, underscoring consolidation momentum.
Independent hotels retain roughly 49% of inventory but confront rising operating-cost pressure and digital-marketing hurdles. Domestic groups such as Jaz Hotel Group pursue multi-property clusters to gain purchasing leverage. Government incentives favor experienced operators, incentivizing independents to align with international brands or pursue asset-light management models to preserve competitiveness.



By Accommodation Class: Service-Apartment Upswing
Luxury dominates value at 27.90% share, underpinned by high-spend visitors drawn to cultural and coastal offerings. Service apartments register a 13.85% CAGR forecast, fueled by extended-stay demand associated with government ministry relocation and project-based corporate travel. Midscale captures a broad leisure and business audience, while budget assets serve price-sensitive domestic travelers.
New supply includes DoubleTree New Cairo’s 70 serviced apartments and Accor-branded Swissôtel residences in Ras El-Hekma, illustrating hybrid formats that blur traditional class lines. Airbnb data reveal rising yields in Cairo and North Coast micro-markets, validating consumer acceptance and regulatory openness that collectively expand Egypt hospitality market size.
By Booking Channel: Digital Direct Gains Momentum
OTAs controlled 47.70% of 2025 room revenue, yet direct digital sales grew fastest at 14.45% CAGR as hotels leverage AI-powered loyalty apps. Brand websites now match OTA price parity while bundling perks such as late checkout. Orascom Hotels’ migration to Oracle OPERA Cloud cut call resolution times 60% and boosted personalized upsell rates, exemplifying tech-driven disintermediation.
Corporate/MICE and wholesale channels remain critical for large group-demand segments but face margin compression as buyers seek dynamic rates. The Egypt hospitality industry navigates channel conflict by segmenting inventory and instituting geo-rate fencing, ensuring balanced distribution economics.
Geography Analysis
Greater Cairo commands 51.60% of national value thanks to its status as the political, cultural, and commercial hub. The July 2025 Museum launch expanded metro lines, and the New Administrative Capital together bolster year-round occupancy. Flagship openings such as the 615-room Sofitel Cairo Downtown Nile and Signia by Hilton Cairo Skywalk reinforce upscale supply depth and strengthen the Egypt hospitality market’s urban core. Red Sea & Sinai Resorts hold a significant share, anchored by all-inclusive beach resorts and enviable diving credentials. RevPAR surged over 40% in early 2025 as source-market diversification reduced seasonality risk. Sustainability requirements have prompted operators to integrate desalination and waste-management systems, which elevate operating costs but enhance brand equity in environmentally sensitive zones.
North Coast & Alexandria deliver the fastest CAGR of 12.55% on the back of Ras El-Hekma’s record land-deal momentum. Rotana Palma Bay and U Hotels Masaya illustrate first-wave resort entries, while branded residences drive mixed-use absorption. Upper Egypt continues to benefit from Nile-cruise demand, with new UK-Luxor airlift supporting occupancy resilience. Suez Canal Cities & Delta targeting logistics-linked corporate travel offer mid-scale expansion avenues and help balance national seasonality, rounding out the Egypt hospitality market’s geographic diversification.
Regulatory Landscape
Egypts hotel and tourist establishment licensing and operating framework is anchored by Law No. 8 of 2022 and its executive regulations under Prime Minister Decree No. 705 of 2023, which formalize permitting, inspections, and the use of accreditation offices in the compliance process. For financing-linked compliance and capex enablement, the Central Bank of Egypt updated its tourism sector support initiative in May 2026, increasing financing limits up to EGP 4 billion per client subject to joint approval from the Minister of Finance and the Minister of Tourism and Antiquities.
Regulation also expanded to alternative accommodations, as the Ministry of Tourism and Antiquities issued Decrees No. 209/2025 and No. 801/2025 to establish a structured regime for holiday home rentals (short-term rentals), including licensing and hotel-grade criteria for eligible units and buildings. This shift brings informal inventory into the formal oversight perimeter and increases the compliance burden (documentation, standards adherence, and renewal discipline) for operators and multi-unit owners active in high-demand leisure corridors such as the North Coast and Red Sea destinations.
Value Chain Analysis
Egypts hospitality value chain starts with land origination and entitlements, often routed through tourism authorities and investment facilitation mechanisms such as the one-stop-shop approach highlighted for room expansion programs. It then moves to development and fit-out, where construction-cost inflation and FX volatility influence procurement, contracting, and project phasing. Financing and refinancing remain central linkages across the chain, supported by the EGP 50 billion tourism financing initiative used for construction and renovation, while large-scale destination infrastructure such as airports and utilities stays a key upstream enabler for coastal resorts and new cities.
Downstream, hotel operators and asset managers depend on distribution through OTAs, wholesalers, and increasingly direct digital channels, with property-management and revenue systems shaping conversion and upsell performance. The chain has also widened to include mixed-use and branded-residence models, and since 2025, a more formal holiday-homes layer under MoTA licensing has enabled conversion of underutilized housing units into managed, hotel-standard assets. Recent plans such as The First Group and Pulse Developments for over 3,200 hotel units in Sharm El Sheikh and Gulf Egypt for Hotels and Tourisms EGP 20 billion mixed-use project show developers, operators, and capital partners structuring projects as integrated destination assets rather than standalone hotels.
Competitive Landscape
Egypt’s hospitality market is moderately fragmented, with the leading operators holding a significant share of active hotel keys. Despite this, the market remains open to challenger brands and adaptive reuse strategies, particularly through conversions of existing properties. Global hotel groups are actively expanding: one major operator is leveraging a broad brand portfolio to address gaps in luxury, lifestyle, and extended-stay offerings, having signed nearly 300 regional deals in 2024. Another international chain is targeting first-mover status in emerging cities with 25 planned openings that include dual-brand and residential formats. Others are focusing on untapped coastal regions and heritage landmarks, using premium brands to establish market presence.
To navigate regulatory and development risks, international entrants increasingly form joint ventures with local Egyptian developers. Leading domestic groups maintain competitiveness through strategies such as property clustering and regular refurbishments to enhance guest appeal. The rise of alternative accommodation platforms, especially in premium coastal areas, is accelerating at over 20% annually, pushing traditional hotel brands to explore branded residence and hybrid lodging models. Technological innovation is also reshaping operations, with cloud-based property management systems, contactless services, and analytics tools becoming key differentiators. One prominent developer achieved a 30% reduction in back-office workload after digitizing core hotel functions.
Investor confidence in the sector remains strong, supported by strategic moves from institutional players acquiring stakes in hospitality platforms focused on heritage assets. Public-private partnerships and green financing mechanisms are increasingly used to fund energy-efficient renovations and new developments. These initiatives align with Egypt Vision 2030 sustainability goals and enhance long-term asset value and competitiveness. As environmental standards rise, properties that meet green benchmarks are positioned to attract premium guests and institutional capital. Overall, Egypt’s hospitality landscape is evolving into a more diversified and tech-enabled ecosystem driven by both global and local innovation.
Egypt Hospitality Industry Leaders
Marriott International
Hilton Worldwide
Accor
IHG
Radisson Hotel Group
- *Disclaimer: Major Players sorted in no particular order

Market Opportunities and Future Outlook
A visible opportunity is faster capacity build-out through conversion and formalization, not only via new-build hotels but also by bringing existing units into compliant, professionally managed supply. MoTA Decrees No. 209/2025 and No. 801/2025 created a licensing pathway for holiday homes, enabling institutional operators to scale short-stay inventory with clearer standards. In parallel, the governments room expansion agenda, including targets cited around 300,000 rooms and broader national capacity ambitions toward 2030, keeps investor focus on fast-to-market accommodation formats such as serviced apartments and managed multi-unit buildings.
Destination-led mixed-use projects are expanding the investable universe across coastal and new-city nodes, creating room for marinas, retail-linked hospitality, and branded residences that can lengthen stays and diversify revenue. July 2026 announcements provide concrete proof points: Tatweer Misr unveiled the SALT Marina development in the North Coast with EGP 28 billion in planned investments, and The First Group with Pulse Developments announced a USD 670 million plan for over 3,200 hotel units in Sharm El Sheikh across Nabq, Naama Bay, and El Montazah. On the operating side, the Central Bank of Egypts May 2026 amendments to its tourism support initiative (up to EGP 4 billion per client) and the Ministry of Finance and MoTA extension of the EGP 50 billion hotel financing initiative application deadline to 20 April 2026 strengthen the toolkit for renovation, expansion, and quality upgrades, while digital capability building is reinforced by MCITs April 2026 AI roadmap for tourism, including readiness assessment and sandbox mechanisms for travel-tech adoption.
Recent Industry Developments
- June 2026: Accor signed an agreement with Margins Developments to develop Novotel and Novotel Residences New Cairo Lusail. The deal expands Accors pipeline in an emerging urban growth corridor and underscores the markets pivot toward mixed-use hospitality formats that pair hotel keys with longer-stay residential inventory.
- May 2026: Marriott International partnered with TLD to introduce a Tribute Portfolio hotel (123 rooms) and 250 serviced residences within the Westrict development in Sheikh Zayed. The announcement adds branded lifestyle supply in Greater Cairo and reinforces the strategy of bundling hotels with serviced residences to capture both leisure and extended-stay demand.
- July 2025: AHS MEA (Absolute Hotel Services Middle East and Africa) signed a management agreement with EGYGAB Developments for the U Hotel Masaya North Coast, comprising 108 hotel keys and 82 branded residences. The signing signals continued brand entry and managed-supply growth in the North Coast, a region benefiting from large-scale destination investment and a widening premium-leisure catchment.


Research Methodology Framework and Report Scope
Market Definition and Coverage
For this study, the Egypt hospitality market is treated as the value of services sold in the country for visitor stays and on premises consumption, covering accommodation-led and related hospitality spending measured in USD.
Scope exclusions: Airlines, stand-alone passenger transport, and non-hospitality retail spending are excluded unless they are bundled as part of hospitality service delivery.
Segmentation Overview
- By Type
- Chain Hotels
- Independent Hotels
- By Accommodation Class
- Luxury
- Mid and Upper-Mid-scale
- Budget and Economy
- Service Apartments
- By Booking Channel
- Direct Digital
- OTAs
- Corporate / MICE
- Wholesale and Traditional Agents
- By Geographic Region
- Greater Cairo
- Red Sea and Sinai Resorts
- Upper Egypt (Luxor and Aswan)
- North Coast and Alexandria
- Suez Canal Cities and Delta
Data Sources, Market Sizing, and Validation
Desk Research
Desk work started with public indicators that describe travel demand and lodging supply, which are the two anchors for a hospitality model. We referenced sources such as Egypt tourism and visitor arrival releases, CAPMAS statistics, UN Tourism country data, World Bank macro series, and IMF outlook tables to keep the macro and travel cycle consistent.
To shape the industry layer, we also used company annual reports, investor presentations, and press releases for pipeline announcements and operating updates. We then used trade association websites and reputed business press to map project timelines and capacity additions. In a few places, paid subscriptions supporting company financials and intelligence, news and financials, and patent databases were used to cross-check ownership structures and strategic moves that affect capacity. These desk sources are not exhaustive, and we also relied on other public references to collect, validate, and clarify inputs.
Primary Interviews and Surveys
Primary discussions were used to sanity-check what the desk indicators imply on the ground, especially on occupancy behavior, rate resets, and the mix between chain and independent properties. We spoke with a spread of hotel operators, asset managers, travel intermediaries, and professionals linked to corporate travel and events. We then cross-checked differences by major demand pockets inside Egypt so the assumptions were not driven by a single city or season.
Distribution of primary research fieldwork respondents
| Company type | Respondent position |
|---|---|
| Top tier: 26% | CXOs: 13% |
| Mid tier: 60% | Functional/Unit leaders: 41% |
| Smaller Players: 14% | Managers: 46% |
Market-Sizing & Forecasting
The sizing starts with a top-down build where travel demand and room supply indicators are used to reconstruct revenue pools for accommodation and related on-property services, and then mapped into a single USD market value. To keep the output grounded, we corroborated totals with selective bottom-up approximations, such as sampled average daily rate and occupancy checks by major hubs, plus channel checks on typical seasonality patterns.
Key inputs that fed the model included international and domestic visitor trends, hotel room inventory additions and renovations, occupancy and ADR direction, length of stay patterns, and the weight of corporate and MICE activity in peak and shoulder periods. Because the North Coast and Alexandria can behave very differently from Greater Cairo and resort corridors, we adjusted assumptions by geography before rolling them up.
For forecasting, scenario analysis was used around demand recovery pace, new room openings, and pricing power in USD terms, and the path was then aligned to what industry experts view as realistic for rate and occupancy normalization. When direct data points were missing for a sub-region or property class, we applied a proxy from the closest comparable cluster and re-tested it during validation so gaps did not overstate growth.
Data Validation & Update Cycle
Outputs are checked against independent signals such as tourism arrivals, lodging capacity additions, and macro spending direction, and then differences are investigated until the drivers are clear. If a variance looks too large, we revisit the rate, occupancy, and mix assumptions and, where needed, re-contact contributors to confirm what changed.
Before sign-off, the model goes through multi-step analyst reviews, and unusual jumps are stress-tested with alternate assumptions. The report is refreshed annually, and interim updates are triggered when major events occur, such as policy changes, step-ups in project commissioning, or abrupt shifts in travel flows. Right before delivery, a final pass is completed so clients receive the latest view consistent with the update cycle.
Mordor Intelligence's Egypt Hospitality Market Size Measured Against Other Published Estimates
Published values for Egypt hospitality can look far apart, and this is usually not because someone is wrong, but because the counted activities and the timing differ. Differences show up when one source mixes tourism, lodging, and food service into a combined total, or when another source uses a narrower accommodation-only view.
The other common drivers are the base year chosen, whether values are kept in nominal USD or adjusted differently for currency timing, and how room rate progression is handled through the forecast window. If occupancy is assumed to rise quickly, or if new room openings are counted earlier than they actually commission, the market number can move up without showing the underlying logic clearly.
Benchmark comparison
| Source | Market Size | Gaps in Research Methodology |
|---|---|---|
| Mordor Intelligence | USD 20.11 B (2025) | |
| Industry Consultancy A | USD 9.37 B (2024) | The scope bundles hospitality with food service and related activities, and it is anchored to 2024, which can compress the value versus an accommodation-led build and a different base year. |
| Trade Journal B | USD 20.00 B (2025) | The figure is presented as an overall market mention with limited clarity on included revenue streams, currency timing, and how room openings and rate changes are validated across regions. |
The table shows a wide spread between a mixed hospitality and food service view and a higher total tied to accommodation economics. Mordor Intelligence's model sizes the hospitality market around lodging and related on-property revenue signals, then checks those totals against demand indicators like arrivals and supply additions so the value remains traceable to clear drivers.


Key Questions Answered in the Report
What is the forecast value of the Egypt hospitality market by 2031?
The sector is projected to reach USD 30.39 billion by 2031.
How fast is the Egypt hospitality market expected to grow?
Service apartments lead with a 13.85% CAGR forecast through 2031.
Which region is expected to grow fastest within Egypt?
The North Coast & Alexandria region is projected to post a 12.55% CAGR to 2031.
How concentrated is competition among hotel operators?
The top five brands control 35.80% of national room supply, reflecting moderate concentration.
What are key risks facing investors?
Construction-material inflation and foreign-exchange volatility are the primary near-term restraints.
Page last updated on:


 Your data is secure and never sold or shared.


