Higher Education M-learning Market Size and Share
Market Overview
| Study Period | 2019 - 2030 |
|---|---|
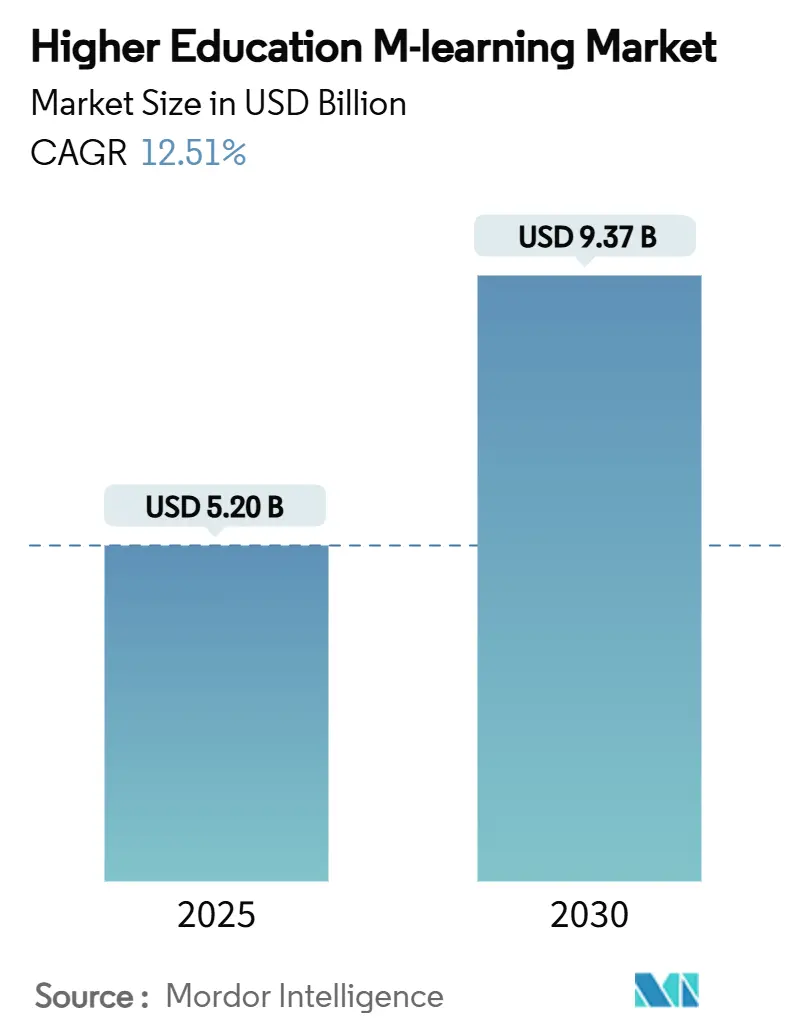
| Market Size (2025) | USD 5.20 Billion |
| Market Size (2030) | USD 9.37 Billion |
| Growth Rate (2025 - 2030) | 12.51% CAGR |
| Fastest Growing Market | Asia Pacific |
| Largest Market | North America |
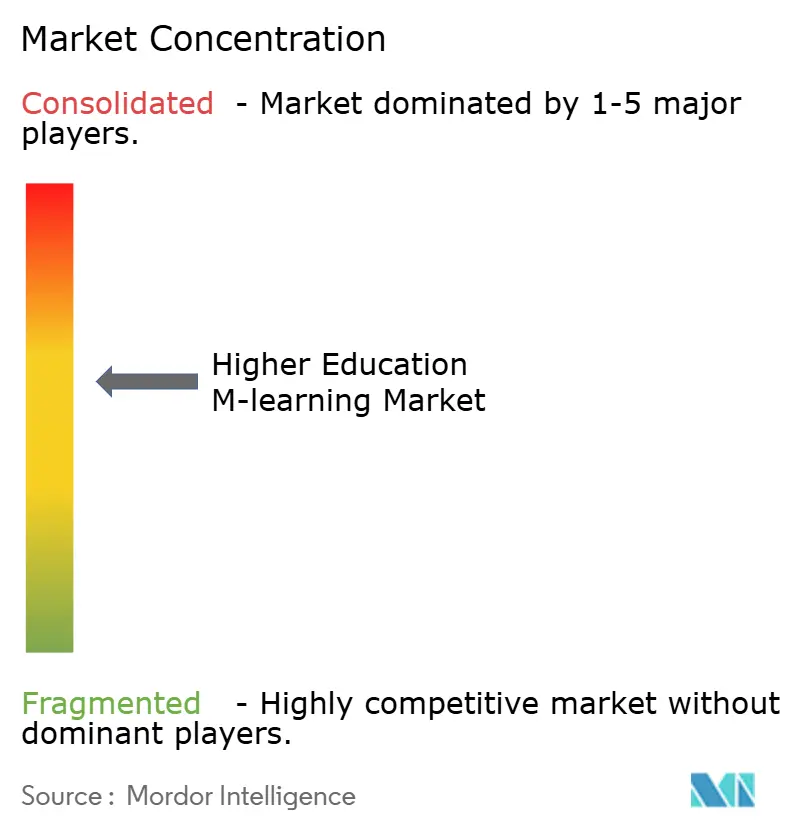
| Market Concentration | Medium |
Major Players *Disclaimer: Major Players sorted in no particular order Image © Mordor Intelligence. Reuse requires attribution under CC BY 4.0. | |
Higher Education M-learning Market Analysis by Mordor Intelligence
Market Analysis
The Higher Education M-learning market size stands at USD 5.2 billion in 2025 and is forecast to reach USD 9.37 billion by 2030, expanding at a 12.51% CAGR. Widespread smartphone ownership, improved campus bandwidth, and post-pandemic shifts toward hybrid degree models are galvanizing institutional demand for mobile-first course delivery. Universities now treat mobile learning as a strategic capability that widens access for working adults, international candidates, and rural learners while lowering on-site infrastructure costs. Platform vendors are responding with AI-enabled authoring, offline access, and micro-credential scaffolds that personalise content at scale. Meanwhile, venture and public funding continue to flow into EdTech, signalling confidence that Higher Education M-learning market adoption will remain resilient even amid cyclical budget pressure.
Key Report Takeaways
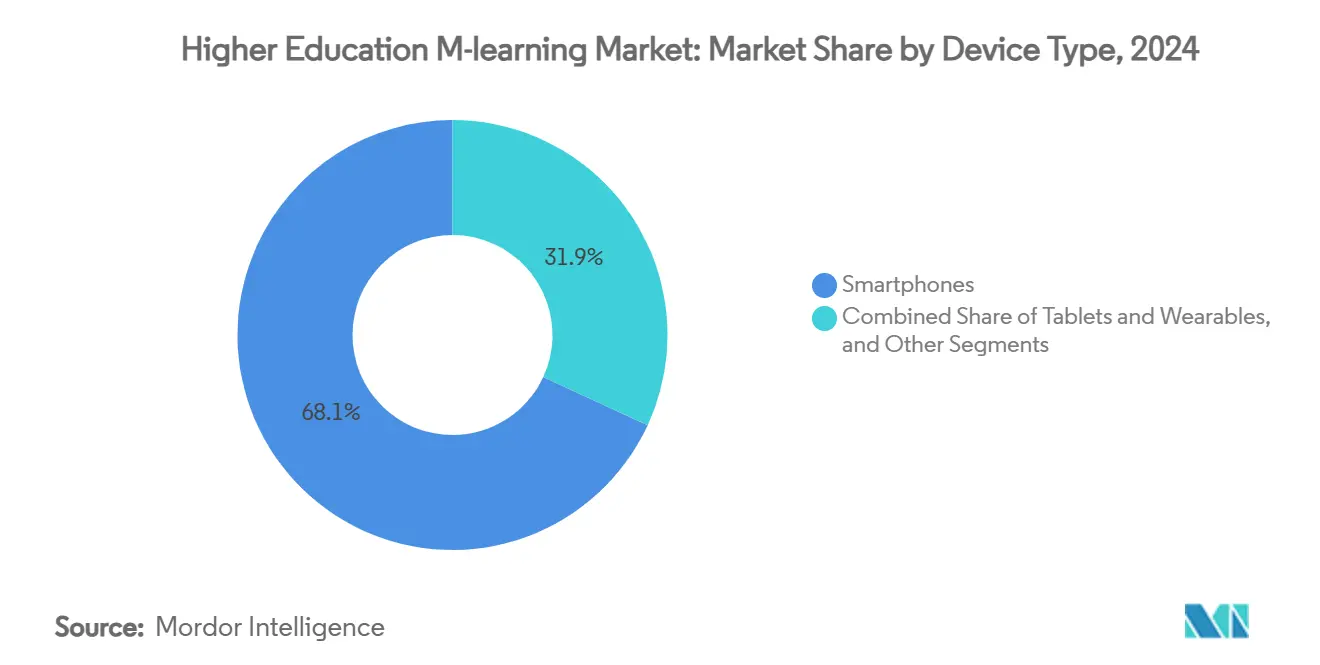
- By device type, smartphones led with 68.12% of the higher education M-learning market share in 2024, while the same segment is advancing at a 13.62% CAGR through 2030.
- By learning mode, asynchronous self-paced formats accounted for 73.51% share of the higher education M-learning market size in 2024, and synchronous virtual classrooms are projected to grow at 14.52% CAGR to 2030.
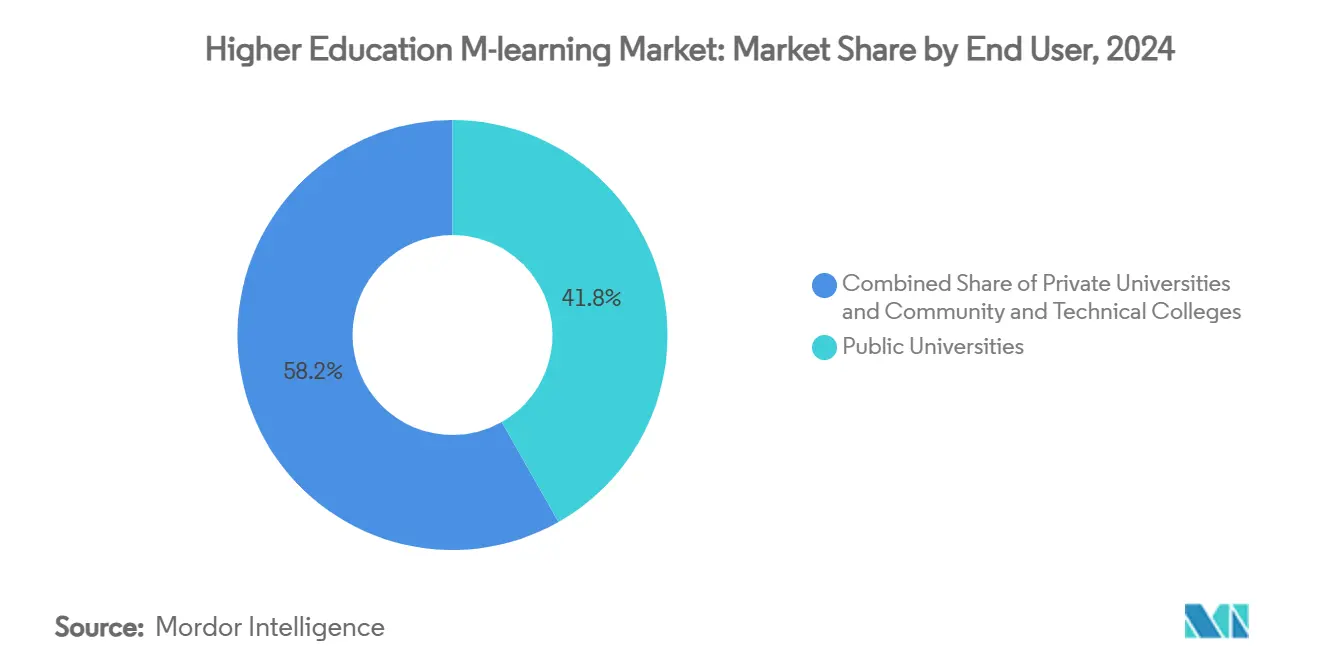
- By end user, public universities held 41.82% revenue share in 2024; private institutions are pacing the field at a 14.20% CAGR through 2030.
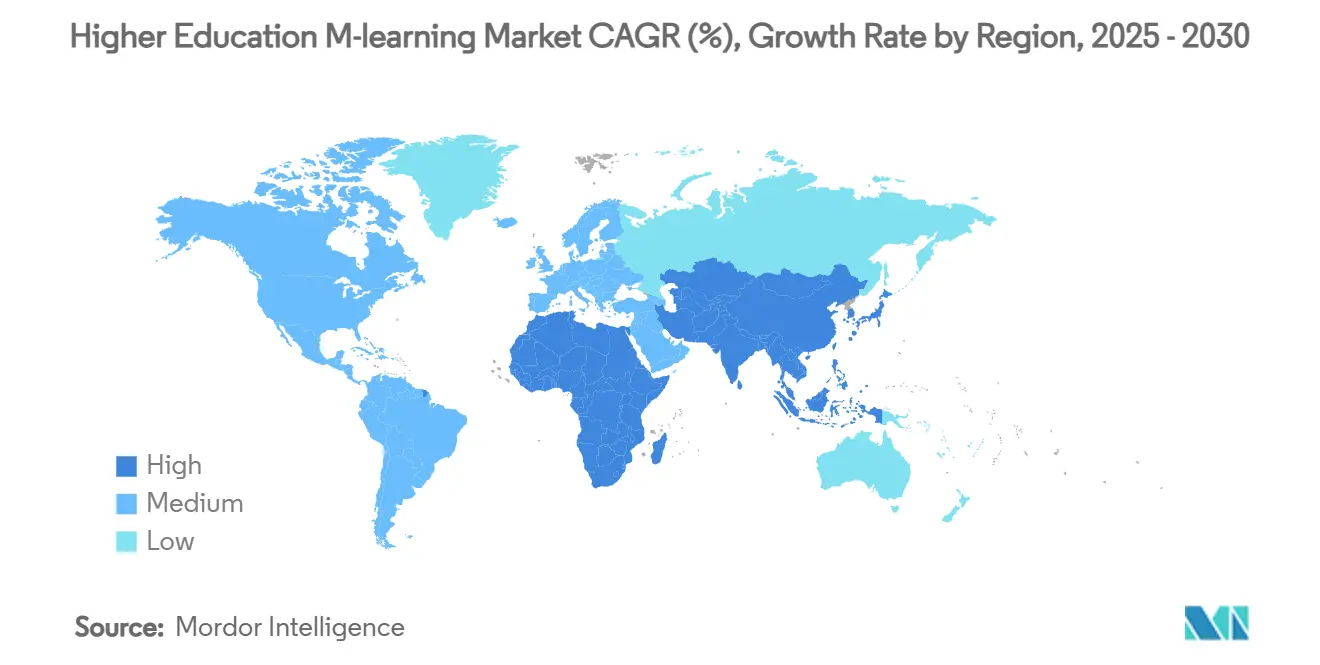
- By geography, North America commanded 38.61% of the higher education M-learning market in 2024, while Asia-Pacific is forecast to register the fastest 15.10% CAGR to 2030.
Global Higher Education M-learning Market Trends and Insights
Drivers Impact Analysis*
| Driver | (~) % Impact on CAGR Forecast | Geographic Relevance | Impact Timeline |
|---|---|---|---|
| Rising BYOD & smartphone penetration | +2.10% | Global, strongest in Asia-Pacific and emerging markets | Short term (≤ 2 years) |
| Demand for flexible, hybrid degree models | +2.80% | North America & Europe primary, expanding to Asia-Pacific | Medium term (2-4 years) |
| Government digital-campus funding waves | +1.90% | Asia-Pacific core, spill-over to Latin America and MEA | Medium term (2-4 years) |
| Employability-linked micro-credential boom | +2.30% | Global, early adoption in North America and Europe | Long term (≥ 4 years) |
| 5G-enabled AR/VR mobile content on campuses | +1.40% | North America & EU, pilot programs in Asia-Pacific | Long term (≥ 4 years) |
| Textbook-app bundling by publishers | +1.20% | Global, concentrated in English-speaking markets | Short term (≤ 2 years) |
| Source: Mordor Intelligence | |||
Rising BYOD & Smartphone Penetration
Student ownership of mobile devices is now near-universal, and campus bring-your-own-device policies transform that ubiquity into always-on learning capacity. Ninety-eight percent of undergraduates reported laptop use for coursework in 2024, yet 48% already prefer smartphones for rapid LMS check-ins. The University of Kentucky’s Smart Campus project illustrates tangible outcomes: iPad provisioning coincided with a 70% graduation rate and 60% lower IT spend. Device manufacturers are hard-wiring educational utilities such as automated note transcription and equation solving directly into operating systems, further anchoring smartphones as primary study tools. As Generation Alpha matriculates, nearly one-third will rely on handsets as their sole connected device, giving the Higher Education M-learning market an enlarging base of digitally fluent learners. Institutions unable to optimise for hand-held experiences risk disengagement and lower course-completion metrics, reinforcing the driver’s strong near-term influence.
Demand for Flexible, Hybrid Degree Models
COVID-19 normalised remote coursework, and alumni surveys show those expectations persist. The 2024 EDUCAUSE Trend Watch lists hybrid learning enhancement as a top institutional priority [1]EDUCAUSE, “2024 Higher Education Trend Watch,” educause.edu. Models such as Our Lady of Fatima University’s HyFlex programme deliver concurrent face-to-face, synchronous online, and asynchronous mobile options, achieving 30% gains in learning outcomes and a 25% uptick in student satisfaction. Working adults and international enrollees value the ability to toggle between formats each week without academic penalty, a capability best handled by mobile-optimised platforms. Competency-based curricula also require granular assessment feeds that learners can review on the go. As a result, the Higher Education M-learning market is tightly coupled to universities’ broader strategy of diversifying study pathways and expanding lifetime alumni engagement.
Government Digital-Campus Funding Waves
Public-sector stimulus has become a powerful accelerator, particularly across Asia-Pacific. Singapore’s EdTech Masterplan 2030 earmarks multi-year grants for mobile content pilots and teacher upskilling [2]Ministry of Education Singapore, “EdTech Masterplan 2030,” moe.gov.sg. South Korea allocated USD 70 million to embed AI-ready digital textbooks across 6,000 schools, building learner familiarity before tertiary entry. The Philippines is channelling satellite bandwidth and device vouchers to underserved provinces, smoothing future enrolment funnels for mobile-first universities. These state programs often stipulate open-architecture standards, benefitting vendors able to integrate with national identity, payment, and analytics systems. Funding rounds also drive procurement cycles that reset every three to five years, sustaining the Higher Education M-learning market contract flow through the medium term.
Employability-Linked Micro-Credential Boom
Surveys show 90% of employers now recognise micro-credentials when screening applicants, and a similar share of students believe these assets enhance job prospects. Over half of universities already grant academic credit for short-form certificates, with 82% planning expansions within five years. Mobile apps excel at delivering modular lessons during commutes or shift breaks, aligning perfectly with micro-learning pedagogy. Coursera added 450 generative-AI micro-courses in 2025 and surpassed 162 million registered learners, many interacting chiefly via phones. Stackable credential pathways foster continuous platform re-engagement, lengthening customer lifetime value across the Higher Education M-learning market. Because labor-market volatility heightens demand for rapid upskilling, this driver exerts a long-term uplift on adoption.
Restraints Impact Analysis*
| Restraint | (~) % Impact on CAGR Forecast | Geographic Relevance | Impact Timeline |
|---|---|---|---|
| Digital divide & patchy campus Wi-Fi | -1.80% | Global, most severe in rural areas and developing economies | Short term (≤ 2 years) |
| Faculty change-management resistance | -1.30% | Global, particularly acute in traditional institutions | Medium term (2-4 years) |
| Data-privacy litigation on learner analytics | -0.90% | North America & EU primary, expanding globally | Long term (≥ 4 years) |
| App-store policy shifts raising CAC | -0.70% | Global, concentrated in iOS and Google Play ecosystems | Short term (≤ 2 years) |
| Source: Mordor Intelligence | |||
Digital Divide & Patchy Campus Wi-Fi
Many institutions still grapple with inadequate bandwidth, particularly satellite campuses and rural teaching hospitals. Kent State University secured USDA grants topping USD 585,000 to extend reliable links for remote nursing students [3]GovTech, “Kent State Wins Grants for Distance Learning in Rural Areas,” govtech.com. Minority-serving colleges collectively received more than USD 10 million in federal connectivity awards during 2024, underlining the scale of the shortfall. Cardiff University resorted to portable routers to support medical field placements in rural Wales. Device affordability compounds the issue; one-third of upcoming undergraduates lack laptops, making smartphones their lone gateway to course content. Until low-cost 5G or campus-wide mesh networks close such gaps, the Higher Education M-learning market will expand unevenly, dampening the near-term CAGR.
Faculty Change-Management Resistance
Lecturers voice concerns about academic integrity, screen fatigue, and the time cost of redesigning syllabi for small-screen consumption. The 2024 EDUCAUSE AI Landscape Study found 78% of leaders worried about integrity risks tied to generative AI. Workshops at East Los Angeles College illustrate the pushback, with instructors cautioning against over-automation that could erode critical-thinking skills[4]East Los Angeles College, “Navigating Faculty Resistance to AI in Education,” elac.edu. Surveys link technology anxiety and uncertainty avoidance to slower LMS uptake, indicating that professional-development budgets must rise in tandem with software spend. Where unions negotiate workload protections, deployment timelines lengthen further. These hurdles may not derail the Higher Education M-learning market, but they can delay the achievement of full utilisation rates at large public systems.
*Our forecasts treat driver/restraint impacts as directional, not additive. The impact forecasts reflect baseline growth, mix effects, and variable interactions.
Segment Analysis
By Device Type: Smartphones Drive Mobile Learning Evolution
Smartphones captured 68.12% of the Higher Education M-learning market share in 2024, and the segment is projected to post a 13.62% CAGR through 2030. Continuous chipset advances allow complex simulations and augmented-reality labs that previously required desktops. Handset OEMs are bundling stylus input, multi-app split screens, and low-latency wireless casting, features that brighten prospects for science and engineering majors who once favoured larger screens. Tablets remain relevant for extended reading and graphic design studios; the University of Kentucky still reports 90% first-year tablet retention. Wearables occupy a nascent niche: nursing students at several U.S. colleges trial smartwatches for real-time vital-sign logging during clinical rounds, signalling a future micro-segment within the Higher Education M-learning industry. Security chipsets and biometric authentication built into phones also ease compliance with proctoring norms, a factor strengthening institutional preference for smartphones when refreshing device guidelines. Vendors that streamline native-app performance, offline caching, and push-notification cadence are positioned to command premium contracts as the Higher Education M-learning market deepens across emerging nations with lower average PC penetration.
Second-generation 5G rollouts in India, Brazil, and Indonesia will further tilt usage toward smartphones by slashing latency for live quizzes and holographic demonstrations. Handset life cycles are shortening; students upgrade every 24-30 months, giving developers an expanding feature canvas without needing to back-port legacy software. Carriers, meanwhile, bundle zero-rating plans that exempt educational traffic, effectively subsidising data costs for millions. Together, these dynamics help the smartphone slice of the Higher Education M-learning market size to outpace the broader market until at least 2030. Tablet vendors are responding by emphasising pencil-based note-taking and larger-format digital textbooks, yet share gains remain modest as students gravitate to one-hand convenience. Institutions that adopt responsive design across all content types will capture engagement regardless of form factor, mitigating device-mix risk.


By Learning Mode: Asynchronous Learning Dominates Despite Synchronous Growth
Asynchronous courses accounted for 73.51% of the Higher Education M-learning market in 2024, underscoring the appeal of schedule autonomy for commuters and part-time learners. Offline module download in the Canvas mobile app permits study during transit or intermittent connectivity windows, a critical feature in bandwidth-challenged regions. Video-compression algorithms now maintain clarity at sub-1 Mbps speeds, extending reach to students on prepaid data plans. In contrast, synchronous virtual classrooms, though just 26.49% in 2024, are advancing at 14.52% CAGR as 5G penetrates and interactive polling plus breakout rooms recreate lecture-hall dynamics. Faculty cite higher attendance and faster feedback cycles when using real-time mobile sessions for office hours or capstone reviews.
The higher engagement of live sessions prompts some universities to blend the two modes, releasing recorded lectures ahead of short synchronous debates that solidify understanding. Vendors integrating calendaring, push alerts, and automatic time-zone conversion ease global cohort coordination, enhancing adoption outside the U.S. Metaverse pilots at European universities let architecture majors inspect 3D models collaboratively, pointing to a mixed-reality layer that could sit atop synchronous frameworks. Accreditation bodies now accept contact hours accrued in virtual spaces, removing a barrier that previously capped synchronous share in the Higher Education M-learning market size. Over the forecast horizon, asynchronous will stay dominant, yet incremental share shifts toward hybrid configurations appear inevitable, particularly in postgraduate and executive education programmes.
By End User: Private Universities Accelerate Digital Transformation
Public universities represented 41.82% of the Higher Education M-learning market revenue in 2024, leveraging scale and government grants to standardise learning platforms across multi-campus systems. Montana University System's statewide Canvas rollout exemplifies pooled procurement that trims license costs and eases credit transfer. Still, private universities grow faster at 14.20% CAGR as smaller governance layers enable rapid experimentation with AI chat-tutors and adaptive assessment that personalise coursework. Our Lady of Fatima University achieved a 30% leap in student outcomes after adopting a mobile-accessible HyFlex model [INSTRUCTURE.COM], signalling the agility advantage of privates. Community and technical colleges occupy a tactical position, using mobile micro-credentials to align curricula with regional labour-market gaps, for example, short welding simulations delivered via smartphones to apprentices on job sites.
Private institutions also exploit branding levers; scholarships bundled with flagship apps enhance perceived value and attract international enrolments without physical branch campuses. Conversely, public universities face cyclical appropriations that slow refresh cycles, sometimes locking them into legacy LMS versions beyond vendor end-of-support dates. Corporate partnerships are emerging, with handset makers donating devices to freshmen at minority-serving institutions, offsetting digital-divide constraints. As public-sector RFPs increasingly stipulate mobile-first compliance, the Higher Education M-learning market share held by public universities is expected to stabilise, yet absolute spending will rise as older contracts renew at higher feature tiers. Private universities will continue to capture outsized share of incremental dollars, fuelling a competitive race centred on student experience metrics visible via app-store ratings and Net Promoter Scores.
Geography Analysis
North America retained 38.61% of the Higher Education M-learning market in 2024, owing to near-universal campus Wi-Fi, generous federal research grants, and an ecosystem of mature vendors. The U.S. Department of Energy’s USD 17.3 million in higher-education research awards in 2025 underscores ongoing fiscal support that filters into platform licences. California State University channelled USD 3 million to 63 faculty AI-design projects, broadening content that can be consumed on mobile handsets. Canadian colleges likewise prioritise bilingual mobile apps to serve domestic and international cohorts, sustaining regional subscription volumes. Adoption barriers remain, notably accessibility litigation that drives demand for captioning, screen-reader compatibility, and WCAG-compliant colour palettes.
Asia-Pacific, while smaller today, is the fastest-growing region with a 15.10% CAGR through 2030 and will likely overtake Europe during the forecast window. Singapore’s EdTech Masterplan funds sandbox pilots across polytechnics, and the government offers start-up credits to local developers meeting data-sovereignty rules. South Korea’s AI textbook initiative funnels platform telemetry into national analytics dashboards that inform policy tweaks, demonstrating a virtuous cycle for vendors willing to align with standardised APIs. In India, the National Education Policy endorses credit banks and mobile micro-credentials, while 5G tariffs fell 20% in 2025, boosting rural consumption. China’s double-world-class universities invest in proprietary super-apps that integrate MOOCs, payments, and attendance QR codes, but foreign supplier access remains constrained by cybersecurity law, influencing competition dynamics across the Higher Education M-learning market.
Europe shows steady, innovation-led growth. The EU-funded OpenEU alliance connects ten distance-learning universities into one digital campus, creating a potential 368,000-student addressable cohort for mobile platform suppliers. The EUR 14.4 million EUonAIR project, led by Kozminski University, earmarks AI-driven personalisation engines that will be open-sourced for broader sector use. Metaverse classroom pilots in the UK and Spain, backed by Meta, keep Europe at the frontier of immersive mobile pedagogy. Regulatory harmonisation under the Digital Education Action Plan encourages cross-border credential recognition, stimulating pan-European enrolments and reducing localisation overhead for vendors. Collectively, these initiatives sustain a high-value, although moderately paced, contribution to the Higher Education M-learning market size.

Competitive Landscape
The Higher Education M-learning market is moderately fragmented, with the top five providers accounting for an estimated one-third of global revenue in 2024. Instructure continues to scale Canvas through AI infusions; its July 2025 partnership with OpenAI embeds large-language-model workflows that let faculty generate formative assessments inside the LMS. D2L’s Brightspace reported FY 2025 revenue of USD 205.3 million, driven by the adoption of its Creator+ authoring suite and Lumi predictive-engagement dashboards. Coursera broadened its mobile footprint to 162 million learners, blending university degrees and corporate certificates in a single app, and logged USD 179 million Q1 2025 revenue. 2U’s Chapter 11 restructuring introduces uncertainty for its 260 university partners yet also positions acquirers to consolidate programme management functions.
Technology conglomerates are heightening competition. Apple’s iOS 18 integrates AI writing assistants that export assignments directly to LMS gradebooks, tempting institutions to standardise on Apple-managed devices. Google’s LearnLM underpins Classroom’s adaptive hints, anchoring user stickiness in K-12 that will cascade into higher education. Hardware firms like Huawei bundle cloud LMS licences with ruggedised tablets in emerging markets, fast-tracking entry. Niche providers differentiate via discipline-specific depth: Top Hat targets active-learning lecture halls, while Panopto secures video intellectual property with DRM suited for medical-school cadaver recordings. On the content side, Pearson and McGraw-Hill expand textbook-app bundles that integrate real-time analytics into faculty dashboards, though publisher pricing models face pushback from student-advocacy groups.
Strategic alliances are flourishing. In April 2025 D2L launched a corporate learning arm that cross-lists university short courses for employer upskilling budgets. Canvas partners with telcos in Africa to zero-rate traffic, illustrating the importance of distribution links in bandwidth-constrained geographies. Investment rounds prioritise AI and data-privacy certifications; SOC 2 compliance has become table stakes for vendor short-listing. M&A chatter surrounds smaller VR-tool creators that could plug experiential-lab gaps in LMS catalogs. Given the capital required for AI-driven personalisation and global go-to-market teams, many early-stage players will likely seek acquisition within three years, consolidating the Higher Education M-learning market around feature-rich ecosystems.
Higher Education M-learning Industry Leaders
Instructure (Canvas)
Anthology (Blackboard)
D2L Brightspace
Moodle HQ / Open LMS
Coursera
- *Disclaimer: Major Players sorted in no particular order

Recent Industry Developments
- July 2025: Instructure and OpenAI announced a global partnership to embed AI learning experiences within Canvas LMS, enabling personalised conversational tutoring and auto-generated assessment rubrics.
- April 2025: D2L Inc. reported Q4 revenue of USD 53.3 million, pushing full-year revenue to USD 205.3 million and expanding Brightspace to 1,430 institutions worldwide.
- March 2025: D2L introduced D2L for Business, an AI-driven workforce-learning suite that maps skills gaps and curates mobile micro-courses for employees.
- January 2025: The European Commission launched the OpenEU alliance to forge the first pan-European open university serving 368,000 students through mobile-centric delivery.


Global Higher Education M-learning Market Report Scope
| Smartphones |
| Tablets |
| Wearables & Others |
| Asynchronous Self-paced |
| Synchronous Virtual Classroom |
| Public Universities |
| Private Universities |
| Community & Technical Colleges |
| North America | Canada |
| United States | |
| Mexico | |
| South America | Brazil |
| Peru | |
| Chile | |
| Argentina | |
| Rest of South America | |
| Europe | United Kingdom |
| Germany | |
| France | |
| Spain | |
| Italy | |
| BENELUX | |
| NORDICS | |
| Rest of Europe | |
| Asia-Pacific | India |
| China | |
| Japan | |
| Australia | |
| South Korea | |
| South East Asia | |
| Rest of Asia-Pacific | |
| Middle East & Africa | United Arab Emirates |
| Saudi Arabia | |
| South Africa | |
| Nigeria | |
| Rest of Middle East & Africa |
| By Device Type | Smartphones | |
| Tablets | ||
| Wearables & Others | ||
| By Learning Mode | Asynchronous Self-paced | |
| Synchronous Virtual Classroom | ||
| By End User | Public Universities | |
| Private Universities | ||
| Community & Technical Colleges | ||
| By Geography | North America | Canada |
| United States | ||
| Mexico | ||
| South America | Brazil | |
| Peru | ||
| Chile | ||
| Argentina | ||
| Rest of South America | ||
| Europe | United Kingdom | |
| Germany | ||
| France | ||
| Spain | ||
| Italy | ||
| BENELUX | ||
| NORDICS | ||
| Rest of Europe | ||
| Asia-Pacific | India | |
| China | ||
| Japan | ||
| Australia | ||
| South Korea | ||
| South East Asia | ||
| Rest of Asia-Pacific | ||
| Middle East & Africa | United Arab Emirates | |
| Saudi Arabia | ||
| South Africa | ||
| Nigeria | ||
| Rest of Middle East & Africa | ||


Key Questions Answered in the Report
What revenue level is projected for Higher Education M-learning platforms by 2030?
Aggregate vendor revenue is expected to reach USD 9.37 billion by 2030, up from USD 5.2 billion in 2025.
Which device category is expanding the fastest in Higher Education M-learning programmes?
Smartphones are advancing at a 13.62% CAGR on account of near-universal ownership and growing 5G coverage.
How quickly is Asia-Pacific growing compared with other regions?
Asia-Pacific is the fastest-growing geography, registering a 15.10% CAGR that outpaces both North America and Europe.
Why are private universities adopting mobile learning more rapidly?
Lean governance structures let privates implement AI, HyFlex and micro-credential features swiftly, driving a 14.20% CAGR in mobile learning spend.
Which learning mode currently dominates usage patterns?
Asynchronous self-paced courses hold the majority at 73.51% share, though synchronous classrooms are accelerating with better real-time connectivity.
Page last updated on:


