Student Information System Market Size and Share
Market Overview
| Study Period | 2020 - 2031 |
|---|---|
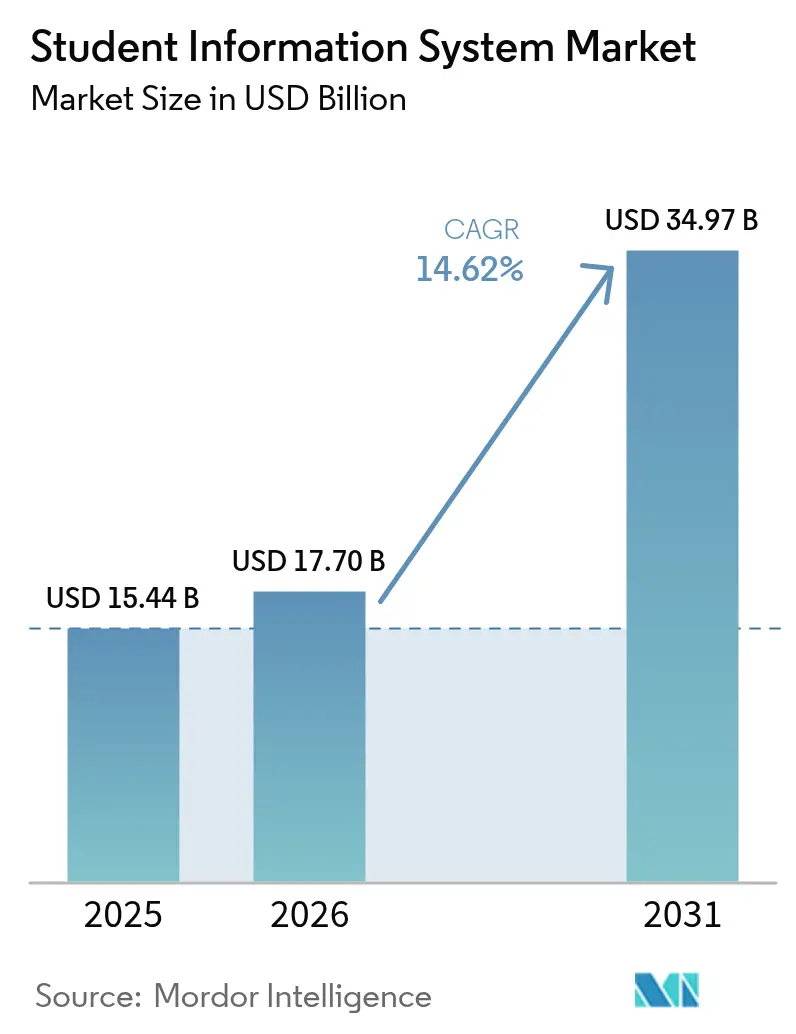
| Market Size (2026) | USD 17.7 Billion |
| Market Size (2031) | USD 34.97 Billion |
| Growth Rate (2026 - 2031) | 14.62% CAGR |
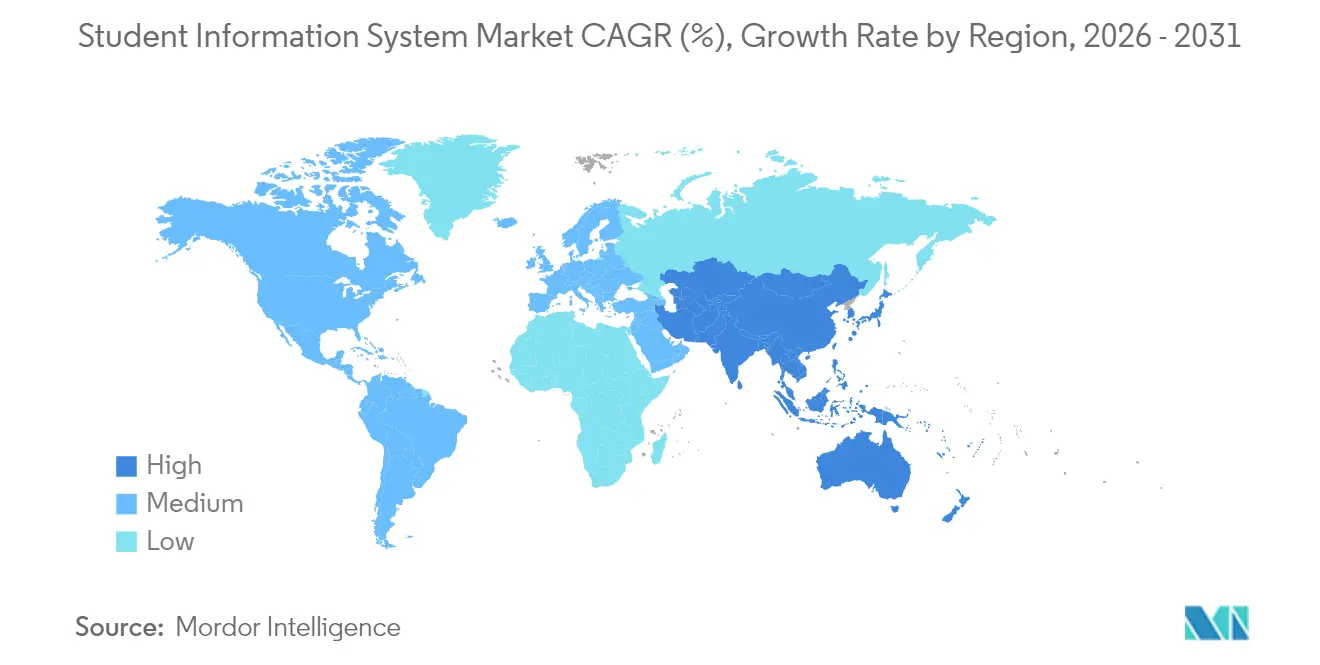
| Fastest Growing Market | Asia Pacific |
| Largest Market | North America |
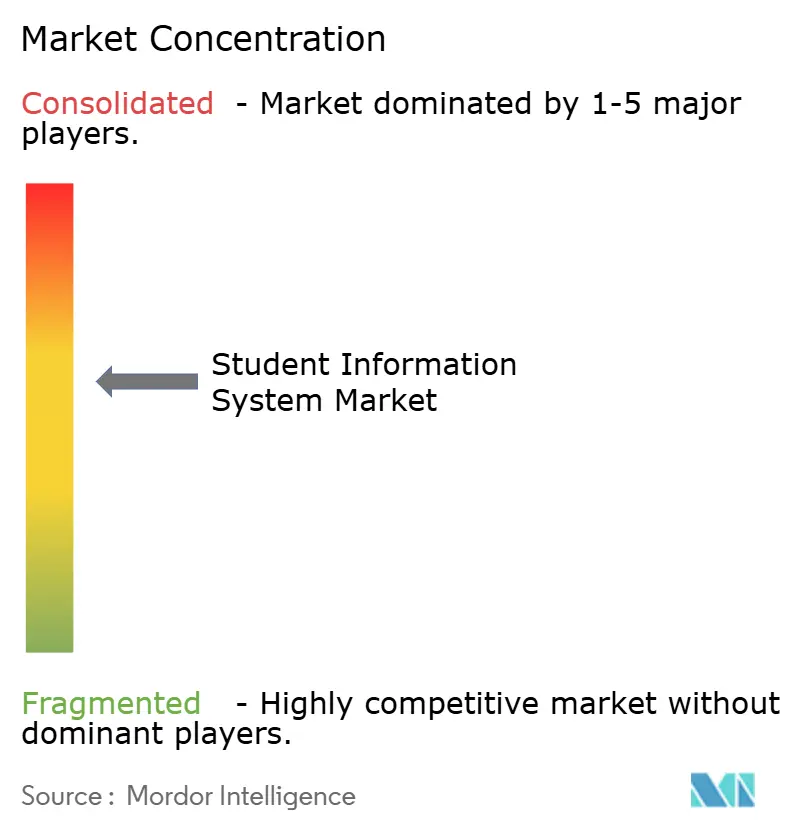
| Market Concentration | Medium |
Major Players *Disclaimer: Major Players sorted in no particular order Image © Mordor Intelligence. Reuse requires attribution under CC BY 4.0. | |
Student Information System Market Analysis by Mordor Intelligence
The Student Information System Market size was valued at USD 15.44 billion in 2025 and estimated to grow from USD 17.7 billion in 2026 to reach USD 34.97 billion by 2031, at a CAGR of 14.62% during the forecast period (2026-2031). Intensifying cloud-first mandates, growing demand for unified data ecosystems, and heightened compliance requirements are the primary forces propelling this market. Private-equity activity underscores the segment’s attractiveness, with Bain Capital acquiring PowerSchool for USD 5.6 billion and KKR purchasing Instructure for USD 4.8 billion, signalling confidence in long-term fundamentals. [1]Bain Capital, “PowerSchool to be Acquired by Bain Capital in $5.6 Billion Transaction,” baincapital.com Platform vendors continue to consolidate smaller regional players to capture institutional wallet share, while AI-driven analytics differentiate product roadmaps. Institutions are prioritising platforms that embed predictive retention capabilities, streamline regulatory reporting, and integrate seamlessly with the broader EdTech stack.
Key Report Takeaways
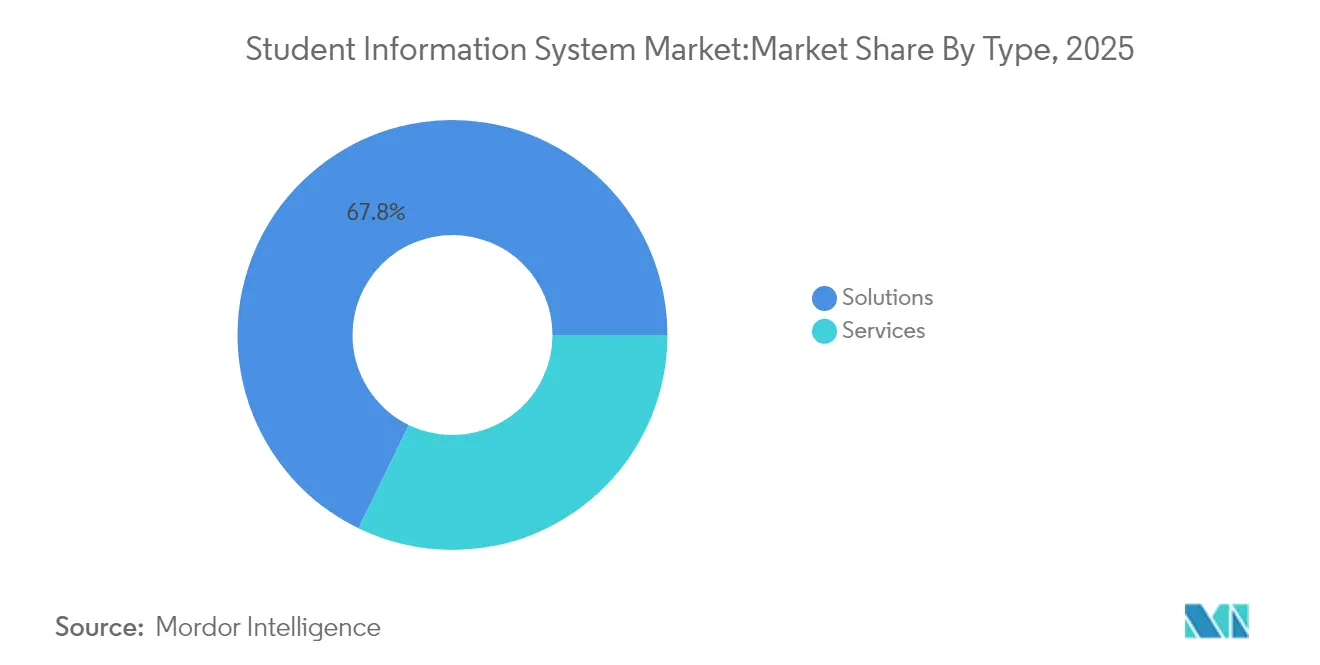
- By type, Solutions held 67.80% of the student information system market share in 2025; Services are projected to record the fastest 16.1% CAGR through 2031.
- By end-user, Higher Education led with 58.20% revenue share in 2025; K-12 Education is expanding at a 16.8% CAGR to 2031.
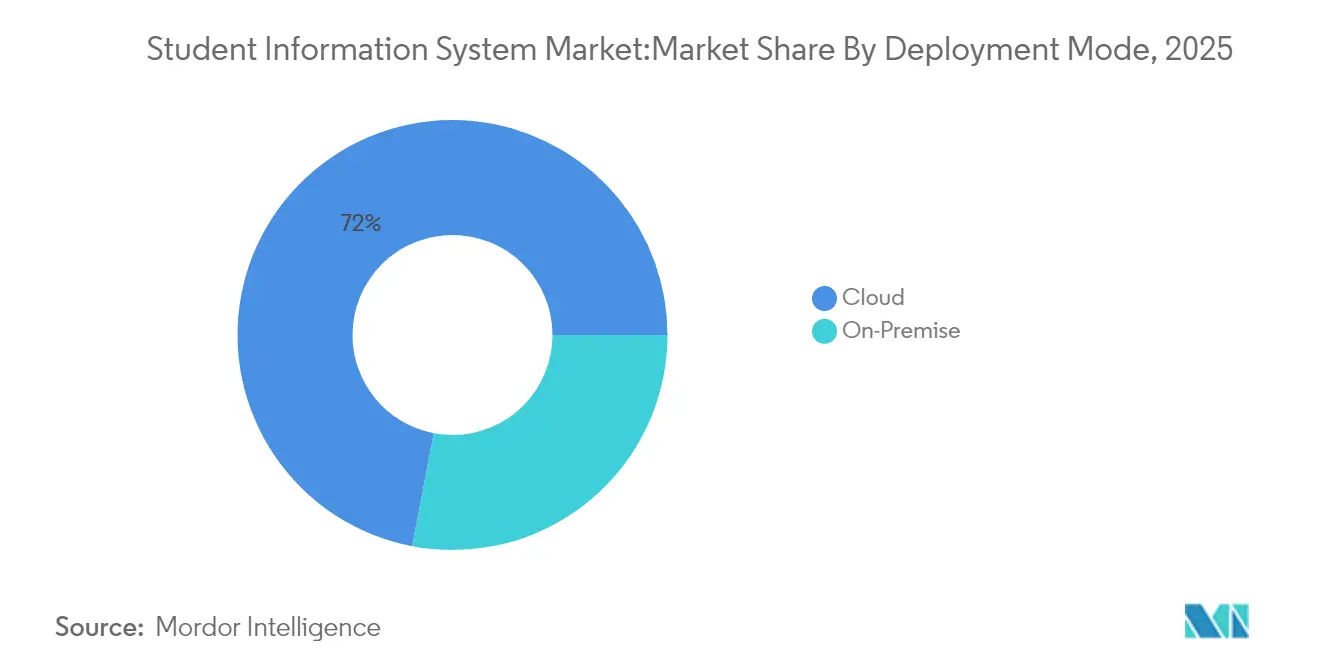
- By deployment mode, cloud platforms commanded a 72.00% share of the student information system market size in 2025 and are growing at a 15.7% CAGR.
- By institution size, medium-sized institutions (5,001–20,000 students) accounted for 43.20% of implementations in 2025; small institutions (≤5,000 students) are advancing at a 15.9% CAGR.
- By geography, North America retained 37.60% revenue share in 2025; Asia-Pacific is forecast to expand at a 16.4% CAGR through 2031.
Note: Market size and forecast figures in this report are generated using Mordor Intelligence’s proprietary estimation framework, updated with the latest available data and insights as of 2026.
Global Student Information System Market Trends and Insights
Drivers Impact Analysis*
| Driver | (~) % Impact on CAGR Forecast | Geographic Relevance | Impact Timeline |
|---|---|---|---|
| Growing cloud-first digital-transformation mandates | +3.2% | Global, strong in North America and EU | Medium term (2-4 years) |
| Mandate for holistic data-driven student-success analytics | +2.8% | Global, concentrated in Higher Education | Long term (≥ 4 years) |
| Heightened compliance and reporting burdens on institutions | +2.1% | North America and EU, expanding to Asia-Pacific | Short term (≤ 2 years) |
| Demand for unified EdTech stacks and API-ready SIS platforms | +2.5% | Global, strongest demand in North America | Medium term (2-4 years) |
| Emergence of micro-credentialing/Lifelong-learning models | +1.8% | North America and EU, pilot programmes in Asia-Pacific | Long term (≥ 4 years) |
| AI-powered predictive retention solutions embedded in SIS | +2.6% | Global, led by North America and select EU institutions | Medium term (2-4 years) |
| Source: Mordor Intelligence | |||
Growing Cloud-First Digital-Transformation Mandates
Institutions are shifting wholesale to cloud-native SIS platforms to gain unified data backbones, real-time analytics, and frictionless integrations. Western Sydney University consolidated multiple applications onto Ellucian Banner to support 45,000 students across 10 campuses, replacing disparate on-premises systems with a single cloud environment. [2]Ellucian, “Building an Integrated Experience Across Campuses,” ellucian.com The University of La Verne later increased data-download speed by 50% after layering AI on the same cloud stack. With cloud penetration already at 72.6%, many institutions now deem hybrid models an unnecessary complication. Cloud architectures also lay the groundwork for predictive analytics, an area where legacy systems cannot compete. As a result, vendors are pivoting to subscription models that fund continuous innovation while customers benefit from automatic updates and stronger security postures.
Mandate for Holistic Data-Driven Student-Success Analytics
Universities are migrating from reactive student support toward proactive engagement informed by predictive modelling. Georgia State University improved graduation rates using predictive alerts, and the University of Kentucky used SIS-generated insights to flag and support at-risk learners. To unlock such value, Duke University launched online data-training courses so staff can interpret dashboards effectively. Modern platforms now merge academic records, behavioural signals, and financial data, delivering a 360-degree view of each learner. This shift is transforming the student information system market into a strategic analytics cornerstone that informs institutional resource allocation, financial aid targeting, and curriculum design.
Heightened Compliance and Reporting Burdens on Institutions
Global data-privacy frameworks are tightening, compelling SIS vendors to embed compliance features at the architectural level. Infinite Campus offers a FERPA compliance framework that protects minor data by default. Microsoft’s School Data Sync solution automates GDPR tagging across integrated apps to safeguard personal data during transfers. Real-time regulatory reporting is now essential as funding agencies demand granular performance metrics. Institutions lacking automated compliance functions risk financial penalties, driving them toward platforms with embedded privacy logic and audit-ready reporting modules.
Demand for Unified EdTech Stacks and API-Ready SIS Platforms
Fragmented point solutions create data silos and manual workarounds. The EDU-API standard, spearheaded by the 1EdTech community, is close to launch and promises cleaner interoperability across EdTech products. Instructure’s partnership with Lucid Software eliminated file exports by enabling real-time read-write integration within Canvas. Institutions now evaluate vendors on API depth, out-of-the-box connectors, and marketplace ecosystems rather than on core administrative functionality alone. This demand propels the student information system market toward open architectures, accelerating third-party innovation while lowering institutional integration costs.
Restraints Impact Analysis*
| Restraint | (~) % Impact on CAGR Forecast | Geographic Relevance | Impact Timeline |
|---|---|---|---|
| Skills and change-management gaps among education staff | -1.9% | Global, particularly acute in smaller institutions | Short term (≤ 2 years) |
| Capital-expenditure constraints in low-income regions | -2.3% | Developing markets in Asia-Pacific, MEA, and Latin America | Medium term (2-4 years) |
| Heightened data-privacy/residency regulations | -1.2% | EU leading, expanding to Asia-Pacific and selective US states | Long term (≥ 4 years) |
| Vendor lock-in and legacy-migration complexity | -1.8% | Global, concentrated in institutions with 10+-year-old systems | Medium term (2-4 years) |
| Source: Mordor Intelligence | |||
Skills and Change-Management Gaps Among Education Staff
Rapid platform evolution demands data literacy and process redesign skills that many institutions lack. Duke University’s staff training programme illustrates the investment needed to close knowledge gaps. Resistance to automated workflows persists among employees accustomed to manual procedures, especially in small schools with limited professional-development budgets. Without upskilling, institutions under-utilise advanced features, diminishing return on investment, and prolonging reliance on obsolete processes. This restraint slows cloud migrations and feature adoption across the student information system market, particularly where staffing resources are thin.
Capital-Expenditure Constraints in Low-Income Regions
The sunset of pandemic-era ESSER funds in 2024 forced many K-12 districts to defer technology upgrades. A separate survey found 68% of school systems delaying replacements due to budget shortfalls. Subscription pricing lowers upfront costs, but recurring fees remain a burden where operating budgets are thin. Consequently, high-capability SIS platforms cluster in wealthier geographies, limiting market penetration in developing regions and widening the digital divide.
*Our forecasts treat driver/restraint impacts as directional, not additive. The impact forecasts reflect baseline growth, mix effects, and variable interactions.
Segment Analysis
By Type: Momentum Shifts Toward Service-Enhanced Platforms
Solutions captured 67.80% revenue in 2025 as institutions standardised on full-stack platforms. PowerSchool’s 90-day deployment for 40,000 students underscores how vendors refine implementation toolkits to compress timelines. Services, although only 32.20% of spend, are compounding at 16.1% CAGR as campuses need configuration, training, and analytics expertise to unlock advanced features.The lasting appeal of turnkey solutions drives consolidation: platform leaders acquire regional specialists to deepen vertical functionality and scale support teams. Simultaneously, services arms are evolving from basic deployment to continuous optimisation, data-science consulting and AI model tuning. This symbiosis expands the student information system market by embedding long-term vendor-client partnerships that refresh revenue streams beyond licence fees.


By End-user: K-12 Surge Rebalances Institutional Mix
Higher Education maintained a 58.20% share in 2025 due to complex feature requirements and larger average deal sizes. Yet post-pandemic digitisation grants have sparked a sharp rise in K-12 demand, propelling a 16.8% CAGR to 2031. District-wide purchasing consortia negotiate favourable terms that democratise access to advanced functionality.Infinite Campus now serves 10 million learners across 46 states, demonstrating the scale benefits in K-12. Conversely, universities face enrolment headwinds and legacy entanglements that slow migrations. As K-12 adoption expands, vendors tailor UX and compliance modules to the unique workflows of younger learners, further accelerating momentum in this segment of the student information system market.
By Deployment Mode: Cloud Supremacy Drives Subscription Economics
Cloud implementations represented 72.00% of all deployments in 2025 and are advancing at 15.7% CAGR. Western Sydney University reported round-the-clock student access and streamlined administration after moving to the cloud. On-premise footprints continue to erode as boards demand reduced infrastructure risk, automatic feature rollouts, and native security controls.Unit4 disclosed that 95% of new customers in 2024 selected cloud deployments, validating the irreversible shift in buyer preference. Subscription revenue also aligns vendor incentives with customer outcomes, funding faster product iteration cycles that further differentiate cloud solutions within the student information system market.
By Institution Size: Democratisation Opens New Frontiers
Medium-sized universities captured 43.20% of 2025 deployments, sitting at the sweet spot between feature complexity and implementation agility. However, small campuses are the fastest movers, clocking a 15.9% CAGR amid cloud economics that remove historical barriers. Packaged best-practice templates reduce the need for costly customisation, letting smaller teams leverage predictive retention dashboards previously reserved for large universities.Large institutions continue to shape roadmap direction through enterprise-scale requirements such as multi-college governance, but protracted change-management schedules temper adoption speed. Vendors are responding with tiered editions that scale from basic to advanced without compromising data model consistency, thereby widening the total addressable student information system market.
Geography Analysis
North America accounted for 37.60% of 2025 revenue, supported by substantial IT budgets and a dense vendor ecosystem. Yet spending growth is moderating as campuses optimise existing stacks rather than pursue wholesale replacements. The ESSER funding cliff intensifies pressure on K-12 budgets, while universities confront enrolment volatility. Nevertheless, the region remains an innovation test bed, piloting AI-powered retention modules that later roll out globally.Asia-Pacific is the fastest-growing region at a 16.4% CAGR through 2031, benefiting from greenfield cloud deployments that bypass legacy baggage. PowerSchool plans to scale its Indian workforce to 2,000 within five years to capitalise on regional demand. Tribal Group won a USD 3 million AUD contract with British University Vietnam, highlighting rising investment appetite in emerging markets.Europe records steady uptake, driven by GDPR compliance that elevates the value of platforms embedding privacy-by-design. A five-year Ellucian–Interuniversity Services Inc. deal covering Atlantic Canada illustrates cross-border collaboration models that could replicate across European consortia. Middle East and Africa trail in scale but present long-term upside as connectivity projects and workforce-ready education agendas gather momentum. Collectively, these trends reinforce the cross-regional expansion strategy adopted by the major players in the student information system market.

Competitive Landscape
Consolidation is accelerating, yet the field remains moderately fragmented. Bain Capital’s takeover of PowerSchool and KKR’s purchase of Instructure injected significant capital for R&D and market entry programmes. Jenzabar secured 134 new institutions in 2024 and deepened ties with Google Cloud to enhance scalability.
Technological moats now depend on AI engines, low-code configuration, and open APIs. The recent USPTO patent on tuning educational data structures emphasises vendor focus on optimising complex schemas for real-time analytics. Disruptors differentiate through niche modules such as micro-credential tracking or advanced retention risk scoring, which larger vendors may later emulate or acquire. Strategic partnerships, exemplified by Instructure integrating Microsoft Reflect for student wellness, extend platform stickiness.
Going forward, platform vendors will balance M&A with ecosystem alliances to cover white-space functionalities without diluting core focus. Market share concentration is therefore likely to increase gradually, but open-API architectures will allow specialised providers to coexist within the broader student information system market.
Student Information System Industry Leaders
PowerSchool Holdings Inc.
Ellucian Company LP
Oracle Corporation (Student Cloud)
Workday Inc.
Skyward Inc.
- *Disclaimer: Major Players sorted in no particular order

Recent Industry Developments
- February 2025: Jenzabar announced selection by 134 institutions in 2024 and expanded its partnership with Google Cloud to bolster SIS capabilities.
- February 2025: Workday posted USD 2.211 billion Q4 revenue, up 15%, and launched Workday Student in Australia and New Zealand.
- February 2025: Blackbaud recorded USD 1.2 billion in 2024 revenue with 98% recurring income, reinforcing its education focus.
- January 2025: Unit4 appointed Simon Paris as CEO after reaching 80% recurring revenue and targeting a EUR 1 billion turnover.
- January 2025: Intellinetics broadened its Skyward alliance to deliver AI-based payables automation across 2,500 districts.
- November 2024: KKR and Dragoneer finalised Instructure’s USD 4.8 billion acquisition, setting a USD 1 billion revenue target for 2028.
- October 2024: Bain Capital closed the USD 5.6 billion PowerSchool acquisition to accelerate AI-led growth.


Research Methodology Framework and Report Scope
Market Definitions and Key Coverage
Mordor Intelligence defines the global Student Information System (SIS) market as all cloud- or premise-based software platforms and paid service bundles that capture, store, and route core student data, including admissions, enrollment, academic records, finance, attendance, and engagement, across K-12 and higher-education institutions. A solution is counted only when it constitutes the system of record for student data at an institution.
Scope exclusion: Stand-alone learning management or classroom apps that do not hold authoritative student records are outside this study.
Segmentation Overview
- By Type
- Solutions
- Services
- By End-user
- K-12 Education
- Higher Education
- By Deployment Mode
- On-Premise
- Cloud
- By Institution Size
- ≤5,000 Students (Small)
- 5,001-20,000 Students (Medium)
- >20,000 Students (Large)
- By Geography
- North America
- United States
- Canada
- Mexico
- South America
- Brazil
- Argentina
- Chile
- Rest of South America
- Europe
- Germany
- United Kingdom
- France
- Italy
- Spain
- Russia
- Rest of Europe
- Asia-Pacific
- China
- India
- Japan
- South Korea
- Singapore
- Malaysia
- Australia
- Rest of Asia-Pacific
- Middle East and Africa
- Middle East
- United Arab Emirates
- Saudi Arabia
- Turkey
- Rest of Middle East
- Africa
- South Africa
- Nigeria
- Rest of Africa
- Middle East
- North America
Detailed Research Methodology and Data Validation
Primary Research
Interviews with SIS product managers, district technology chiefs, bursars, and regional EdTech integrators across North America, Europe, Asia Pacific, and the GCC test key assumptions, surface average selling prices, and validate adoption triggers such as compliance deadlines and cloud-first mandates.
Desk Research
Our analysts first map the addressable pool using public datasets such as UNESCO Institute for Statistics, National Center for Education Statistics, Eurostat, and Ministries of Education enrollment bulletins, followed by trade association yearbooks and customs exports of packaged education software. Company 10-Ks, IPO filings, and investor decks help size vendor revenue streams, while paid sources, including D&B Hoovers for financial splits and Dow Jones Factiva for deal flow, add depth. Patent dashboards from Questel and procurement notices logged on Tenders Info flag emerging functionality and installation volumes. The sources above illustrate the wider body reviewed; many additional references inform specific data points.
Market-Sizing & Forecasting
We model 2025 revenue by applying weighted license-fee and subscription ARPU to active institution counts derived top-down from enrollment registers, which are then corroborated with sampled bottom-up vendor billings and channel checks. Drivers captured include student head count, device penetration, cloud migration rates, district IT budgets, FERPA/GDPR compliance spend, and churn cycles of legacy SIS contracts. Forecasts to 2030 are generated through multivariate regression blended with scenario analysis, using expected enrollment trends, per-student IT spend, and SaaS price lift as independent variables; coefficients are tuned through expert consensus reviews. Gaps in sampled bottom-up data are bridged by median ARPU interpolation before final reconciliation.
Data Validation & Update Cycle
Outputs pass three-layer variance checks, peer review, and senior analyst sign-off. We refresh every twelve months and issue interim revisions when material vendor mergers or major policy shifts occur.
Why Mordor's Student Information System Baseline Is Dependable
Published market values regularly diverge because firms vary scope, pricing capture, and refresh cadence.
Key gap drivers include whether services revenue is bundled, the enrollment tiers counted, and the currency conversion moment used for global roll-ups. Mordor reports the mid-year constant currency view and discloses every inclusion rule, whereas other publishers may fold peripheral training tools or quote list prices without discount normalization.
Benchmark comparison
| Market Size | Anonymized source | Primary gap driver |
|---|---|---|
| USD 15.44 B (2025) | Mordor Intelligence | - |
| USD 15.33 B (2024) | Global Consultancy A | Includes stand-alone classroom apps; list-price ASPs |
| USD 8.86 B (2023) | Research Publisher B | Excludes paid implementation services; older currency base |
| USD 11.29 B (2024) | Industry Forum C | Omits higher-education private institutions |
Taken together, the comparison shows that when consistent scope and constant currency rules are applied, Mordor's balanced figure offers decision-makers the clearest, repeatable baseline for planning.


Key Questions Answered in the Report
What is the current student information system market size?
The student information system market size stands at USD 17.7 billion in 2026 and is projected to reach USD 34.97 billion by 2031.
Which deployment model is growing fastest?
Cloud deployments lead with 72.00% share in 2025 and are growing at a 15.7% CAGR due to lower infrastructure overheads and real-time analytics capabilities.
Why is Asia-Pacific considered a high-growth region?
Asia-Pacific is forecast to expand at a 16.4% CAGR because governments are funding large-scale digitisation programmes and institutions can leapfrog legacy systems with cloud-native platforms.
How are private-equity investments affecting the market?
Large buyouts such as Bain Capital’s purchase of PowerSchool are injecting capital that accelerates product innovation, international expansion and further consolidation.
What challenges hinder SIS adoption?
Key barriers include staff skill gaps, capital-expenditure constraints in lower-income regions, stricter data-privacy regulations and the complexity of migrating from decade-old legacy systems.
Which segment is experiencing the fastest growth?
The K-12 end-user segment is growing at a 16.8% CAGR as school districts embrace data-driven decision-making and benefit from group purchasing arrangements.
Page last updated on:


