
Learning Management System (LMS) Market Size and Share
Market Overview
| Study Period | 2020 - 2031 |
|---|---|
| Market Size (2026) | USD 30.51 Billion |
| Market Size (2031) | USD 54.86 Billion |
| Growth Rate (2026 - 2031) | 12.45 % |
| Fastest Growing Market | Asia Pacific |
| Largest Market | North America |
| Market Concentration | Medium |
Major Players *Disclaimer: Major Players sorted in no particular order Image © Mordor Intelligence. Reuse requires attribution under CC BY 4.0. | |
Learning Management System (LMS) Market Analysis by Mordor Intelligence
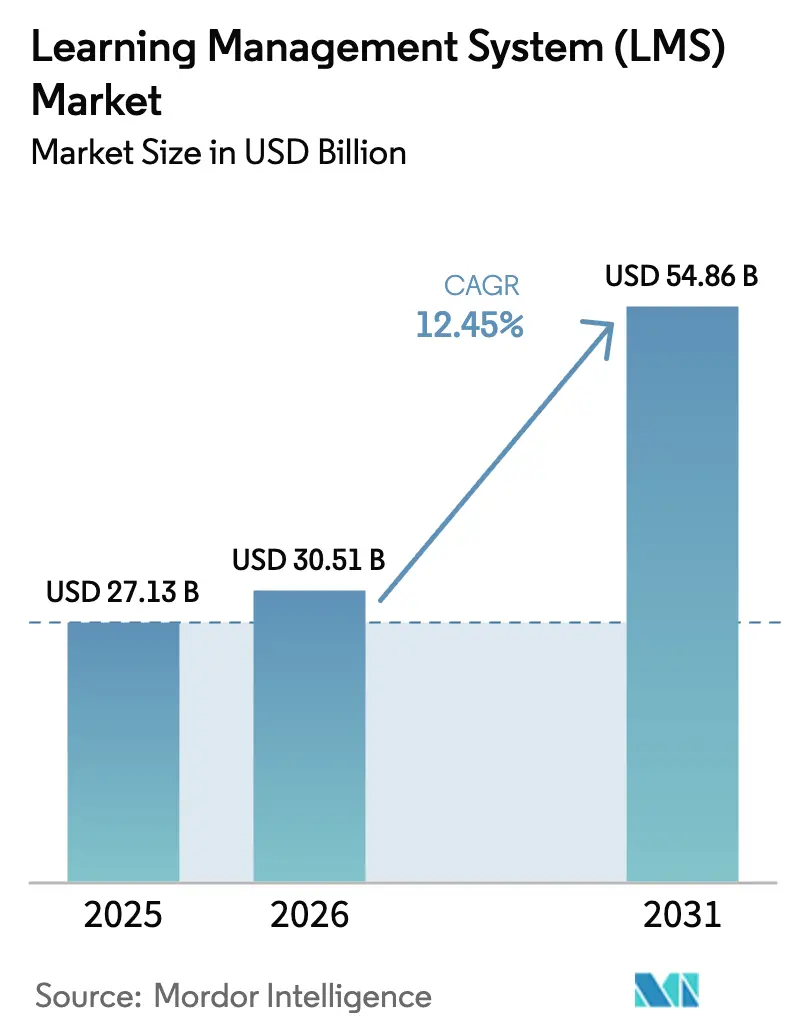
The Learning Management System Market size is expected to increase from USD 27.13 billion in 2025 to USD 30.51 billion in 2026 and reach USD 54.86 billion by 2031, growing at a CAGR of 12.45% over 2026-2031. The institutionalization of hybrid work policies, the elevation of skills verification in regulated industries, and the democratization of cloud infrastructure are reinforcing demand by lowering total cost of ownership for buyers with limited in-house IT capacity. Vendors that expose open APIs and pre-built connectors are capturing a widening share of new installations because enterprises want plug-and-play integrations with HR, CRM, and talent-management suites. At the same time, outcome-linked pricing models are gaining traction as buyers demand measurable improvements in course-completion rates and time-to-competency. The competitive field remains fragmented, yet generative-AI features are driving a new product cycle that favors providers able to harness large-language models for automated content generation and adaptive feedback loops.
Key Report Takeaways
- By deployment mode, cloud platforms held 88.24% of the learning management system market share in 2025, while on-premise and hybrid solutions are forecast to post only single-digit growth; the same period shows cloud deployments expanding at a 14.22% CAGR to 2031.
- By component, packaged solutions dominated with 71.44% revenue share in 2025, whereas services are expected to accelerate at a 14.86% CAGR through 2031 as buyers outsource customization and managed administration.
- By delivery mode, distance learning generated 48.76% of 2025 revenue, yet blended learning is projected to advance at a 13.48% CAGR, reflecting a pivot toward synchronous coaching layered onto asynchronous micro-modules.
- By organization size, large enterprises commanded 62.36% share in 2025, but small and medium enterprises are on track to expand adoption at a 14.09% CAGR because turnkey subscription tiers compress per-seat pricing.
- By end-user vertical, educational institutions led with 40.68% of 2025 spending, while healthcare and pharmaceuticals represent the fastest-growing vertical at a 13.68% CAGR under continuing professional-development mandates.
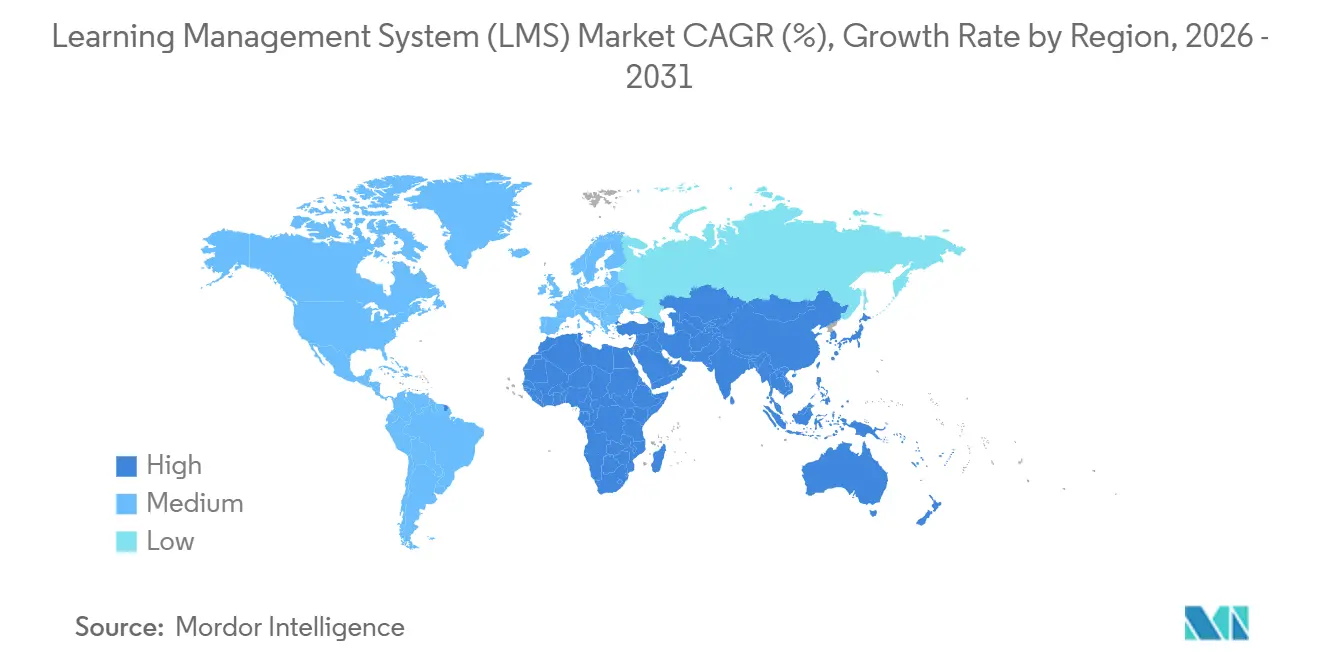
- By geography, North America contributed 36.52% of global revenue in 2025, whereas Asia Pacific is forecast to deliver a 12.88% CAGR through 2031 on the back of government digitization programs and employer-funded micro-credentialing.
Note: Market size and forecast figures in this report are generated using Mordor Intelligence’s proprietary estimation framework, updated with the latest available data and insights as of January 2026.
Global Learning Management System (LMS) Market Trends and Insights
Drivers Impact Analysis*
| Driver | (~) % Impact on CAGR Forecast | Geographic Relevance | Impact Timeline |
|---|---|---|---|
| Accelerated Remote and Hybrid Work Models Sustaining Corporate LMS Demand | +2.8% | North America and Europe | Medium term (2-4 years) |
| Integration of AI-Driven Adaptive Learning Algorithms Boosting Course-Completion Rates | +2.5% | Global (early adoption in North America and select Asia Pacific markets) | Short term (≤2 years) |
| Government Funding for Digital Education Infrastructure | +2.1% | Asia Pacific, Africa, South America | Long term (≥4 years) |
| Employer Demand for Skills-Verification Micro-Credentials in Asia Pacific Manufacturing Hubs | +1.6% | China, India, Vietnam, Thailand | Medium term (2-4 years) |
| Mandatory CPD Regulations in EU Healthcare Catalyzing Specialized LMS Modules | +1.4% | Europe | Long term (≥4 years) |
| BYOD Workforce Mobility Accelerating Mobile-First Cloud LMS Adoption in the Middle East | +1.2% | Middle East and spillover to Africa | Short term (≤2 years) |
| Source: Mordor Intelligence | |||
Accelerated Remote and Hybrid Work Models Sustaining Corporate LMS Demand
Permanent hybrid work norms have reshaped enterprise approaches to onboarding and compliance training. As of December 2025, 58% of Fortune 500 employers retained flexible location policies, prompting learning teams to replace static portals with mobile-responsive platforms that surface micro-lessons inside Slack and Microsoft Teams. Open xAPI telemetry now captures engagement across virtual-reality simulations, quick-reference videos, and live webinars, enabling learning-and-development managers to intervene before compliance deadlines lapse. Peer-generated video explainers, indexed by AI search, have shortened time-to-competency for new hires by 23% according to a 2025 McKinsey digital upskilling study. Corporations are inserting these social-learning artifacts into curricula, creating a knowledge-sharing culture that reduces reliance on expensive instructor-led sessions. The upshot is continued budget allocation to platforms that can orchestrate asynchronous and synchronous modalities without geographic constraints.
Integration of AI-Driven Adaptive Learning Algorithms Boosting Course-Completion Rates
Generative AI transforms the learning management system market from a content repository into a dynamic tutoring environment. In 2025, Instructure embedded GPT-4 to auto-generate quizzes and summarize discussions, cutting instructor grading time by 30% while maintaining academic rigor. Adaptive engines monitor quiz scores, navigation patterns, and time-on-task to predict drop-off risk, then trigger interventions such as simplified materials or peer mentoring. Community colleges piloting adaptive workflows posted an 18-percentage-point improvement in completion rates versus cohort-based instruction.[1]Journal of Educational Technology and Society, “Adaptive Learning Systems and Course Completion Rates in Community Colleges,” jstor.org The same algorithms underpin competency-based education models that let adult learners progress upon demonstrating mastery, an approach that aligns with the gig economy’s demand for just-in-time upskilling.
Government Funding for Digital Education Infrastructure
Developing nations expanded digital-learning budgets by 34% year over year in 2025, funneling USD 12.7 billion into connectivity, devices, and platform licenses. India’s PM eVIDYA 2.0 earmarked INR 85 billion (USD 1.02 billion) to equip 150,000 public schools with broadband and LMS access. South Africa struck a zero-rated data deal with Vodacom, removing mobile bandwidth fees for approved educational domains. These initiatives stimulate demand for vernacular interfaces, offline-sync modules, and lightweight video codecs that function in low-bandwidth settings. Vendors capable of localizing UX and partnering with regional publishers capture long-tail opportunities as ministries seek platforms that double as national learning backbones.
Employer Demand for Skills-Verification Micro-Credentials in Asia Pacific Manufacturing Hubs
Manufacturers are embedding blockchain-verified certificates into hiring, onboarding, and promotion processes. Foxconn requires recruits to pass a 40-hour Industry 4.0 LMS course before entering production lines, a policy that cut first-month defect rates by 19% in 2025. India’s National Credit Framework lets workers stack modular LMS credits toward formal diplomas, forming a portable skills passport. In response, platform vendors are integrating with credentialing networks such as Credly for real-time verification, curbing credential fraud in high-turnover environments. The result is sustained enterprise spending on systems that issue, store, and authenticate micro-credentials across supply-chain partners.
Restraints Impact Analysis*
| Restraint | (~) % Impact on CAGR Forecast | Geographic Relevance | Impact Timeline |
|---|---|---|---|
| Rising Per-Learner SaaS-Licensing Inflation Squeezing K-12 Budgets | -1.8% | North America and Europe | Short term (≤2 years) |
| Patchy Broadband Coverage Limiting Immersive-Content Delivery in Rural Africa and South Asia | -1.5% | Sub-Saharan Africa and South Asia | Long term (≥4 years) |
| Fragmented Data Standards Hindering HRIS-LMS Integrations in Legacy European Corporates | -0.9% | Europe | Medium term (2-4 years) |
| Escalating Cyber-Insurance Premiums Deterring Small Healthcare Providers from Cloud Migration | -0.7% | North America and Europe | Short term (≤2 years) |
| Source: Mordor Intelligence | |||
Rising Per-Learner SaaS-Licensing Inflation Squeezing K-12 Budgets
Average per-learner fees jumped 11% in 2025, consuming 22% of instructional-technology budgets in many U.S. districts. Renewal sticker shock forces administrators to choose between premium LMS features and essential hardware purchases, widening equity gaps between affluent and under-resourced schools. Some districts negotiate consortium pricing, while others migrate to open-source Moodle instances. Freemium tiers introduced by commercial vendors create a two-speed ecosystem in which premium analytics and adaptive assessments remain out of reach for cash-strapped institutions. Without relief, districts risk reverting to outdated learning methods that undercut digital-literacy gains achieved during the pandemic.
Patchy Broadband Coverage Limiting Immersive-Content Delivery in Rural Africa and South Asia
Broadband penetration remains below 35% in large swaths of sub-Saharan Africa and South Asia, hampering delivery of video lectures, virtual labs, and augmented-reality simulations. In Nigeria, 72% of secondary schools lack reliable internet, compelling teachers to shuttle USB drives loaded with courseware from urban hubs, which eliminates real-time analytics. India’s Bharatnet fiber rollout achieved only 58% of its target by December 2025.[2]Bharatnet Project Government of India, “Fiber Optic Rollout Progress Report Q4 2025,” bharatnet.gov.in Vendors are releasing offline-first architectures that cache content on mobile devices and sync progress data intermittently, yet these workarounds sacrifice instructor feedback and social-learning dynamics. Until last-mile connectivity improves, immersive content will remain a privilege of urban learners, constraining demand for high-bandwidth LMS features in rural markets.
*Our forecasts treat driver/restraint impacts as directional, not additive. The impact forecasts reflect baseline growth, mix effects, and variable interactions.
Segment Analysis
By Component: Services Gain Momentum as Ecosystem Complexity Rises
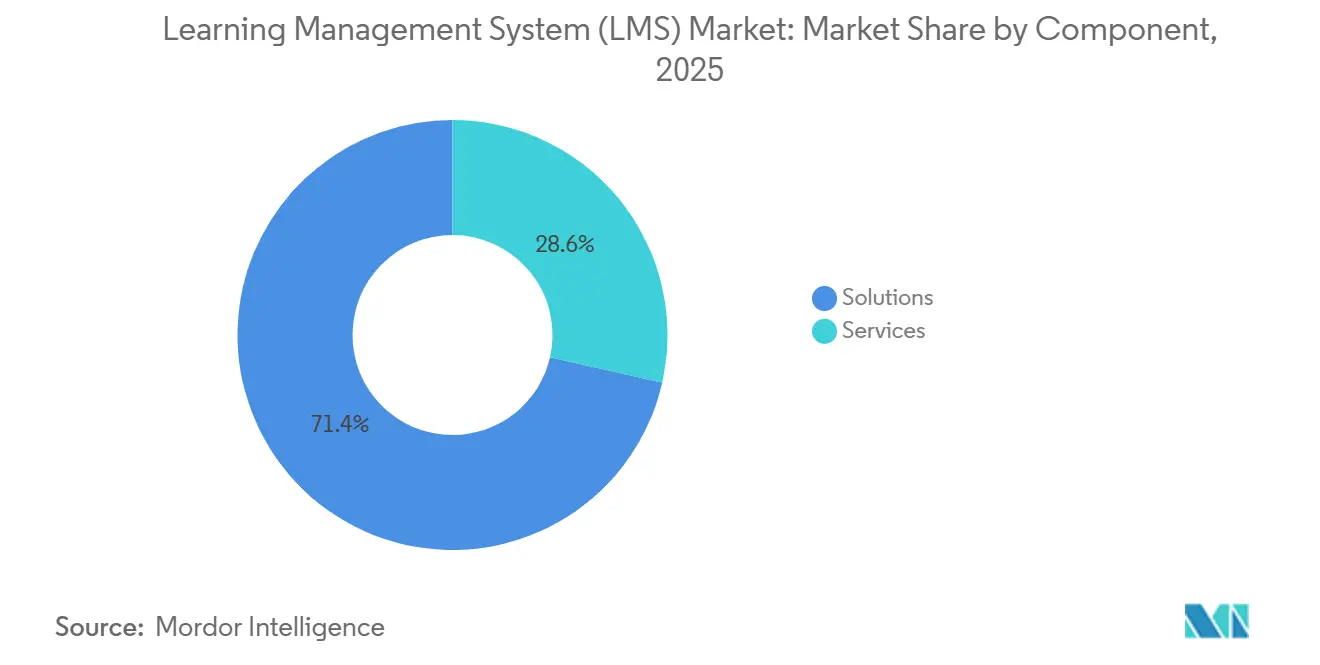
By component, packaged solutions dominated with a 71.44% revenue share in 2025, while services are projected to accelerate at a 14.86% CAGR through 2031 as buyers increasingly outsource customization and managed administration. Solutions generated the bulk of revenue in 2025, yet the services segment is widening its footprint on the strength of double‑digit growth. Enterprises that deployed best‑of‑breed learning suites now face mounting integration chores, from mapping competency frameworks to configuring single‑sign‑on across disparate HR and payroll systems. Many rely on managed‑services providers that guarantee 99.9% uptime and manage global content catalogs aligned with regional data‑residency rules.
Services growth is further boosted by outcome‑based contracts that peg fees to measurable gains such as course‑completion rates. This realigns vendor incentives toward learner success and encourages risk‑averse buyers to approve larger transformation budgets. Educational institutions also benefit from train‑the‑trainer bootcamps that reduce dependence on external consultants and enable faculty to design digital courses in‑house. The dual dynamic of corporate outsourcing and academic capacity building reinforces services as a pivotal revenue lever in the learning management system (LMS) market.


By Deployment Mode: Cloud Underpinned by Open APIs
Cloud deployments commanded 88.24% of the learning management system market in 2025, underscoring the appeal of elastic infrastructure that adapts to fluctuating enrollment. Multinationals favor multi‑tenant SaaS models because open REST APIs allow platforms to ingest learner data from CRM, e‑commerce, and marketing‑automation stacks, creating unified profiles that support lifetime engagement. Even industries with sovereign data mandates, such as defense and banking, are exploring hybrid architectures that keep sensitive records on local servers while shifting analytics dashboards to the public cloud. Edge‑computing caches placed inside manufacturing plants and remote campuses serve high‑resolution content with low latency while synchronizing mastery records to central data lakes, broadening addressable demand and reinforcing cloud’s primacy.
By deployment mode, cloud platforms not only held 88.24% market share in 2025, but are also projected to expand at a 14.22% CAGR through 2031, while on‑premise and hybrid models post only single‑digit growth. Adoption is further fueled by organizations seeking scalable delivery without the overhead of hardware refresh cycles, particularly as global learning ecosystems grow more distributed. Hybrid blueprints continue to gain selective traction for regulated sectors, yet the operational efficiencies, integration depth, and analytics capabilities of cloud deployments secure their position as the dominant backbone of the learning management system (LMS) market.
By Delivery Mode: Blended Learning Validates the Human-Plus-Digital Equation
Distance learning generated 48.76% of 2025 revenue, making it the largest delivery mode that year, yet blended learning is gaining the strongest momentum due to its measurable impact on skill transfer. Pairing self‑paced modules with instructor‑led workshops improves retention by 27%, prompting L&D leaders to redirect budgets toward platforms optimized for synchronous coaching layered onto asynchronous micro‑modules. This shift reflects a broader pivot from static course formats to dynamic structures that reinforce real‑world application and sustain learner engagement.
Virtual‑reality classrooms represent the latest evolution of the blended model. Learners across time zones can collaborate in shared 3D workspaces, manipulating machinery models or role‑playing customer interactions without travel costs or logistical barriers. Vendors that support native VR streaming and real‑time analytics are positioned to capture incremental share as enterprises seek immersive yet scalable learning experiences. With blended learning projected to advance at a 13.48% CAGR, the market is steadily moving toward multi‑modal delivery as the next standard across the learning management system (LMS) market ecosystem.
By Organization Size: Turnkey Platforms Unlock SME Adoption
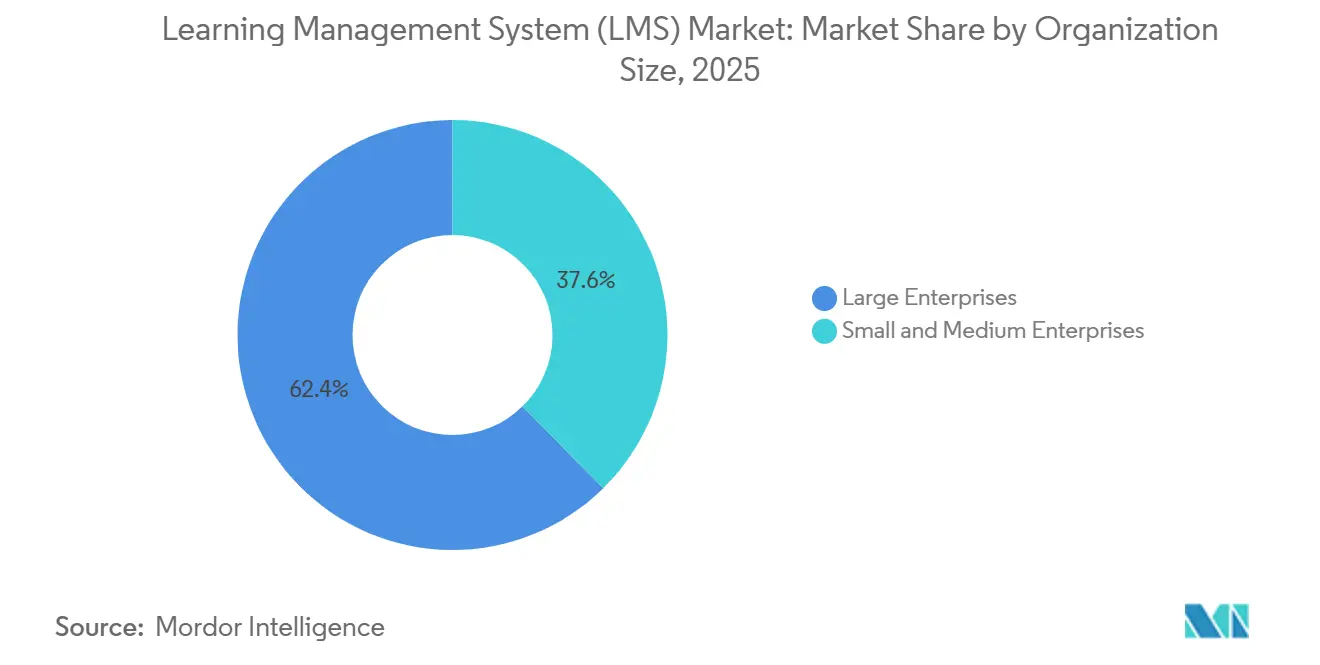
Large enterprises remained the largest revenue contributors with 62.36% market share in 2025, yet SME adoption is accelerating as pricing compression narrows the affordability gap in the learning management system (LMS) market. Platforms such as TalentLMS offer pre‑configured onboarding and compliance templates that enable a 200‑employee manufacturer to launch within days. Between 2023 and 2025, per‑seat costs for SME tiers fell by 18%, placing enterprise‑grade analytics and reporting capabilities within reach of smaller teams. Integration with SME‑friendly applications, like QuickBooks for accounting and HubSpot for marketing, reduces administrative overhead, while in‑product tutorials empower non‑technical staff to design custom courses without external support.
Sector‑specific templates for hospitality, retail, and construction further streamline deployment, shortening the payback period and expanding learning management system adoption among organizations with limited IT resources. By organization size, SMEs are projected to grow at a 14.09% CAGR, driven by turnkey subscription tiers that compress per‑seat pricing and simplify rollout. As a result, while large enterprises continue to generate the majority of current revenue, the SME segment is becoming an increasingly influential driver of market expansion.
By End-User Vertical: CPD Mandates Propel Healthcare Uptake
Educational institutions led 2025 spending with 40.68% revenue share, yet the healthcare vertical exhibits the strongest growth trajectory, expanding at a 13.68% CAGR. EU Directive 2013/55/EU obliges hospitals to maintain digital audit trails of continuing professional-development hours, incentivizing migration from paper logs to automated LMS compliance modules. Pharmaceutical sponsors overlay just-in-time training on Good Clinical Practice to keep trial teams aligned with evolving regulations.
Meanwhile, banks rely on learning management system (LMS) workflows to document anti-money-laundering refreshers, and manufacturers certify operators on ISO 9001 and OSHA protocols. Retailers deploy mobile micro-lessons that fit into shift breaks, issuing digital badges to boost engagement. The common denominator is an audit requirement that elevates the platform from optional to mission-critical, broadening the learning management system market reach across heavily regulated verticals.
Geography Analysis
North America retained the largest regional share at 36.52% in 2025. United States enterprises invest heavily in xAPI-compliant analytics that surface granular skill gaps, while Canadian government agencies prioritize bilingual delivery to meet PIPEDA privacy mandates. Mexico is emerging as a near-shore hub for implementation services, letting vendors extend North American support windows without incurring Silicon Valley salary costs.
Asia Pacific is the fastest-growing territory with a 12.88% CAGR, propelled by India’s PM eVIDYA 2.0 rollout and China’s mandate that state-owned enterprises certify smart-manufacturing competencies.[3]Ministry of Industry and Information Technology China, “Smart Manufacturing Certification Mandate,” miit.gov.cn Japan subsidizes corporate reskilling to offset workforce shrinkage, covering up to 70% of LMS licensing fees. Southeast Asian manufacturers adopt blockchain-verified credentials to accommodate high labor turnover, cementing the region as a growth engine for the learning management system (LMS) market.
Europe shows steady adoption, but fragmented data-protection statutes force vendors to maintain multiple data-residency zones. Nordic countries pilot competency-based education that relies on adaptive assessments, Germany digitizes apprenticeship tracking, and pan-European content consortia share course libraries to dilute development costs. Middle East investments center on mobile-first platforms with offline-sync, while Africa’s barrier remains last-mile connectivity. South America gains momentum as Brazil digitizes university curricula and Chile explores public-private licensing models that exchange anonymized analytics for platform discounts.

Regulatory Landscape
Regulation for learning management systems spans student and employee data privacy, accessibility, and sector-specific auditability requirements, which increasingly affect procurement eligibility in education and regulated industries. In the United States, K-12 deployments must align with student data privacy obligations such as Californias K-12 Pupil Online Personal Information Protection Act (BPC 22584), while multiple state frameworks govern digital and virtual learning operations, including Floridas statute section 1002.321 and Arkansas digital learning course rules (6 CAR 93-109). In Europe, accessibility requirements for ICT products and services under ETSI EN 301 549 influence public-sector tenders and push LMS vendors toward accessibility-by-design in authoring, assessments, and reporting workflows.
National standard-setting is also tightening platform requirements for distance learning. In China, implementation of GB/T 21644-2025 (general requirements for network distance learning platforms) commenced on May 1, 2026 under the national standards regime, raising the bar for platform-wide technical and service requirements in one of the largest digital education markets. In the Middle East, Saudi Arabias National eLearning Center (NELC) e-learning standards provide a formal reference for educational and training institutions, reinforcing the need for documented instructional quality, governance, and platform capabilities. Across geographies, cybersecurity frameworks such as ISO/IEC 27001 and NIST-aligned controls are increasingly used as de facto compliance gates in RFPs, particularly where cloud-first LMS deployments dominate and third-party integrations expand the attack surface.
Value Chain Analysis
The LMS value chain starts with core platform vendors that build SaaS and hybrid learning platforms, followed by adjacent technology contributors such as cloud infrastructure providers, identity and access management (SSO), analytics, and AI services that support personalization and workflow automation. Content and assessment providers (publishers, credentialing networks, and training organizations) extend platform utility through course libraries, micro-credentials, and proctoring. Implementation partners and managed-service providers then configure tenant environments, integrate HRIS, CRM, SIS, and collaboration tools, and support ongoing administration, aligning with the markets rising services demand as integrations and data-residency requirements expand.
Distribution and ecosystem scale increasingly depend on interoperability standards and partner marketplaces. Standards bodies such as 1EdTech (formerly IMS Global) support Learning Tools Interoperability (LTI) for secure tool-to-platform connectivity and OneRoster (including OneRoster 1.2) for roster and enrollment data exchange between SIS and LMS, making standards compliance a practical procurement requirement. Major LMS providers, including D2L, Instructure, and Anthology (Blackboard), run structured partner programs that certify integrations and create go-to-market paths for third-party applications, channel resellers, and service delivery partners. Bottlenecks tend to cluster around integration complexity, fragmented data models, and security review cycles, which increases the value of pre-built connectors, certified apps, and standards-based data exchange to reduce deployment time and lower long-term switching risk.
Competitive Landscape
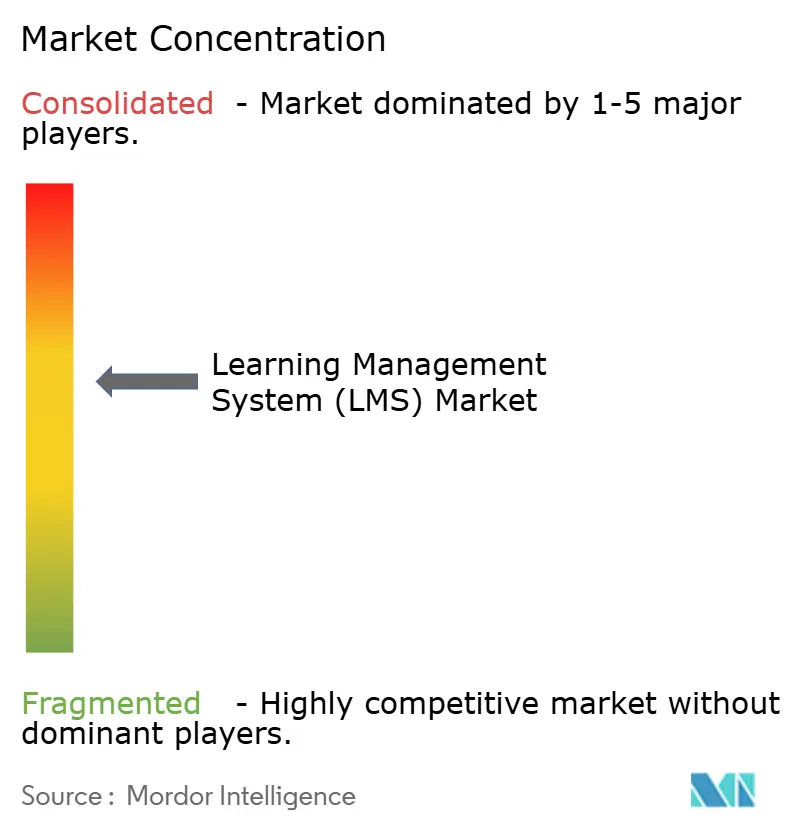
The top five vendors hold less than 40% combined revenue, leaving ample space for niche specialists in the learning management system (LMS) market. Cornerstone OnDemand, Anthology, and Instructure defend enterprise and education footprints by bundling vertical modules such as healthcare CPD trackers and K-12 parent portals. Challengers like Docebo and 360Learning leverage generative-AI authoring and collaborative workflows to poach mid-market accounts.
Technology integration defines the competitive battleground. Microsoft and Google exploit productivity-suite ubiquity to embed lightweight LMS capabilities at no incremental license fee, hindering standalone providers that cannot match bundle economics. Startups differentiate through blockchain credentialing, VR simulations, and pay-for-outcome pricing that shifts risk onto vendors. SAP’s 2025 patent for a dropout-prediction algorithm signals a future in which predictive analytics and real-time interventions become table stakes.
Strategic moves in 2025 include Anthology’s USD 180 million acquisition of Intellum to expand corporate reach, Oracle’s USD 320 million purchase of Skillsoft’s content catalog to create an integrated platform-plus-content bundle, and Cornerstone’s partnership with Credly for instant credential verification. These deals aim to lock in ecosystems that make switching costs prohibitive, yet the open-API movement ensures that best-of-breed integrations remain viable for buyers prioritizing flexibility.
Learning Management System (LMS) Industry Leaders
Cornerstone OnDemand, Inc.
D2L Corporation
IBM Corporation
McGraw-Hill Companies
Anthology Inc. (Blackboard)
- *Disclaimer: Major Players sorted in no particular order

Market Opportunities and Future Outlook
Public-sector platform modernization and governance frameworks create whitespace for vendors that can meet national or system-wide requirements while keeping interoperability intact. The March 2026 Charter for Public Digital Learning Platforms released by UNESCO, UNICEF, and ITU provides a governance and design reference point for public digital learning platforms, reinforcing demand for auditable administration, privacy-by-design, and transparent operational controls in ministry and agency procurements. In the United States, statewide and system-wide LMS sourcing also increases addressable deal sizes, exemplified by North Carolina Session Law 2025-62 directing the State Board of Community Colleges to solicit a unified LMS for all community colleges by December 31, 2025, with system transition targeted for completion by December 31, 2027.
A second opportunity zone is the shift from LMS as a course repository to an AI-enabled workflow layer that automates content creation, skills mapping, and compliance evidence collection. Utahs Statewide Online Education Program rules (R277-726), effective March 2026, mandate LMS-based evidence for student participation and financial compliance, supporting demand for stronger telemetry, attendance and participation proofs, and defensible reporting. On the commercial side, vendor productization of agentic and generative AI is moving quickly: Instructure launched IgniteAI Agent in March 2026 for Canvas workflows, and Docebo introduced AgentHub and Skills Intelligence in April 2026 to unify autonomous agents with skills mapping. These launches highlight buyer requirements for secure integrations (open APIs, LTI/OneRoster connectivity), explainable analytics, and outcome-linked administration, particularly in regulated verticals such as healthcare CPD where digital audit trails are mandatory.
Recent Industry Developments
- July 2026: D2L announced AI-enhanced content creation and personalized learning updates at its Fusion 2026 event, including new capabilities under D2L Lumi. The release bolsters competitive positioning in authoring and adaptive delivery, two areas where institutions look for measurable productivity gains alongside cloud-first deployments.
- December 2025: IBM and Pearson announced a collaboration to build new AI-powered learning tools for organizations and individuals. The partnership expands the pool of enterprise-grade AI learning assets that can be delivered through LMS and learning experience ecosystems, reinforcing integration requirements across platforms.
- July 2024: IBM introduced new SkillsBuild Cybersecurity and Data Analytics certificates to be deployed across multiple US community college systems. The rollout supports the shift toward skills-verification credentials and increases demand for LMS workflows that can administer programs, track completion, and produce auditable records at scale.


Research Methodology Framework and Report Scope
Market Definition and Coverage
The learning management system market is defined as revenue earned from software platforms used to create, deliver, manage, and track digital learning and training programs for academic, corporate, and public-sector users, across cloud and on-premise deployments.
Scope exclusions: We exclude stand-alone content authoring tools, custom in-house portals that are not sold commercially, and generic video meeting tools that do not function as an LMS.
Segmentation Overview
- By Component
- Solutions
- Services
- By Deployment Mode
- Cloud
- On-Premise
- By Delivery Mode
- Distance Learning
- Instructor-Led Training
- Blended Learning
- By Organization Size
- Large Enterprises
- Small and Medium Enterprises
- By End-User Vertical
- BFSI
- Healthcare and Pharmaceuticals
- Manufacturing
- Retail and Consumer Goods
- Educational Institutions
- Government Agencies
- Rest of End-User Verticals
- By Geography
- North America
- United States
- Canada
- Mexico
- Europe
- United Kingdom
- France
- Germany
- Nordics
- Rest of Europe
- Asia Pacific
- China
- India
- Japan
- South Korea
- Rest of Asia Pacific
- South America
- Brazil
- Mexico
- Rest of South America
- Middle East
- Gulf Cooperation Council Countries
- Turkey
- Rest of Middle East
- Africa
- South Africa
- Nigeria
- Rest of Africa
- North America
Data Sources, Market Sizing, and Validation
Desk Research
Desk work starts by mapping demand signals and adoption context that explain why LMS spending rises or slows. We typically review public education and workforce training indicators, such as data from the US Department of Education, UNESCO, OECD, and the World Bank, and then cross-check digital skills and e-learning adoption notes from sources such as ILO and national statistics offices.
To keep numbers grounded, supplier revenue disclosures are screened through annual reports, SEC filings, investor presentations, and reputable press coverage that discusses contract wins and product changes. Patent databases are also reviewed to understand the feature cycle (for example, AI-enabled course recommendations, analytics, and integrations), and a paid subscription for company financials and intelligence is used selectively when public splits are limited. The sources listed here are illustrative, and many other public references were used during data collection, validation, and clarification.
Primary Interviews and Surveys
Primary work focuses on validating what is actually being purchased and how pricing is evolving, because LMS contracts can look different by end user and deployment choice. We interview a mix of platform providers, implementation partners, and buyer-side training leaders across major regions, and then use those inputs to confirm adoption rates, renewal patterns, and realistic ASP ranges before final assumptions are set.
Distribution of primary research fieldwork respondents
| Company type | Respondent position | Region |
|---|---|---|
| Top tier: 38% | CXOs: 13% | APAC: 42% |
| Mid tier: 40% | Functional/Unit leaders: 37% | EMEA: 31% |
| Smaller Players: 22% | Managers: 50% | Americas: 27% |
Market-Sizing & Forecasting
Sizing starts with a top-down demand pool build that links total potential learners and training intensity to LMS adoption, then translates that demand into spend using typical subscription and support price structures. The model is corroborated with selective bottom-up approximations, such as sampled vendor revenue rollups, channel checks with implementation partners, and simple ASP times user-volume math for a few representative buyer cohorts.
A few of the inputs we rely on (illustrative) include corporate learning and development budgets, higher education enrollment and online course penetration, enterprise cloud migration pace, renewal and seat expansion behavior, and the share of buyers choosing integrated modules like analytics and content marketplaces. Where revenue splits are not clean, gaps are handled through conservative allocation rules that are pressure-tested in interviews and adjusted when regional adoption signals do not align. For forecasting, we use scenario analysis supported by trend smoothing, where growth paths are tied to drivers such as compliance training intensity, remote and hybrid work persistence, and procurement shifts toward multi-year subscriptions.
Data Validation & Update Cycle
Outputs are checked using triangulation across independent signals, including supplier revenue disclosures, buyer adoption feedback, and macro indicators that can explain volume changes. When a number looks off, the assumptions behind penetration, pricing, or regional weighting are reviewed again, and follow-up calls are triggered if the variance cannot be explained through publicly visible events.
Before sign-off, the model is reviewed in multiple steps by another analyst to catch unit issues, double counting, and unusual growth jumps. Reports refresh annually, with interim updates when material events occur, and a final pre-delivery review is completed so the latest public information is reflected for clients.
Mordor Intelligence's Learning Management System Market Estimate Compared With Other Published Estimates
Published LMS market values often differ because firms do not count the same revenue streams, and the timing of base years and currency conversions can also vary. Differences also show up when one estimate assumes faster enterprise seat expansion, or when services are treated as a large bundled add-on.
The main spread usually comes from what is treated as LMS revenue versus adjacent learning technology, and how subscription pricing is projected over time. Some estimates fold in stand-alone authoring tools, generic collaboration tools, or broader digital learning programs, and others apply aggressive growth scenarios from a short historical window. By separating commercially sold LMS platforms from adjacent tools and validating adoption and renewal patterns with buyer-side checks, the 2026 size of USD 30.51 B is kept tightly tied to the defined spend pool in Mordor Intelligence.
Benchmark comparison
| Source | Market Size | Gaps in Research Methodology |
|---|---|---|
| Mordor Intelligence | USD 30.51 B (2026) | |
| Global Consultancy A | USD 28.58 B (2025) | Uses an earlier base year and a broader segmentation lens without clearly stating exclusions for adjacent learning tools, which can shift what gets counted as core LMS revenue. |
| Industry Publisher B | USD 28.82 B (2025) | Reports a base-year total that appears to rely on wider end-user and delivery-mode groupings, and does not spell out treatment of non-LMS learning software and bundled services. |
Looking across the table, the differences are mostly explained by scope boundaries, base-year choice, and how attached services are treated in the total. Our approach keeps the total traceable to clear adoption and pricing assumptions, and it stays repeatable because each adjustment is tied back to observable buyer behavior and disclosed revenue signals.


Key Questions Answered in the Report
How large is the learning management system (LMS) market in 2026?
The learning management system market size reached USD 30.51 billion in 2026 and is on track for USD 54.86 billion by 2031 at a 12.45% CAGR.
Which deployment model is growing fastest in corporate training programs?
Cloud deployments are expanding at a 14.22% CAGR as enterprises favor elastic infrastructure and open APIs.
Why are healthcare organizations increasing LMS spending?
EU regulations mandate digital audit trails for continuing professional development, propelling healthcare LMS investments at a 13.68% CAGR.
What limits LMS adoption in rural Africa and South Asia?
Broadband penetration below 35% restricts delivery of video-heavy content, slowing uptake of immersive LMS features.
Which emerging technology most influences future LMS differentiation?
Generative AI that automates quiz creation, content summarization, and adaptive feedback is becoming a decisive feature in vendor selection.
Page last updated on:




