Continuing Education Market Size and Share
Market Overview
| Study Period | 2020 - 2031 |
|---|---|
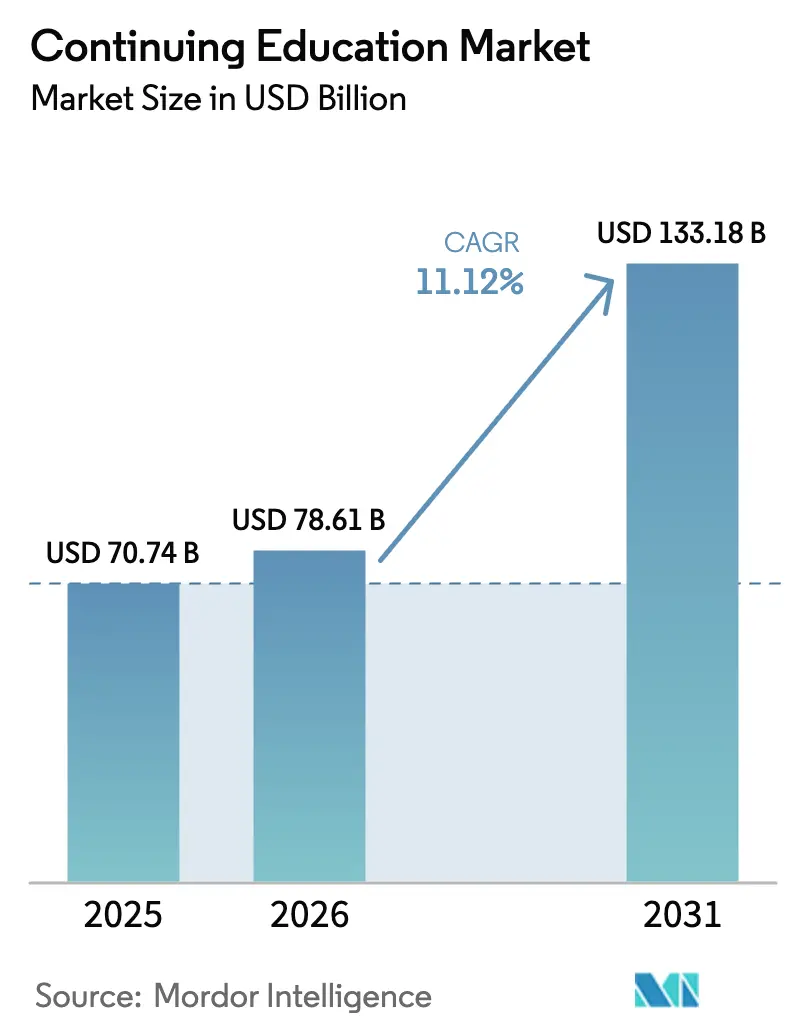
| Market Size (2026) | USD 78.61 Billion |
| Market Size (2031) | USD 133.18 Billion |
| Growth Rate (2026 - 2031) | 11.12% CAGR |
| Fastest Growing Market | Asia Pacific |
| Largest Market | North America |
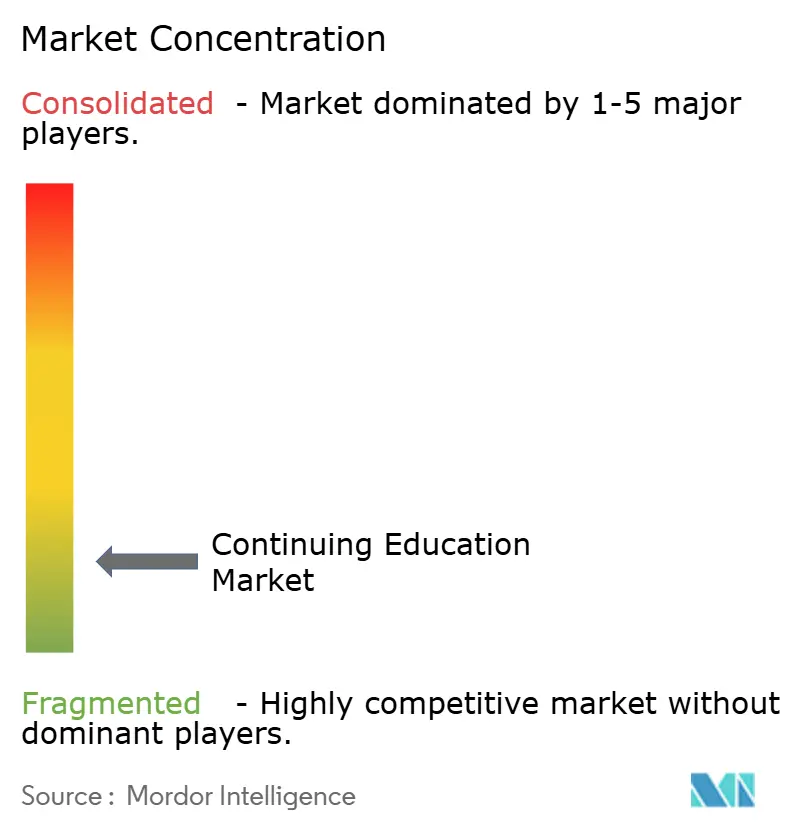
| Market Concentration | Low |
Major Players *Disclaimer: Major Players sorted in no particular order Image © Mordor Intelligence. Reuse requires attribution under CC BY 4.0. | |
Continuing Education Market Analysis by Mordor Intelligence
The continuing education market size is expected to grow from USD 70.74 billion in 2025 to USD 78.61 billion in 2026 and is forecast to reach USD 133.18 billion by 2031 at 11.12% CAGR over 2026-2031. Surging employer demand for verifiable, job-ready skills, rapid digitalisation of course delivery, and rising acceptance of micro-credentials are fuelling this expansion.[1]OECD, “Trends Shaping Education 2025,” oecd.orgEmployers now attach measurable wage and promotion benefits to reskilling, which increases both enrolment propensity and willingness to pay adpresearch.com. Technology platforms are capturing large learner cohorts through data-driven personalisation, under-pricing bricks-and-mortar institutions, and compressing time-to-competence. Public investment programmes in North America, Europe, and Asia-Pacific are injecting fresh capital into content development and regional delivery infrastructures, further catalysing the continuing education market trajectory.[2]U.S. Department of Commerce, “Good Jobs Challenge Funding,” commerce.gov
Key Report Takeaways
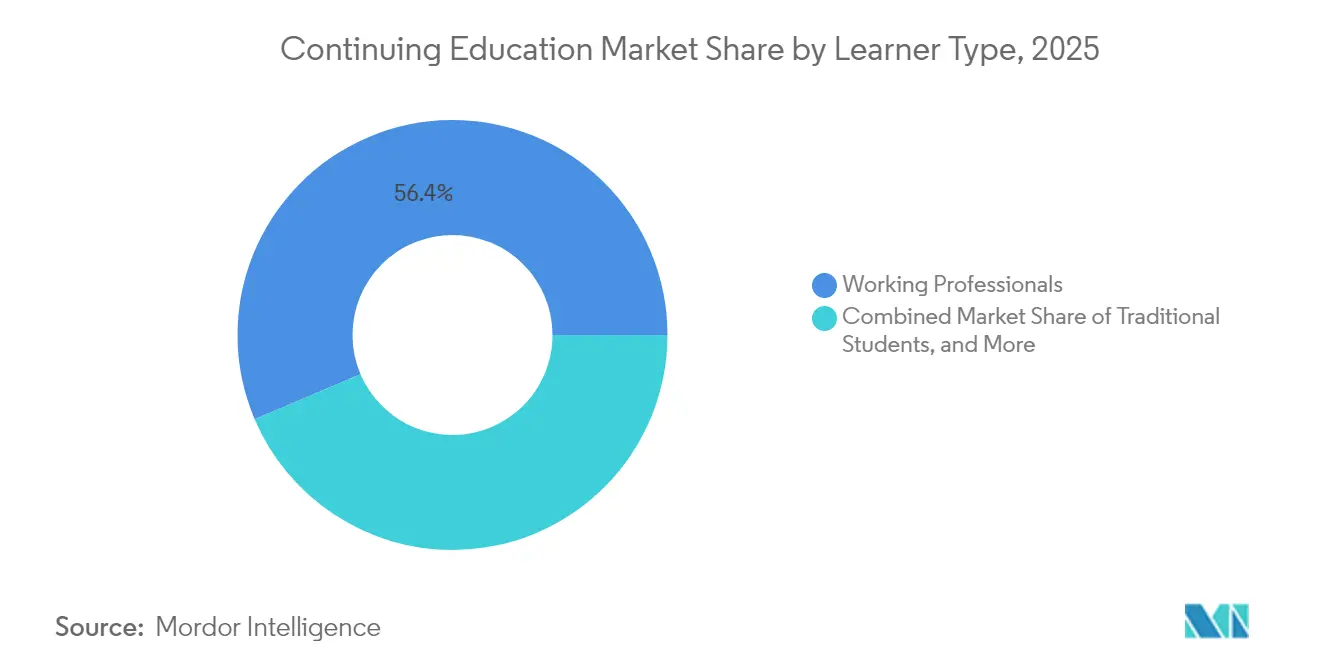
- By learner type, working professionals held 56.40% of continuing education market share in 2025; they are expanding at a 12.22% CAGR through 2031.
- By professional domain, IT & Engineering is projected to post the fastest 11.58% CAGR, while healthcare & life sciences retained 27.60% revenue share in 2025.
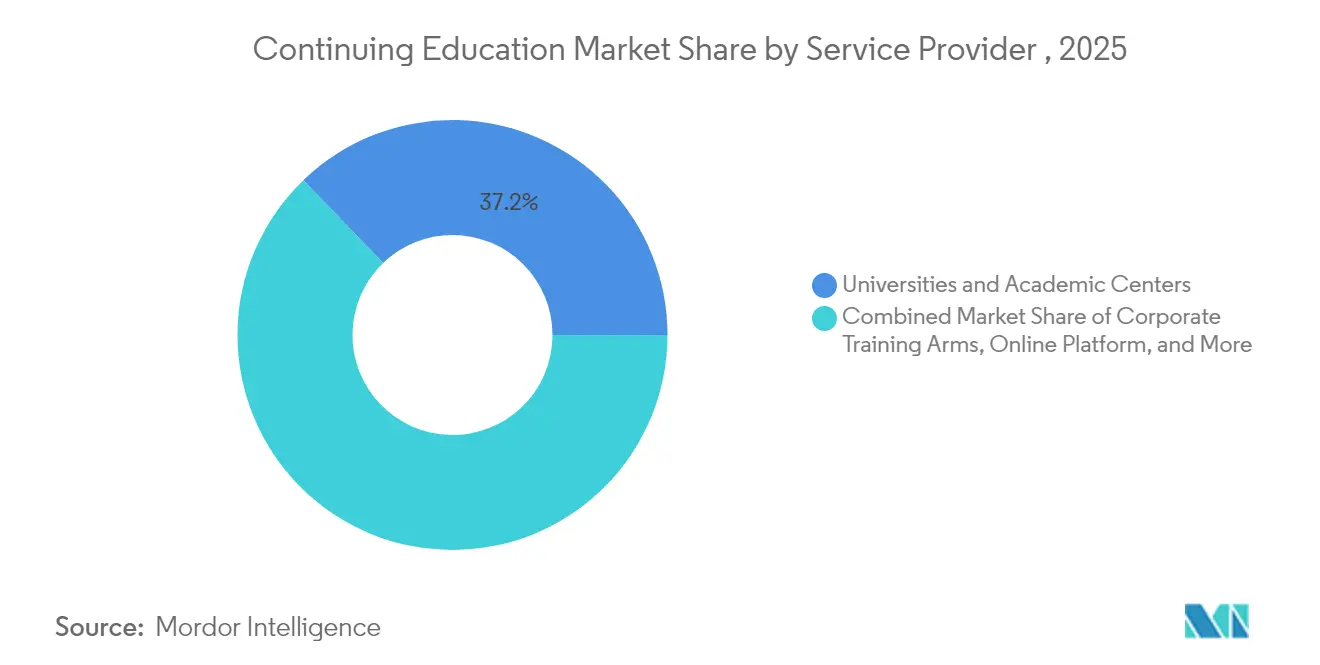
- By service provider, universities & academic centres controlled 37.20% of continuing education market size in 2025, yet dedicated online platforms are accelerating at a 12.31% CAGR.
- By delivery mode, online-asynchronous formats captured 45.30% of continuing education market size in 2025; online-synchronous formats are forecast to climb at an 11.33% CAGR.
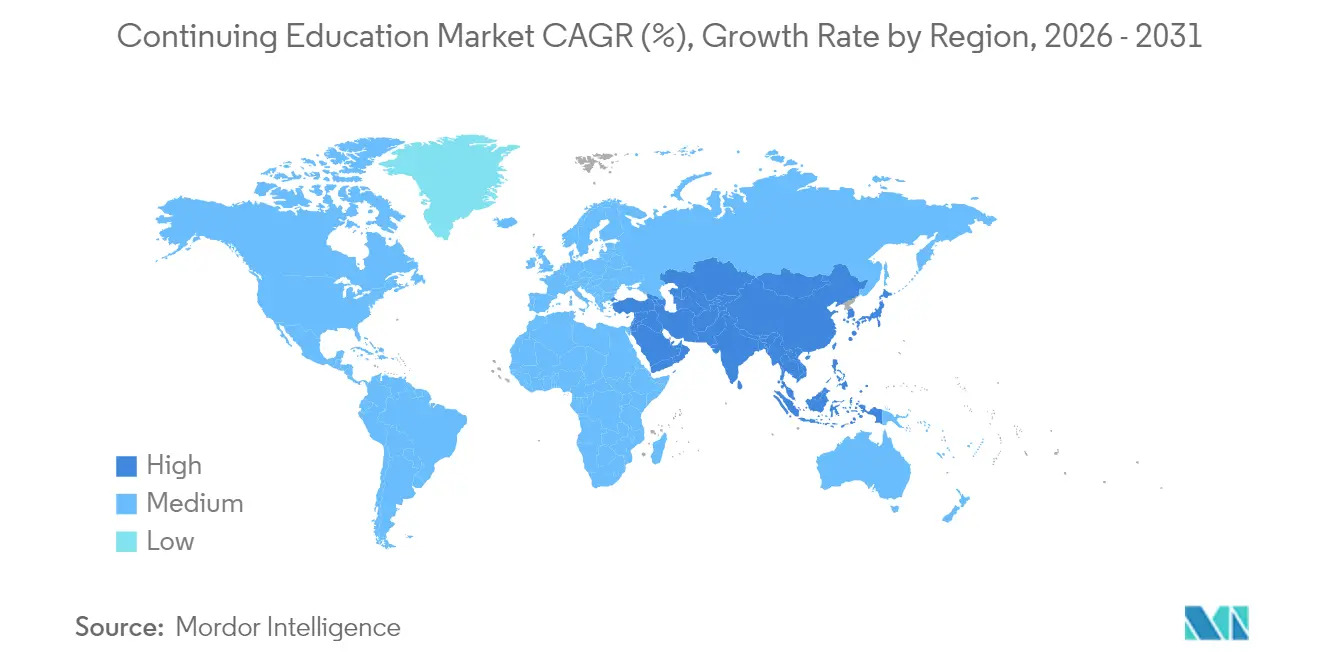
- By region, North America commanded 33.60% of continuing education market share in 2025, whereas Asia-Pacific is positioned for a 12.05% CAGR during 2026-2031.
Note: Market size and forecast figures in this report are generated using Mordor Intelligence’s proprietary estimation framework, updated with the latest available data and insights as of 2026.
Global Continuing Education Market Trends and Insights
Drivers Impact Analysis*
| Driver | (~) % Impact on CAGR Forecast | Geographic Relevance | Impact Timeline |
|---|---|---|---|
| Rapid employer-led upskilling demand | +3.5% | North America, Europe, global multinationals | Medium term (2-4 years) |
| Mandatory CEUs for licensure & compliance | +2.8% | North America, Europe, developed APAC | Long term (≥ 4 years) |
| Digital-first learning cost efficiencies | +2.1% | Global | Short term (≤ 2 years) |
| Government funding for workforce reskilling | +1.4% | North America, Europe, APAC | Medium term (2-4 years) |
| Micro-credential stacking for H-1B visas | +0.8% | North America, global talent flows | Medium term (2-4 years) |
| ISO-aligned skills taxonomies | +0.6% | Global manufacturing hubs | Long term (≥ 4 years) |
| Source: Mordor Intelligence | |||
Rapid employer-led upskilling demand
Firms are shifting budgets from hiring to training because AI-driven automation continuously resets required competencies. Organisations reporting comprehensive programmes realise 218% higher income per employee, and 92% of staff state that training lifts engagement.[3]Devlin Peck, “Employee Training Statistics 2025,” devlinpeck.com Personalised learning platforms curate modular paths that reduce time out of role, and talent teams treat credential data as an internal labour-market currency to match staff to growth roles.
Mandatory CEUs for licensure & compliance
Health, legal, and engineering regulators are raising minimum CEU thresholds. The American Speech-Language-Hearing Association mandates 30 hours every three years, while California behavioural-health professionals need 36 hours biennially, including telehealth content.[4]California BBS, “Continuing Education,” bbs.ca.govProviders monetise this predictable demand by offering subscription bundles that align curricula to statutory updates.
Government funding for workforce reskilling
Programmes such as the USD 25 million Good Jobs Challenge and Texas’s USD 6 million Upskill Texas initiative subsidise domain-specific short courses, raising enrolment volumes and de-risking provider expansion into underserved geographies.[5]Texas Workforce Commission, “Upskill Texas,” twc.texas.gov
ISO-aligned skills taxonomies adopted by OEMs
Manufacturers codify role requirements into international frameworks, creating clear signals for course developers and making cross-border credential portability feasible.
Restraints Impact Analysis*
| Restraint | (~) % Impact on CAGR Forecast | Geographic Relevance | Impact Timeline |
|---|---|---|---|
| Rising content piracy & credential fraud | -1.8% | Developing markets, global online platforms | Medium term (2-4 years) |
| High price sensitivity among adult learners | -1.2% | Emerging economies, price-elastic segments | Short term (≤ 2 years) |
| Declining ROI of revenue-share OPM contracts | -0.7% | North America, Europe | Short term (≤ 2 years) |
| Digital divide in blue-collar cohorts | -0.5% | Rural regions, developing economies | Long term (≥ 4 years) |
| Source: Mordor Intelligence | |||
Rising content piracy & credential fraud
Akamai estimates media piracy losses at USD 52 billion, with premium courseware increasingly targeted. Providers respond with blockchain verification layers and digital rights management, but compliance raises platform costs.
High price sensitivity among adult learners
Cost thwarted 40% of prospective learners from selecting their first-choice programme. To defend volume, vendors pilot income-share agreements, corporate sponsorship, and low-cost monthly passes.
*Our forecasts treat driver/restraint impacts as directional, not additive. The impact forecasts reflect baseline growth, mix effects, and variable interactions.
Segment Analysis
By Service Provider: Platform acceleration challenges academia
Dedicated online platforms are growing at a 12.31% CAGR, outpacing Universities & Academic centres that collectively held 37.20% continuing education market share in 2025. Aggressive content iteration cycles allow platforms to launch market-responsive micro-credentials weeks after skills emerge, whereas academic governance delays comparable updates. This agility attracts employers seeking just-in-time upskilling at scale, underpinning the rapid expansion of the continuing education market.
Universities counter by licensing adaptive-learning engines and embedding employer-validated rubrics into curricula, protecting brand equity while modernising format. Joint ventures with technology vendors reduce capital expenditure and enable cross-sell of stackable certificates that ladder into degree credit, sustaining relevance inside the continuing education market size debate.


By Delivery Mode: Synchronous engagement strengthens learning efficacy
Online-asynchronous formats captured 45.30% of continuing education market size in 2025 owing to flexibility and lower opportunity cost. However, synchronous virtual classrooms are accelerating at an 11.33% CAGR as improved bandwidth and rich-media tools narrow the engagement gap. Research shows synchronous cohorts reduce cognitive load and strengthen social presence, essential for behavioural and leadership skills.
Hybrid designs blend asynchronous knowledge transfer with live problem-solving, optimising cost without sacrificing interaction. Classroom-based delivery retains a niche for tactile competencies but faces share erosion as VR/AR simulations replicate hands-on practice.
By Learner Type: Working professionals anchor revenue pools
Working professionals accounted for 56.40% continuing education market share in 2025 and will expand fastest by 12.22% to 2031 as automation threatens mid-career job security. Employer-funded tuition assistance and learning wallets convert latent demand into paid enrolments. Traditional students increasingly co-enrol in short certificates to complement degrees, while lifelong learners represent a steady but smaller flow that stabilises margins during economic cycles.
Course developers segment working professionals by career stage—entry, mid, senior—to calibrate ROI narratives. Employers observe 76% higher retention when structured learning paths exist, reinforcing enterprise-level procurement of continuing education market offerings.
By Professional Domain: Healthcare dominance, IT velocity
Healthcare & life sciences held 27.60% revenue in 2025, supported by licensure mandates and constant clinical innovation. The segment benefits from simulation laboratories and VR clinical scenarios that lower practical-training costs, broadening global reach. IT & engineering, projected at an 11.58% CAGR, capitalises on cybersecurity and AI skill gaps that constrain digital-transformation roadmaps. Finance & accounting programmes absorb regulatory change, while legal & compliance track proliferating ESG and privacy statutes.
The healthcare education sub-sector alone could reach USD 36.8 billion by 2031, creating adjacency opportunities for cross-domain partnerships. Providers re-bundle content into credential stacks that satisfy both medical board renewal and adjacent digital-health roles, expanding ticket size and learner lifetime value.
Geography Analysis
North America commanded 33.60% continuing education market share in 2025. Stringent professional-licensing statutes and corporate adoption of pay-for-skills models drive above-average spend. Federal programmes, such as the USD 145 million H-1B One Workforce grants, subsidise high-skill training and validate micro-credentials for immigration pathways, signalling long-term policy support. Employers are simultaneously dropping degree prerequisites from 19% of job postings, expanding total addressable enrolments.
Asia-Pacific is the fastest-growing region, forecast at a 12.05% CAGR. Government-sponsored skilling missions, massive youth demographics, and mobile-first internet proliferation underpin demand. India’s national skilling framework and China’s industrial-upgrade policies fund sector-specific academies, while a 34.2% LMS CAGR signals rapid infrastructure build-out. Providers localise content and price points, often via freemium models that convert to paid certifications.
Europe maintains resilient demand through formal lifelong-learning directives and cross-border credential frameworks. Recognition of prior learning eases inter-state labour mobility, elevatin g the perceived value of portable micro-credentials. The Middle East and Africa leverage continuing education market programmes for economic-diversification goals, focusing on digital and renewable-energy skills. South America’s adoption curve is moderated by currency instability but stable broadband expansion supports steady online enrolments.

Competitive Landscape
The continuing education market is structurally fragmented with three strategic clusters: accredited universities, tech-centric platforms, and corporate academies. Universities monetise trust and regulatory alignment; platforms monetise speed-to-market and data analytics; corporate academies monetise domain specificity. M&A activity accelerated as incumbents purchase VR-simulation or AI-curriculum startups to fill capability gaps. Strategic partnerships dominate as Pearson collaborates with Mindstone to integrate generative-AI courses, lifting sales 5% and signalling content-plus-technology hybridisation.
Scale competitors differentiate via learner-outcome analytics. AI engines predict skill adjacencies, recommending next-best modules and securing repeat bookings. Barriers to entry include accreditation hurdles, employer endorsement cycles, and platform-technology capital outlays. White-space remains in domains where regulation lags skill innovation, notably green-hydrogen engineering and quantum-safe cryptography.
Future leadership will belong to firms unifying authoritative content, immersive delivery, and validated credentialing into seamless learner journeys. Continuous refresh of competency maps aligned with ISO taxonomies will be critical to defend positioning in the dynamic continuing education market.
Continuing Education Industry Leaders
Coursera Inc.
LinkedIn Learning (Microsoft)
Udemy Inc.
Pearson plc (incl. edX)
Skillsoft Corporation
- *Disclaimer: Major Players sorted in no particular order

Recent Industry Developments
- April 2025: Coursera expanded its healthcare portfolio with 15 specialised certificates, pursuing domain-adjacency growth and reinforcing enterprise healthcare foothold.
- March 2025: LinkedIn Learning deployed an AI skills-gap engine that recommends personalised learning paths, aimed at increasing platform stickiness and corporate contract renewals.
- February 2025: Pearson acquired a VR-education platform for USD 150 million, accelerating immersive-learning capabilities in clinical and engineering disciplines.
- December 2024: Udemy partnered with five global manufacturers to align technical courses with ISO skills taxonomies, locking in enterprise seat licences.
- October 2024: Skillsoft launched a stackable-credential platform to capture micro-credential demand and reduce learner churn.


Research Methodology Framework and Report Scope
Market Definitions and Key Coverage
Our study defines the continuing education market as all organized, fee-based learning programs pursued after the completion of formal schooling, including license renewal courses, professional certificates, micro-credentials, and short university extension offerings delivered on-campus or online. Programs aimed at basic literacy or K-12 catch-up are excluded.
(Scope exclusion: leisure hobby classes without credit or credential are outside this study.)
Segmentation Overview
- By Service Provider
- Universities and Academic Centers
- Corporate Training Arms (OEMs, Pharma, Tech)
- Dedicated Online Platforms
- Professional Associations
- Consultancies and Others
- By Delivery Mode
- Online - Synchronous
- Online - Asynchronous
- Hybrid / Blended
- Class-room Based
- By Learner Type
- Traditional Students (18-24)
- Working Professionals (25-54)
- Senior / Lifelong Learners (55+)
- By Professional Domain
- Healthcare and Life Sciences
- IT and Engineering
- Finance and Accounting
- Legal and Compliance
- Education and Teaching
- Others (Marketing, Logistics, etc.)
- By Geography
- North America
- United States
- Canada
- Mexico
- South America
- Brazil
- Argentina
- Rest of South America
- Europe
- United Kingdom
- Germany
- France
- Italy
- Spain
- Russia
- Rest of Europe
- APAC
- China
- Japan
- South Korea
- India
- Australia
- Rest of APAC
- Middle East and Africa
- GCC
- South Africa
- Rest of Middle East and Africa
- North America
Detailed Research Methodology and Data Validation
Primary Research
Mordor analysts interviewed university extension deans, corporate L&D directors, and certification-issuer associations across North America, Europe, and APAC. Dialogues clarified typical course pricing, renewal cycles, and dropout ratios; online surveys with working professionals validated willingness to pay and regional enrollment elasticity.
Desk Research
We began with wide sweeps of open data from UNESCO Institute for Statistics, OECD "Education at a Glance," U.S. National Center for Education Statistics, European Training Foundation, and trade bodies such as the International Council for Open and Distance Education. Company filings and investor decks for major platforms were mined through D&B Hoovers, while enrollment and tuition signals were tracked in Dow Jones Factiva news archives. Patent mining on Questel helped us spot emerging delivery technologies influencing cost curves. These sources illustrate; they do not exhaust the extensive secondary base reviewed.
Market-Sizing & Forecasting
A top-down model converts government expenditure, employer training budgets, and household education outlays into a continuing education spending pool, which is then split by delivery mode and region. Select bottom-up checks, sampled provider revenue roll-ups and average selling price times enrollment snapshots, refine totals. Key variables include average course fee, mandated CEU hours per profession, online penetration rate, corporate training spend as a share of payroll, and regional wage growth. Forecasts use multivariate regression blended with scenario analysis to reflect shifts in credential regulations and digital adoption, with expert consensus guiding assumption bands. Gaps in bottom-up granularity are bridged by calibrated enrollment-to-spend ratios confirmed through interviews.
Data Validation & Update Cycle
Outputs pass variance checks against historical series and fresh press release audits; anomalies trigger re-contacts. A senior reviewer signs off before publication. Reports refresh yearly, and material regulatory or macro shocks prompt interim tweaks so clients receive the latest view.
Why Our Continuing Education Baseline Deserves Trust
Published estimates often diverge because firms differ on course universe, geographic roll-ups, and refresh cadence.
We anchor our baseline on transparent scope choices and live primary feedback, which keeps our 2025 value balanced. Key gap drivers versus other studies include their omission of employer-funded micro-credentials, older base years, and limited probing of pricing dispersion.
Benchmark comparison
| Market Size | Anonymized source | Primary gap driver |
|---|---|---|
| USD 70.74 B (2025) | Mordor Intelligence | - |
| USD 50.00 B (2023) | Global Consultancy A | Narrower course catalog and two-year-old base, minimal primary checks |
| USD 36.60 B (2023) | Industry Tracker B | Excludes corporate micro-credentials, blends in higher-ed tuition deflators |
| USD 66.91 B (2024) | Regional Consultancy C | Single-country figure extrapolated informally to hint at global scale |
The comparison shows that when scope, timing, and variable rigor are normalized, Mordor's disciplined mix of up-to-date data points and dual-path validation yields the most dependable baseline for strategic planning.


Key Questions Answered in the Report
What is the current size of the continuing education market?
The continuing education market is valued at USD 78.61 billion in 2026 and is projected to reach USD 133.18 billion by 2031.
Which learner segment generates the most revenue?
Working professionals account for 56.40% of continuing education market share in 2025 and remain the primary revenue driver.
Which region is growing the fastest?
Asia-Pacific is forecast to grow at a 12.05% CAGR between 2026 and 2031, powered by large youth populations and government-funded skilling initiatives.
What delivery mode is expanding quickest?
Online synchronous learning is the fastest-growing mode, advancing at an 11.33% CAGR as technology enhances live engagement quality.
How are employers influencing market demand?
Employers increasingly fund upskilling because comprehensive training boosts income per employee and retention, while micro-credential acceptance for visa qualifications widens the talent pool.
Why are micro-credentials important?
Micro-credentials offer targeted, stackable qualifications that align closely with job-specific skills, providing faster ROI for learners and clearer competency signals for employers.
Page last updated on:


