High Frequency Trading Server Market Size and Share
Market Overview
| Study Period | 2020 - 2031 |
|---|---|
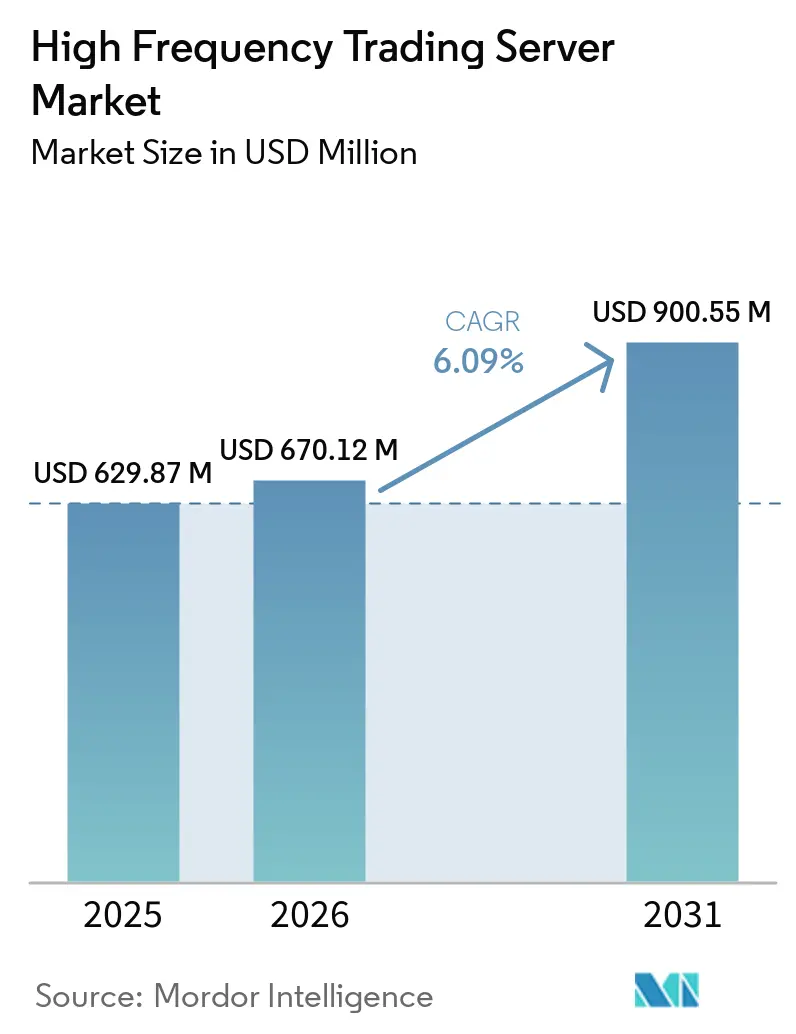
| Market Size (2026) | USD 670.12 Million |
| Market Size (2031) | USD 900.55 Million |
| Growth Rate (2026 - 2031) | 6.09% CAGR |
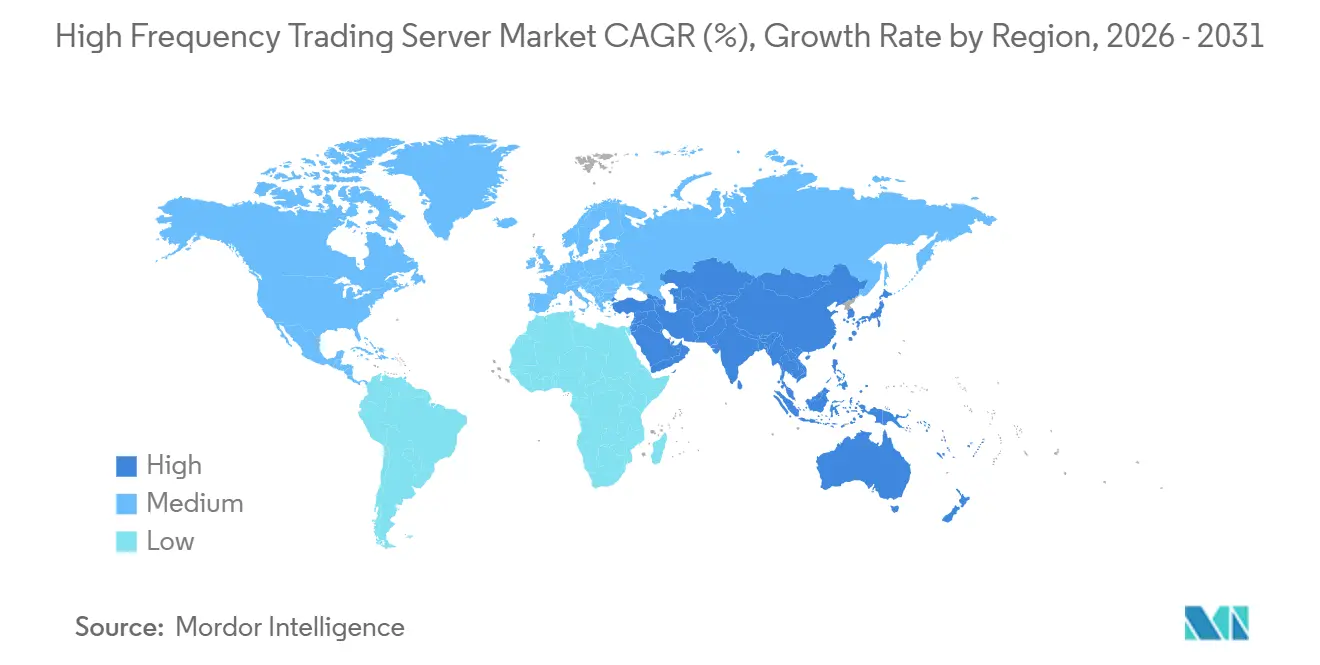
| Fastest Growing Market | Asia Pacific |
| Largest Market | North America |
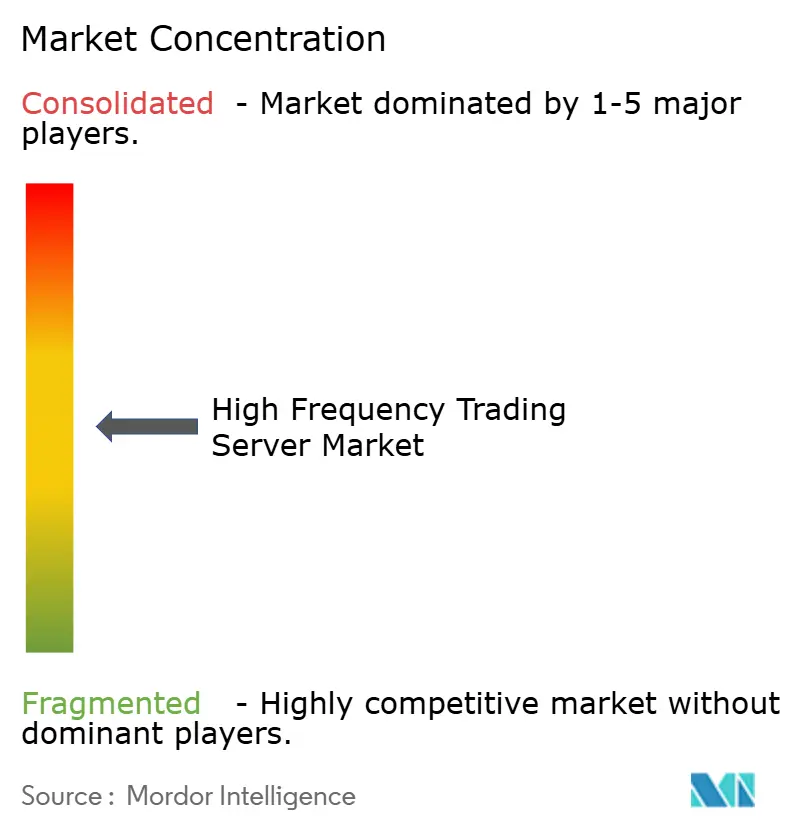
| Market Concentration | Medium |
Major Players *Disclaimer: Major Players sorted in no particular order Image © Mordor Intelligence. Reuse requires attribution under CC BY 4.0. | |
High Frequency Trading Server Market Analysis by Mordor Intelligence
The high frequency trading server market size was valued at USD 629.87 million in 2025 and estimated to grow from USD 670.12 million in 2026 to reach USD 900.55 million by 2031, at a CAGR of 6.09% during the forecast period (2026-2031). The expansion is supported by the migration of quantitative strategies from cloud to exchange-adjacent cages, the rollout of 100-gigabit and 400-gigabit fabrics, and processor diversification that marries x86 incumbents with ARM and FPGA hybrids. Vendor roadmaps now place liquid-cooling and sub-microsecond precision time protocol as base design criteria, while exchange operators monetize new colocation halls that support 17-kilowatt cabinet densities. The regulatory environment tightens around algorithmic throttling and carbon disclosure, yet these mandates often favor on-premises compute that can execute compliance logic in microseconds. Supply-chain friction for FPGA and NIC silicon remains the only near-term brake on shipments, setting a floor under average selling prices for optimized servers.
Key Report Takeaways
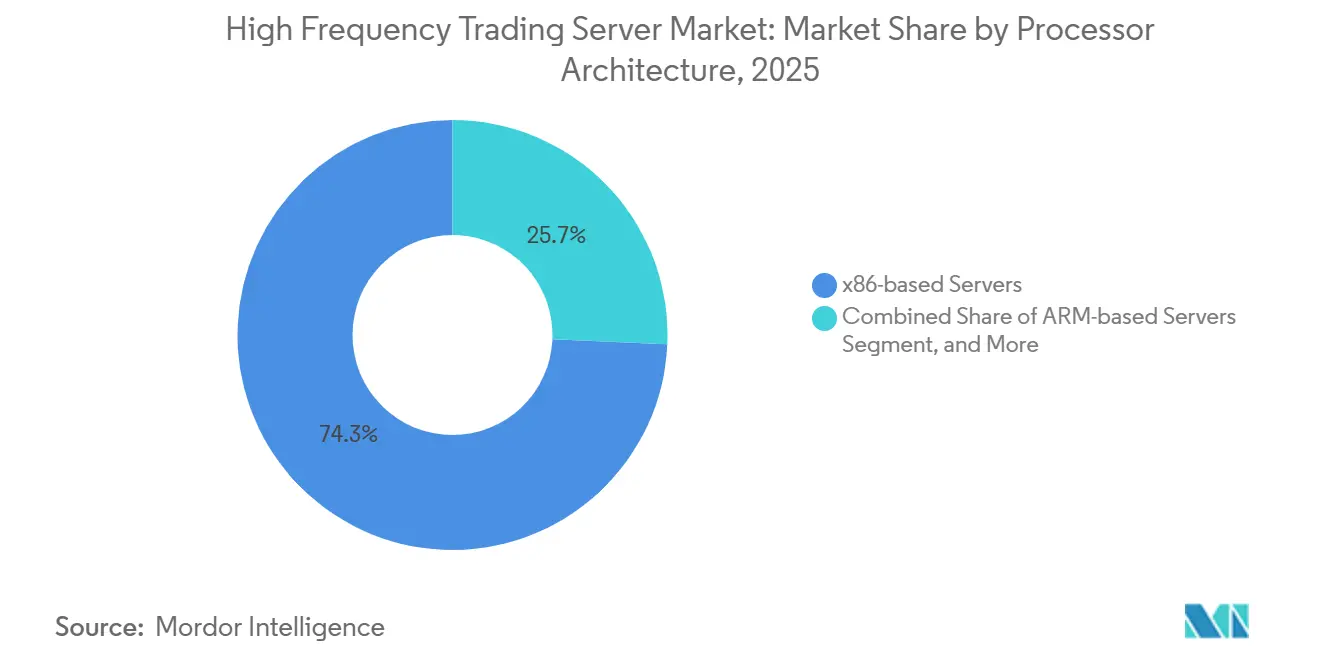
- By processor architecture, x86-based platforms led with 74.32% of high frequency trading server market share in 2025, while ARM-based servers are poised to record the strongest 8.43% CAGR through 2031.
- By form factor, rack servers commanded 63.47% of the high frequency trading server market in 2025, whereas blade servers represent the fastest-growing form factor with a 7.84% CAGR to 2031.
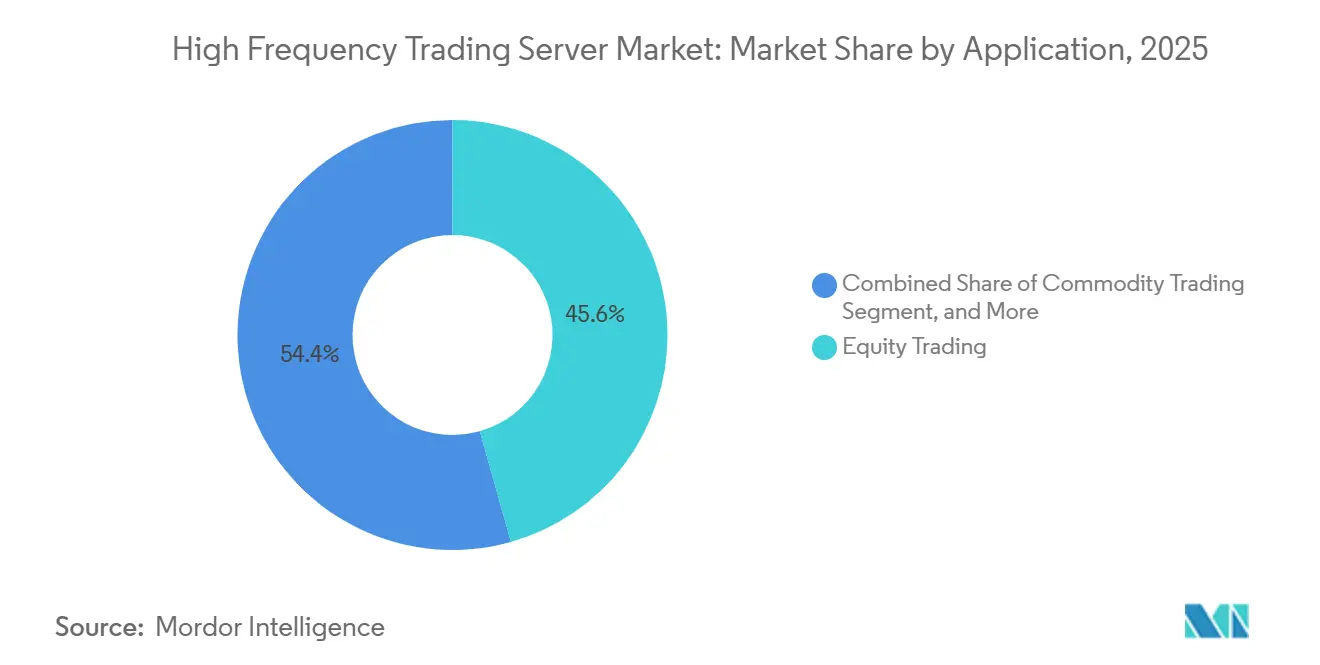
- By application, equity trading generated 45.62% of revenue in 2025, but derivatives and cryptoassets are set to advance at a 7.47% CAGR through 2031.
- By end-user, investment banks and brokerage houses held 39.48% of demand in 2025, and hedge funds, together with asset managers, will post the highest 7.69% CAGR through 2031.
- By geography, North America captured 36.51% share in 2025, while Asia-Pacific will grow fastest at a 7.58% CAGR during 2026-2031.
Note: Market size and forecast figures in this report are generated using Mordor Intelligence’s proprietary estimation framework, updated with the latest available data and insights as of January 2026.
Global High Frequency Trading Server Market Trends and Insights
Drivers Impact Analysis*
| Driver | (~) % Impact on CAGR Forecast | Geographic Relevance | Impact Timeline |
|---|---|---|---|
| Surge in Algorithmic and AI-Driven Trading Volumes | +1.8% | Global, concentration in North America and Europe | Medium term (2-4 years) |
| Demand for Ultra-Low-Latency Infrastructure | +1.5% | North America, Europe, Asia-Pacific core exchanges | Short term (≤ 2 years) |
| Expansion of Cryptocurrency and Digital-Asset Exchanges | +1.2% | Asia-Pacific, Middle East, selective North America | Long term (≥ 4 years) |
| Evolution of x86 Multi-Core and FPGA-Accelerated Processors | +0.9% | Global | Medium term (2-4 years) |
| Edge Colocation in Emerging Financial Hubs | +0.7% | Asia-Pacific, Middle East and Africa | Long term (≥ 4 years) |
| Microwave and Free-Space Optical Links Co-Optimizing Servers | +0.5% | Europe, North America inter-exchange corridors | Medium term (2-4 years) |
| Source: Mordor Intelligence | |||
Surge in Algorithmic and AI-Driven Trading Volumes
Algorithmic execution accounts for more than 70% of equity order flow in developed venues, and reinforcement-learning agents are now being embedded directly into FPGA fabric to shave nanoseconds off tick-to-trade cycles. The European Securities and Markets Authority guidance issued in February 2026 requires microsecond-level pre-trade checks that favor on-premises compute over cloud endpoints.[1]European Securities and Markets Authority, “Algorithmic Trading-ESMA Briefing,” ESMA, esma.europa.eu Quantitative funds managing more than USD 10 billion in assets deploy inference-capable servers next to exchange engines, converting microsecond gains into multi-million-dollar slippage savings. Memory-bandwidth demands widen, accelerating the adoption of ARM designs such as NVIDIA Grace that deliver 1 terabyte per second of coherent bandwidth. The result is a structural lift in unit shipments of heterogeneous servers across major colocation hubs.
Demand for Ultra-Low-Latency Infrastructure
Exchange proximity hosts are upgrading from 10-gigabit to 400-gigabit Ethernet, compressing round-trip times to sub-microsecond territory and setting new floor specifications for network interface cards. Kraken opened a London cage at Equinix LD5 in April 2026 that delivers sub-millisecond access to European venues, drawing crypto market makers that require deterministic flows. CME Aurora added 428,000 square feet of raised floor in partnership with Google Cloud, providing 17-kilowatt cabinets that accommodate dual-socket blade nodes and FPGA accelerators. Kernel-bypass stacks such as DPDK and RDMA are now mandatory features on trading NICs, further intertwining server design with network topology.
Expansion of Cryptocurrency and Digital-Asset Exchanges
Digital-asset venues are commissioning purpose-built colocation halls that support perpetual futures and tokenized options. XTX Markets invested EUR 1 billion (USD 1.13 billion) in a Finnish data center in January 2025 to secure sub-5 millisecond access to Nordic crypto exchanges. Pyxora Labs earmarked USD 800 million for a California facility scheduled for Q4 2026, citing 30% lower power use from ARM-based racks. Regulatory frameworks such as the Markets in Crypto-Assets Regulation in the European Union favor institutional colocation over retail cloud hosting, channeling capital to high-density, green-powered data centers.
Evolution of x86 Multi-core and FPGA-accelerated Processors
Intel Xeon 6 and AMD EPYC 9005 lines now integrate up to 128 cores per socket with PCIe Gen5 lanes for direct FPGA attachment. AMD Alveo UL3524 cards achieve sub-3-nanosecond deterministic latency, a benchmark for tick-to-trade pipelines. Supermicro’s 40-node MicroBlade chassis launched in March 2026 trims per-trade energy by 25% through dynamic voltage-frequency scaling. NVIDIA’s GH200 Grace Hopper Superchip posts 4.6 microsecond LSTM inference on STAC-ML, proving GPU-assisted sentiment analysis can coexist with deterministic trading paths. Heterogeneous compute fabrics are now mainstream in server procurement for proprietary desks.
Restraints Impact Analysis*
| Restraint | (~) % Impact on CAGR Forecast | Geographic Relevance | Impact Timeline |
|---|---|---|---|
| High CAPEX for Colocation and Specialized Cooling | -1.2% | Global, acute in North America and Europe | Short term (≤ 2 years) |
| Rising Regulatory Scrutiny and Speed-Bump Initiatives | -0.9% | Europe, North America, selective Asia-Pacific | Medium term (2-4 years) |
| Supply-Chain Constraints for NIC/FPGA Components | -0.6% | Global | Short term (≤ 2 years) |
| Carbon-Intensity Reporting Limiting Ultra-Dense Halls | -0.4% | Europe, North America | Long term (≥ 4 years) |
| Source: Mordor Intelligence | |||
High CAPEX for Colocation and Specialized Cooling
Tier-1 exchange-adjacent cabinets range from USD 6,000 to USD 9,600 per month for 10-gigabit connectivity, and premium cages attract USD 15,000 monthly, pushing annual spend beyond USD 150,000 per rack after cross-connects. Liquid-cooling upgrades add USD 50,000-100,000 upfront, forcing mid-tier hedge funds to weigh latency gains against budget limits. Legacy halls lacking chilled-water loops cannot retrofit high-density blades, driving migrations to new builds and elongating payback periods. Some firms downshift to virtual private servers, trading 20 microseconds of latency for monthly bills under USD 2,000, fragmenting demand for cutting-edge hardware.
Rising Regulatory Scrutiny and Speed-Bump Initiatives
ESMA’s February 2026 update mandates order-cancellation ratios and microsecond-level audit trails, prompting some makers to prioritize compliance middleware over raw speed. U.S. SEC climate disclosure rules proposed in March 2024 extend carbon reporting to colocation halls, shifting focus toward power-usage-effectiveness over cabinet density.[2]U.S. Securities and Exchange Commission, “SEC Climate Disclosure Rules,” SEC, sec.gov Certain equity venues have added 350-microsecond speed bumps, neutralizing sub-microsecond hardware investment for those markets. Europe’s Digital Operational Resilience Act, effective January 2025, layers stress testing and incident reporting, inflating operating overhead for latency-sensitive desks.
*Our forecasts treat driver/restraint impacts as directional, not additive. The impact forecasts reflect baseline growth, mix effects, and variable interactions.
Segment Analysis
By Processor Architecture: ARM Gains Traction in Power-Constrained Venues
ARM-based servers logged the fastest 8.43% CAGR forecast for 2026-2031 as firms prioritize energy efficiency and memory bandwidth. NVIDIA Grace CPUs with 72 Arm Neoverse V2 cores and 1 terabyte per second of bandwidth shipped in 2025, enabling real-time risk simulations that once demanded dual-socket x86 rigs. x86 systems still dominated with 74.32% of high frequency trading server market share in 2025, underpinned by decades of compiled trading logic optimized for Intel and AMD microcode.
The power-density edge for ARM is frequently 30-40%, a benefit that aligns with colocation operators chasing revenue per kilowatt. Recompilation hurdles and limited ARM-native FPGA tooling slow migration for smaller firms, yet partnerships such as Fujitsu-Arrcus-1Finity in March 2026 reveal growing confidence in ARM designs for next-generation cages.


By Form Factor: Blade Servers Capture Density-Driven Deployments
Blade servers are projected to expand at 7.84% CAGR to 2031, eclipsing rack systems in new builds. Cisco’s UCS XE9305 chassis hosts 16 dual-socket nodes in 10U, eliminating top-of-rack switch latency and maximizing compute per square foot. Rack servers maintained 63.47% share of the high-frequency trading server market in 2025, reflecting their flexibility in retrofitting sites with lower power envelopes.
Liquid-cooling-ready blade chassis sustain 17-kilowatt cabinets without disruptive retrofits, an advantage as exchange hosts lift density ceilings. Supermicro’s March 2026 40-node MicroBlade reduced per-node footprint by 50%, underscoring the economic pressure on square footage.[3]Super Micro Computer Inc., “Supermicro Showcases Latest AI and Liquid Cooling Solutions,” Supermicro, supermicro.com Retrofit constraints will preserve rack prevalence, but greenfield deployments increasingly default to blade.
By Application: Derivatives and Cryptoassets Lead Growth Trajectory
Derivatives and cryptoassets are on track for a 7.47% CAGR through 2031, outperforming all other applications. CME Group’s Aurora expansion targets Bitcoin and Ethereum market makers, underlining the 24/7 volatility that feeds hardware demand. Equity trading, though still the largest slice at 45.62% of 2025 revenue, grows modestly as the segment approaches electronic saturation.
Perpetual-futures platforms and decentralized-exchange arbitrage generate message rates above 1 million per second during volatility spikes, necessitating always-on clusters that stretch server duty cycles. Foreign-exchange and commodity venues lag in colocation modernization, limiting unit shipments into those verticals for the forecast horizon.
By End-User: Hedge Funds Accelerate Infrastructure Investments
Hedge funds and asset managers are set to achieve a rapid 7.69% CAGR by 2031, as they transition their quantitative portfolios from cloud backtesting to edge execution. This growth is driven by increasing adoption of advanced analytics and machine learning in portfolio management. While investment banks and brokerage houses accounted for 39.48% of the 2025 demand, they grapple with balance-sheet and capital-rule constraints, limiting their incremental spending.
Proprietary trading desks typically allocate over USD 500,000 in server budgets for every 50 staff members, a spending ratio that other segments can't match. In 2025, Quantitative Research Technologies established a hub in Iceland, capitalizing on the region's geothermal energy and its proximity to trans-Atlantic cables. This move underscores the innovative approach hedge funds take in choosing colocation sites. Unlike hedge funds, which drive vendor pipelines, exchanges tend to refresh their infrastructure on longer cycles.
Geography Analysis
North America anchored 36.51% of the high frequency trading server market in 2025, supported by CME Aurora, NYSE Mahwah, and Nasdaq Carteret. CME’s partnership with Google Cloud delivered 428,000 square feet of additional raised floor, enabling 17-kilowatt cabinets that favor blade and FPGA hybrids. ICE Mahwah reached Tier 4 redundancy with 28 megawatts and sub-1 microsecond precision time protocol in January 2026, cementing a benchmark others emulate.
Asia-Pacific is projected to log a 7.58% CAGR over 2026-2031, the fastest regional climb. Equinix HK6, opening in 2026, positions Hong Kong as a cross-border arbitrage hub linking mainland exchanges. Japan Exchange Group and Korea Exchange rolled out 100-gigabit Ethernet cages, drawing regional proprietary firms. Singapore Exchange continues to offer deterministic access, yet India’s National Stock Exchange introduced randomized delays that temper high-frequency incentives.
Europe, the Middle East, and Africa show divergent trends. Eurex Frankfurt and Euronext Amsterdam sustain steady demand, with Eurex charging EUR 6,000-9,600 (USD 6,780-10,848) per cabinet each month. Euronext’s July 2024 microwave network lowered London-Bergamo latency below 4 milliseconds, aligning with server placements that exploit fiber bypass. Middle Eastern sovereign wealth funds fund nascent digital-asset exchanges, while South America remains in early adoption, limited to B3 São Paulo colocation offerings.

Competitive Landscape
The high frequency trading server market is moderately fragmented; the top five suppliers hold about 50-55% combined revenue. Dell Technologies, Hewlett Packard Enterprise, and Super Micro Computer dominate the rack and blade categories, while Lenovo and IBM serve legacy AIX users. Specialized entrants like Silicom and Penguin Computing bundle kernel-bypass NICs and FPGA cards into turnkey appliances, eroding incumbent share.
Strategic convergence centers on three pillars: processor diversification into ARM and FPGA hybrids, liquid-cooling integration for 17-kilowatt cabinets, and edge-colocation pacts that plant compute inside exchange cages. Fujitsu’s March 2026 adoption of MONAKA ARM CPUs with Arrcus network software exemplifies this pivot. Supply-chain tightness in FPGA silicon empowers vendors with long-term wafer contracts, tilting share toward those with secured allocations.
Regional original design manufacturers, including Quanta and Wistron, cultivate Asia-Pacific hedge-fund customers that demand bespoke chassis. Cisco’s UCS XE9305 removes top-of-rack switch latency, a micro-optimization that resonates with market makers.[4]Cisco Systems Inc., “Cisco UCS XE9305 Chassis,” Cisco, cisco.com Supermicro’s FlexTwin leverages direct-to-chip cold plates, slicing thermal resistance by 40% versus air. The result is a landscape where innovation in thermals, interconnect, and heterogeneous compute decides account wins.
High Frequency Trading Server Industry Leaders
Dell Technologies Inc.
Hewlett Packard Enterprise Company
Super Micro Computer, Inc.
Lenovo Group Limited
International Business Machines Corporation
- *Disclaimer: Major Players sorted in no particular order

Recent Industry Developments
- April 2026: Kraken inaugurated a London colocation facility at Equinix LD5, offering sub-millisecond links to major European crypto and derivatives venues.
- March 2026: Pyxora Labs announced a USD 800 million California data center for ARM-optimized trading racks, with go-live in Q4 2026.
- March 2026: Fujitsu partnered with Arrcus and 1Finity to roll out MONAKA ARM CPUs in a multi-exchange AI trading infrastructure.
- October 2025: Lenovo introduced the ThinkSystem SR675 V3 with liquid-cooled AMD EPYC 9005 processors for 17-kilowatt cabinets


Global High Frequency Trading Server Market Report Scope
| x86-based Servers |
| ARM-based Servers |
| Other Processor Architectures |
| Rack Servers |
| Blade Servers |
| Tower Servers |
| Micro Servers |
| Equity Trading |
| Foreign Exchange (Forex) |
| Commodity Trading |
| Derivatives and Cryptoassets |
| Proprietary Trading Firms and Market Makers |
| Investment Banks and Brokerage Houses |
| Hedge Funds and Asset Managers |
| Stock and Derivatives Exchanges |
| Ancillary Systems (CRM, Treasury, HR) |
| North America | United States | |
| Canada | ||
| Mexico | ||
| South America | Brazil | |
| Argentina | ||
| Rest of South America | ||
| Europe | Germany | |
| United Kingdom | ||
| France | ||
| Italy | ||
| Spain | ||
| Rest of Europe | ||
| Asia-Pacific | China | |
| Japan | ||
| India | ||
| South Korea | ||
| ASEAN | ||
| Rest of Asia-Pacific | ||
| Middle East and Africa | Middle East | Saudi Arabia |
| United Arab Emirates | ||
| Turkey | ||
| Rest of the Middle East | ||
| Africa | South Africa | |
| Nigeria | ||
| Rest of Africa | ||
| By Processor Architecture | x86-based Servers | ||
| ARM-based Servers | |||
| Other Processor Architectures | |||
| By Form Factor | Rack Servers | ||
| Blade Servers | |||
| Tower Servers | |||
| Micro Servers | |||
| By Application | Equity Trading | ||
| Foreign Exchange (Forex) | |||
| Commodity Trading | |||
| Derivatives and Cryptoassets | |||
| By End-User | Proprietary Trading Firms and Market Makers | ||
| Investment Banks and Brokerage Houses | |||
| Hedge Funds and Asset Managers | |||
| Stock and Derivatives Exchanges | |||
| Ancillary Systems (CRM, Treasury, HR) | |||
| By Geography | North America | United States | |
| Canada | |||
| Mexico | |||
| South America | Brazil | ||
| Argentina | |||
| Rest of South America | |||
| Europe | Germany | ||
| United Kingdom | |||
| France | |||
| Italy | |||
| Spain | |||
| Rest of Europe | |||
| Asia-Pacific | China | ||
| Japan | |||
| India | |||
| South Korea | |||
| ASEAN | |||
| Rest of Asia-Pacific | |||
| Middle East and Africa | Middle East | Saudi Arabia | |
| United Arab Emirates | |||
| Turkey | |||
| Rest of the Middle East | |||
| Africa | South Africa | ||
| Nigeria | |||
| Rest of Africa | |||


Key Questions Answered in the Report
What is the current and forecast high frequency trading server market size?
The high frequency trading server market size is USD 670.12 million in 2026 and is projected to reach USD 900.55 million by 2031 at a 6.09% CAGR.
Which processor architecture is growing the fastest in high frequency trading servers?
ARM-based servers show the strongest momentum, with an expected 8.43% CAGR between 2026-2031 as firms pursue superior performance-per-watt ratios and coherent memory bandwidth.
Which form factor is most likely to replace traditional rack deployments?
Blade servers are forecast to outpace rack systems, expanding at a 7.84% CAGR through 2031 because they maximize compute density inside power-constrained exchange cages.
How are regulatory changes influencing server investments?
New rules that mandate microsecond-level audit trails and carbon reporting push firms toward on-premises compute that integrates compliance logic while limiting ultra-dense deployments in legacy halls.
Which region will contribute the highest incremental growth to the market?
Asia-Pacific leads growth with a projected 7.58% CAGR to 2031, supported by Equinix HK6, Singapore Exchange upgrades, and expanding cryptoasset venues.
What strategies are vendors using to gain competitive advantage?
Suppliers focus on heterogeneous compute that blends x86, ARM, and FPGA, integrate liquid-cooling for 17 kilowatt cabinets, and form edge-colocation partnerships that embed servers inside exchange cages.
Page last updated on:


