Enterprise Server Market Size and Share
Market Overview
| Study Period | 2020 - 2031 |
|---|---|
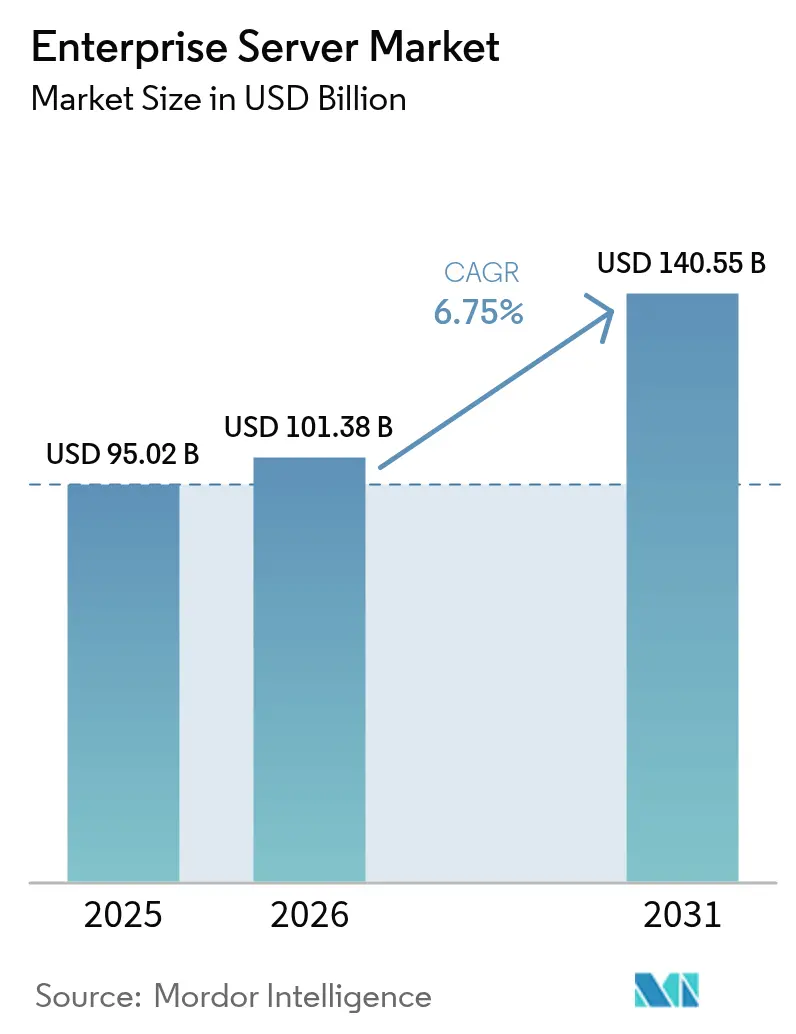
| Market Size (2026) | USD 101.38 Billion |
| Market Size (2031) | USD 140.55 Billion |
| Growth Rate (2026 - 2031) | 6.75% CAGR |
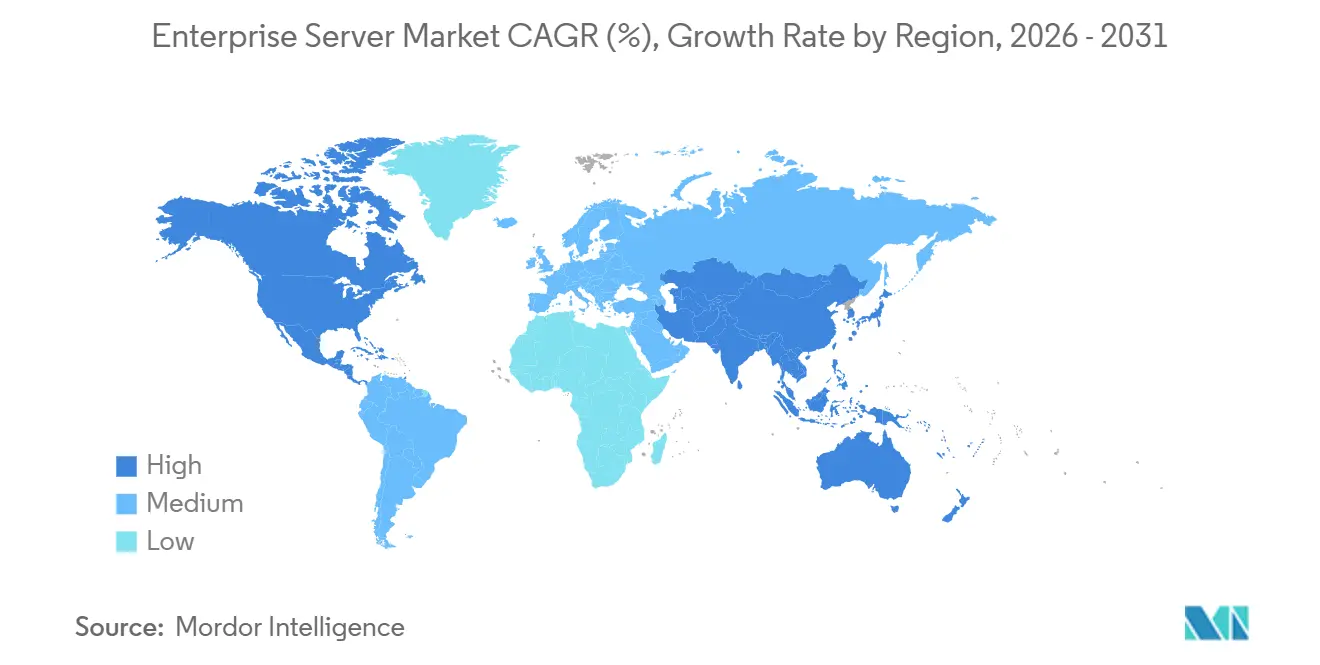
| Fastest Growing Market | Asia Pacific |
| Largest Market | North America |
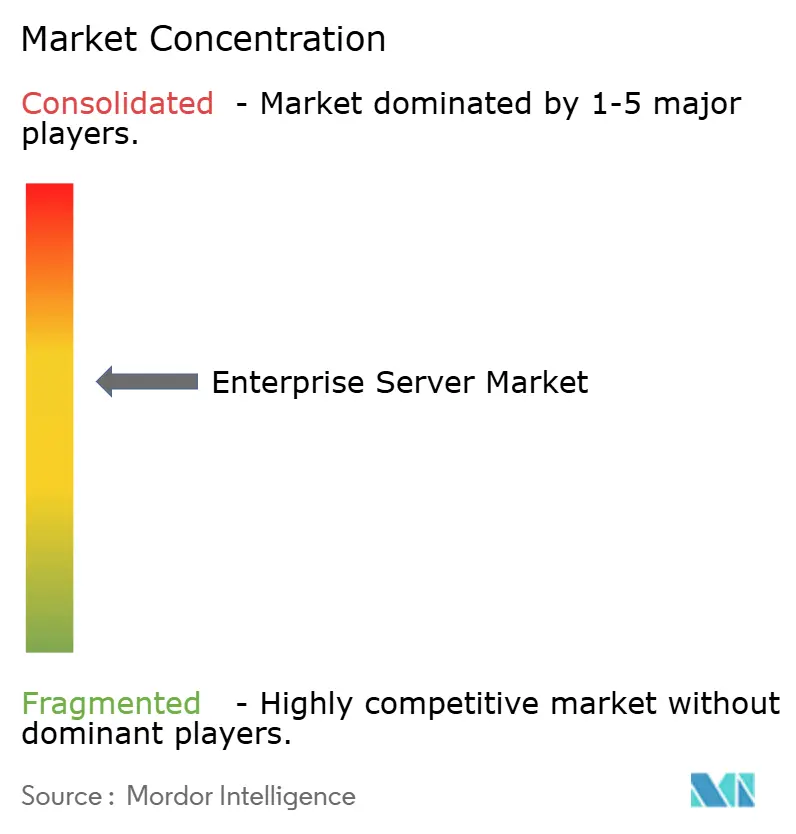
| Market Concentration | Medium |
Major Players *Disclaimer: Major Players sorted in no particular order Image © Mordor Intelligence. Reuse requires attribution under CC BY 4.0. | |
Enterprise Server Market Analysis by Mordor Intelligence
The enterprise server market size is projected to be USD 95.02 billion in 2025, USD 101.38 billion in 2026, and reach USD 140.55 billion by 2031, growing at a CAGR of 6.75% from 2026 to 2031. Intensifying demand for AI-accelerated workloads, the return of latency-sensitive applications from public clouds, and rapid edge-computing rollouts are reshaping vendor roadmaps. Hyperscalers diversified into Arm-based instances, eroding traditional x86 pricing power, while liquid-cooling and chiplet designs lifted rack densities and deferred heat constraints. Government stimulus in the United States, the European Union, China, India, and Japan shortened investment payback periods and fueled short-cycle procurement spikes. At the same time, supply bottlenecks for high-bandwidth memory and silicon-photonics components lengthened lead times and bifurcated the enterprise server market into premium AI nodes and commoditized general-purpose systems.
Key Report Takeaways
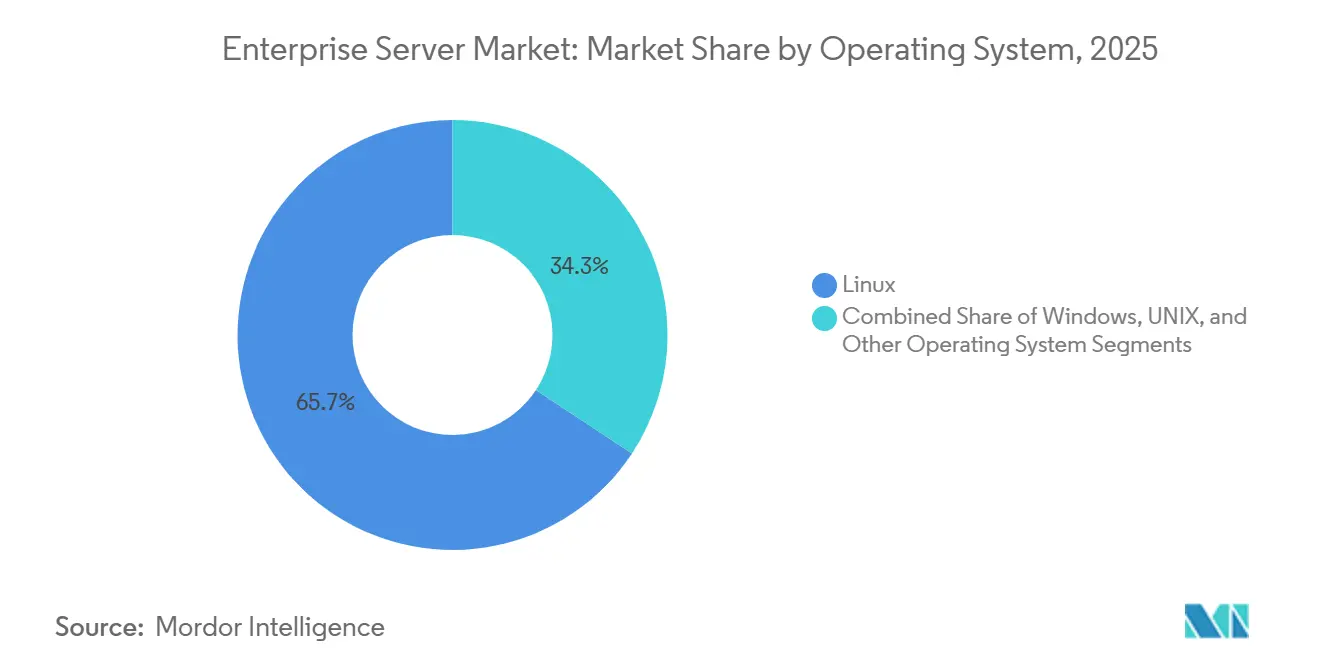
- By operating system, Linux led the enterprise server market with 65.72% market share in 2025 and is projected to grow at a 6.89% CAGR through 2031, outpacing competing operating systems.
- By server class, volume servers captured 41.94% of the enterprise server market in 2025, and high-end servers are advancing at a 6.81% CAGR over 2026-2031, the fastest class-level growth.
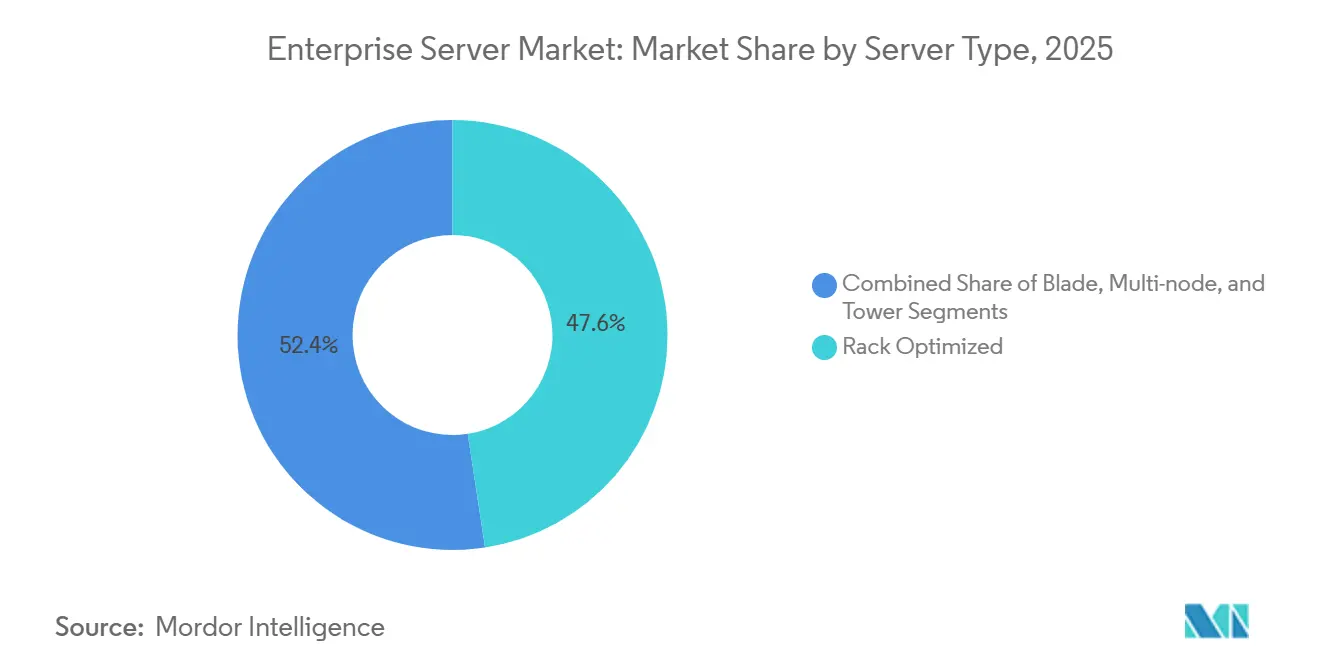
- By server type, rack-optimized represented 47.58% of deployments, and multi-node is expected to expand at a 7.06% CAGR, the highest among server types, reflecting advantages in disaggregated memory pools.
- By end-user vertical, IT and Telecommunication accounted for 29.17% of incremental spending, and healthcare is forecast to post the strongest vertical growth, with a 7.16% CAGR through 2031.
- By geography, North America accounted for 37.47% of market share in 2025, while Asia-Pacific is the fastest geography, registering a 7.33% CAGR through 2031, driven by sovereign-cloud mandates and manufacturing incentives.
Note: Market size and forecast figures in this report are generated using Mordor Intelligence’s proprietary estimation framework, updated with the latest available data and insights as of 2026.
Global Enterprise Server Market Trends and Insights
Drivers Impact Analysis*
| Driver | (~) % Impact on CAGR Forecast | Geographic Relevance | Impact Timeline |
|---|---|---|---|
| Growing AI-Accelerated Workload Demand | +1.8% | Global with focus in North America, China, Western Europe | Medium term (2-4 years) |
| Enterprise Cloud Migration and Hybrid Cloud Strategies | +1.3% | Global, led by North America and Europe, expanding in Asia-Pacific | Long term (≥4 years) |
| Rapid Growth of Edge Computing and 5G-Enabled Micro Data Centers | +1.0% | Asia-Pacific core, spill-over to Middle East and Latin America | Medium term (2-4 years) |
| Opex-Based Server Subscription and Consumption Models | +0.7% | North America and Western Europe, early adoption in Australia and Singapore | Short term (≤2 years) |
| Adoption of Liquid Cooling Enabling Higher Rack Densities | +0.6% | North America, Northern Europe, select hyperscale sites in Asia-Pacific | Medium term (2-4 years) |
| Government AI Infrastructure Stimulus Programs | +0.9% | United States, European Union, China, India, Japan | Short term (≤2 years) |
| Source: Mordor Intelligence | |||
Growing AI-Accelerated Workload Demand
GPU-accelerated server shipments rose 47% year over year in 2025 as enterprises devoted up to 28% of infrastructure budgets to AI-capable hardware. Large-language models above 100 billion parameters require dense clusters linked by 400 gigabit fabrics, pushing vendors toward liquid-cooled, high-bandwidth designs. Hyperscalers grew AI-optimized instance portfolios by 35% and enterprises installed on-premises GPU nodes to avoid egress fees and protect proprietary data. Edge inference further lifted mid-range demand for NVIDIA L4 and AMD Instinct MI210 accelerators. The frontier model computes intensity doubled every six months between 2022 and 2025, shortening server refresh cycles to roughly 24 months.[1]Epoch AI, “Trends in Training Compute,” epochai.org
Enterprise Cloud Migration and Hybrid Cloud Strategies
Hybrid architectures hosted 63% of workloads in 2025 as firms repatriated latency-sensitive applications while keeping burst capacity in public clouds.[2]Flexera, “2025 State of Cloud Report,” flexera.com Kyndryl reported 48% of Fortune 1000 clients adopted hybrid models, citing data-sovereignty rules that impose fines up to 4% of global revenue for violations. Repatriation economics showed sustained public-cloud workloads costing 30-50% more over three years than on-premises equivalents, sustaining demand for volume servers. Vendors responded with servers pre-integrated with hyperscaler APIs, enabling unified orchestration. This dual-track strategy underpins steady baseline growth for the enterprise server market through 2031.
Rapid Growth of Edge Computing and 5G-Enabled Micro Data Centers
Standalone 5G rollouts in Asia-Pacific and the Middle East sparked a 41% jump in edge-server shipments during 2025. Telecommunications operators deployed container-sized micro data centers at cell towers to deliver sub-10 millisecond latency required for autonomous vehicles and immersive retail. Akamai and Cloudflare expanded edge platforms by 28% with GPU-ready nodes that process real-time video and AI inference. Chinese manufacturers Inspur and H3C won 34% of Asia-Pacific edge contracts by shipping pre-integrated, liquid-cooled units at lower capital cost. The enterprise server market now prizes ruggedized, low-power formats that traditional rack vendors have yet to match.
Government AI Infrastructure Stimulus Programs
The United States CHIPS and Science Act committed USD 8.5 billion to AI-centric data-center incentives, subsidizing up to 30% of capital expenditures. The European Union allocated EUR 43 billion (USD 48.4 billion) for sovereign cloud projects. China’s 14th Five-Year Plan ordered 10 national AI hubs equipped with at least 10,000 GPU servers by 2025. India’s Production-Linked Incentive scheme reimbursed 6% of incremental server production, attracting investments from Foxconn and Wistron. These programs cut payback periods to under 3 years, accelerating near-term server procurement and boosting the enterprise server market's trajectory.
Restraints Impact Analysis*
| Restraint | (~) % Impact on CAGR Forecast | Geographic Relevance | Impact Timeline |
|---|---|---|---|
| Server virtualization and consolidation reducing physical installs | -1.2% | North America and Europe | Long term (≥ 4 years) |
| Price erosion and commoditization of x86 hardware | -0.8% | Global - competitive pressure centered on Asia Pacific | Medium term (2-4 years) |
| Supply-chain shortages for GPUs and silicon-photonics components | -0.7% | North America and Europe | Short term (≤ 2 years) |
| Rising data-center energy tariffs and carbon-compliance costs | -0.5% | Europe and North America, expanding in Asia Pacific | Long term (≥ 4 years) |
| Source: Mordor Intelligence | |||
Supply-Chain Shortages for GPUs and Silicon-Photonics Components
NVIDIA H100 and H200 lead times averaged 26 weeks for tier-2 customers in early 2025, delaying USD 3.2 billion in server revenue and trimming unit shipments 4-6% relative to unconstrained demand. The chokepoint sat in TSMC’s advanced packaging for CoWoS and HBM3 memory despite a 40% capacity uplift. Similar tightness afflicted 800 gigabit silicon-photonics transceivers as Broadcom and Marvell struggled to scale co-packaged optics. Buyers with long-term allocation enjoyed list pricing while spot purchasers paid 20-35% premiums. Intel’s Gaudi 3 promised relief in 2026 yet required non-CUDA software stacks, limiting near-term substitution.
Rising Data-Center Energy Tariffs and Carbon-Compliance Costs
Industrial power prices in Germany, France, and the United Kingdom rose by 18-24% between 2024 and 2025 as gas volatility and carbon pricing increased operating costs.[3]International Energy Agency, “Electricity Prices for Industry,” iea.org The EU Carbon Border Adjustment Mechanism added EUR 0.06-0.09 per kilowatt-hour (USD 0.07-0.10) for high-carbon grids. California Title 24 standards lowered the permissible power-usage effectiveness to below 1.3, requiring liquid cooling that added USD 800-1,200 per kilowatt of capacity. Operators deferred refreshes or shifted workloads to Norway and Iceland, where hydro power costs USD 0.03-0.05 per kilowatt-hour. The restraint redistributes enterprise server market demand toward energy-advantaged regions and high-density platforms.
*Our forecasts treat driver/restraint impacts as directional, not additive. The impact forecasts reflect baseline growth, mix effects, and variable interactions.
Segment Analysis
By Operating System: Linux Extends Its Lead
Linux captured 65.72% of 2025 deployments and will continue to expand at a 6.89% CAGR, as container orchestration and AI frameworks depend on kernel-level controls. The enterprise server market for Linux nodes is projected to grow significantly over the forecast period, reflecting sustained investment in open-source ecosystems. Adoption of confidential-computing modules further solidifies Linux advantages for security-sensitive workloads.
Windows Server maintained a considerable presence due to legacy .NET applications, but its growth rate lags both Linux and the overall enterprise server market. UNIX variants experienced a decline as end-of-life announcements accelerated migrations. Windows Server's integration with Azure Arc and hybrid-identity services provided a counter-narrative, yet the 15 to 25 percent licensing premium relative to Linux distributions constrained adoption in cost-sensitive segments. UNIX's decline accelerated as Oracle announced end-of-life dates for SPARC-based systems, prompting financial institutions to migrate core-banking workloads to x86 Linux clusters running containerized microservices.


By Server Class: AI Spending Shifts the Mix
High-end servers with eight or more processors or GPUs absorbed 38% of AI budgets in 2025 and expanded at a 6.81% CAGR through 2031. High-end servers, defined as systems with 8 or more processors or GPU accelerators and list prices exceeding USD 50,000, absorbed a significant portion of enterprise AI infrastructure budgets in 2025. This segment includes NVIDIA DGX H100 systems, Dell PowerEdge XE9680, and HPE Cray EX platforms that integrate liquid-cooling manifolds and 400-gigabit InfiniBand switches to minimize training latency.
Volume servers, encompassing 1- and 2-socket rack-mount units priced below USD 10,000, remain the workhorse of general-purpose computing, yet their growth reflects margin compression and virtualization-driven consolidation that reduced unit demand in 2025. The bifurcation between high-end and volume segments is reshaping vendor strategies, as Dell Technologies and Hewlett Packard Enterprise prioritized AI-optimized SKUs with higher gross margins, while Taiwanese ODMs competed aggressively in the volume segment with lower margins. Super Micro Computer's liquid-cooled GPU servers, which began shipping in volume during late 2024, gained traction in the high-end segment in 2025 by offering lower total-cost-of-ownership than incumbent blade architectures. Mid-range servers face the greatest disruption, as public-cloud instances with comparable performance undercut on-premises economics for workloads lacking strict latency or data-residency requirements.
By Server Type: Multi-Node Designs Gain Momentum
Rack-optimized formats remained dominant at 47.58% in 2025, yet multi-node systems grow the fastest at 7.06% CAGR by pooling NVMe storage and high-bandwidth memory across nodes. Multi-node servers, which integrate 2 to 4 independent compute nodes within a single 2U or 4U chassis, enable data-center operators to achieve higher server densities, reducing footprint and cabling complexity significantly compared to traditional 1U rack-mount units. Blade servers continued to serve enterprise virtualization and high-availability clusters, though their growth rate trails the market average as hyperscalers favor rack-optimized designs that simplify thermal management and reduce acquisition costs.
Rack-optimized servers retained dominance in hyperscale environments due to their compatibility with existing power and cooling infrastructure, yet the premium for multi-node designs is justified by operational-expenditure savings that accrue over 3- to 4-year refresh cycles. Blade servers face secular headwinds as enterprises migrate to software-defined infrastructure that decouples compute, storage, and networking, rendering the integrated chassis model less compelling. Tower servers persist in verticals such as retail and hospitality, where branch-office deployments prioritize simplicity over density, though their unit volumes have declined as point-of-sale systems transitioned to cloud-connected appliances.
By End-User Vertical: Healthcare Surges on AI Imaging
IT and telecommunication led spending at 29.17% in 2025, anchored by 5G rollouts and hyperscale expansion. Healthcare, however, is the fastest vertical with a 7.16% CAGR, benefiting from GPU-based 3D imaging that cuts diagnostic latency from 48 hours to less than 2 hours. The U.S. Health Insurance Portability and Accountability Act and Europe's Medical Device Regulation mandate that patient data remain within jurisdictional boundaries, incentivizing hospitals to deploy private clouds rather than rely on public hyperscalers.
Banking, Financial Services and Insurance is expected to witness significant growth as institutions refresh core-banking systems and expand fraud-detection infrastructure powered by real-time transaction analytics. Manufacturing is anticipated to grow steadily, driven by industrial-IoT gateways and predictive-maintenance platforms that process sensor telemetry at factory edge locations. Retail is projected to advance as omnichannel strategies require unified inventory and customer-data systems hosted on-premises to minimize latency. Media and Entertainment is likely to grow as streaming platforms deploy GPU servers for real-time video transcoding and content-recommendation engines.
Geography Analysis
North America held 37.47% market share in 2025, yet Asia-Pacific is expanding at a 7.33% CAGR through 2031, propelled by sovereign cloud mandates, hyperscale capacity additions, and government stimulus programs in China, India, and Japan. North America's dominance reflects the concentration of hyperscalers, Fortune 500 enterprises, and AI research institutions, which collectively deployed USD 35.6 billion in server infrastructure during 2025. Canada and Mexico also contributed significantly, with growth tied to nearshoring trends and cross-border data-residency requirements under the USMCA trade agreement.
Asia-Pacific's growth was anchored in China's 14th Five-Year Plan, which mandated the construction of national AI innovation centers equipped with advanced GPU servers, and India's Production-Linked Incentive scheme, which attracted substantial server-manufacturing investments from major companies. Japan's Ministry of Economy, Trade, and Industry subsidized energy-efficient data-center construction, reducing electricity costs for operators deploying liquid-cooled infrastructure, while South Korea's AI semiconductor strategy allocated significant funding to domestic server production.
Europe experienced steady growth, supported by the Digital Decade initiative funding sovereign-cloud projects in Germany, France, and the Netherlands, while Brexit-related data-localization rules sustained demand in the United Kingdom. The Middle East saw growth as Saudi Arabia's Vision 2030 and the UAE's National AI Strategy drove investments in hyperscale facilities and smart-city infrastructure. South America advanced with Brazil leading regional demand tied to financial-services modernization and e-commerce expansion. Africa also experienced growth as telecommunications operators in Nigeria and South Africa deployed edge micro data centers to support mobile-money platforms and content-delivery networks.

Competitive Landscape
The enterprise server market exhibited moderate concentration in 2025, with Dell Technologies, Hewlett Packard Enterprise, Super Micro Computer, Lenovo, and Inspur collectively dominating global unit shipments, yet the remaining portion was fragmented across Taiwanese ODMs, regional integrators, and white-label providers that compete aggressively on price and customization.
Dell Technologies leveraged its direct-sales model and PowerEdge portfolio to emphasize liquid-cooled GPU servers and as-a-service financing that deferred upfront capital expenditures for enterprise customers. Hewlett Packard Enterprise focused on its Cray EX and Apollo platforms, which integrated HPE GreenLake consumption-based pricing and differentiated on its high-performance computing pedigree. Super Micro Computer's market presence expanded, driven by its Building Block Solutions that enabled hyperscalers to configure GPU-optimized chassis with faster time-to-deployment than traditional build-to-order cycles.
Strategic patterns in 2025 centered on vertical integration, consumption-based pricing, and geographic diversification. Dell Technologies acquired a minority stake in a liquid-cooling startup to secure supply-chain priority for thermal solutions, while Hewlett Packard Enterprise expanded its GreenLake portfolio to include GPU-as-a-service offerings that converted capital expenditures into predictable monthly subscriptions. Lenovo established a joint venture with Saudi Aramco to assemble servers locally, capturing public-sector contracts that mandate local content by value. The competitive intensity is highest in the volume-server segment, where average selling prices declined annually between 2020 and 2025, compressing gross margins for vendors lacking differentiation in supply-chain efficiency or financing flexibility. Technology adoption is reshaping competitive dynamics, as vendors that integrate liquid-cooling, silicon-photonics interconnects, and AI-optimized BIOS configurations command premiums over commodity x86 platforms, yet require capital investments in R&D and manufacturing that smaller players struggle to finance.
Enterprise Server Industry Leaders
Hewlett Packard Enterprise Co.
Dell Technologies Inc.
IBM Corporation
Lenovo Group Limited
Inspur Group Co., Ltd.
- *Disclaimer: Major Players sorted in no particular order

Recent Industry Developments
- December 2025: Dell Technologies announced a USD 1.2 billion expansion of liquid-cooling manufacturing in Austin, Texas, targeting production of 50 000 GPU-optimized servers annually by late 2026.
- November 2025: Hewlett Packard Enterprise secured a USD 850 million U.S. Department of Energy contract for a 2-exaflop supercomputer based on Cray EX architecture with AMD Instinct MI300A accelerators.
- October 2025: Super Micro Computer partnered with Broadcom to co-develop servers using Jericho3-AI fabric and integrated 800 gigabit Ethernet switches for AI clusters.
- September 2025: Lenovo inaugurated a USD 600 million server-assembly plant in Riyadh, Saudi Arabia, in partnership with Saudi Aramco, producing 100 000 rack-optimized servers annually.


Global Enterprise Server Market Report Scope
An enterprise server is a computer server that runs programs to collectively meet the requirements of an enterprise rather than an individual user, department, or specialized application.
The Enterprise Server Market Report is Segmented by Operating System (Linux, Windows, UNIX, and Other Operating System), Server Class (High-end Server, Mid-range Server, and Volume Server), Server Type (Blade, Multi-node, Tower, and Rack Optimized), End-user Vertical (IT and Telecommunication, Banking Financial Services and Insurance, Manufacturing, Retail, Healthcare, Media and Entertainment, and Other End-user Verticals), and Geography (North America, South America, Europe, Asia-Pacific, Middle East, and Africa). The Market Forecasts are Provided in Terms of Value (USD).
| Linux |
| Windows |
| UNIX |
| Other Operating Systems |
| High-end Server |
| Mid-range Server |
| Volume Server |
| Blade |
| Multi-node |
| Tower |
| Rack Optimized |
| IT and Telecommunication |
| Banking, Financial Services and Insurance |
| Manufacturing |
| Retail |
| Healthcare |
| Media and Entertainment |
| Other End-user Verticals |
| North America | United States |
| Canada | |
| Mexico | |
| South America | Brazil |
| Argentina | |
| Rest of South America | |
| Europe | Germany |
| Italy | |
| United Kingdom | |
| France | |
| Spain | |
| Rest of Europe | |
| Asia-Pacific | China |
| Japan | |
| India | |
| South Korea | |
| Rest of Asia-Pacific | |
| Middle East | Saudi Arabia |
| United Arab Emirates | |
| Turkey | |
| Rest of Middle East | |
| Africa | South Africa |
| Nigeria | |
| Rest of Africa |
| By Operating System | Linux | |
| Windows | ||
| UNIX | ||
| Other Operating Systems | ||
| By Server Class | High-end Server | |
| Mid-range Server | ||
| Volume Server | ||
| By Server Type | Blade | |
| Multi-node | ||
| Tower | ||
| Rack Optimized | ||
| By End-user Vertical | IT and Telecommunication | |
| Banking, Financial Services and Insurance | ||
| Manufacturing | ||
| Retail | ||
| Healthcare | ||
| Media and Entertainment | ||
| Other End-user Verticals | ||
| By Geography | North America | United States |
| Canada | ||
| Mexico | ||
| South America | Brazil | |
| Argentina | ||
| Rest of South America | ||
| Europe | Germany | |
| Italy | ||
| United Kingdom | ||
| France | ||
| Spain | ||
| Rest of Europe | ||
| Asia-Pacific | China | |
| Japan | ||
| India | ||
| South Korea | ||
| Rest of Asia-Pacific | ||
| Middle East | Saudi Arabia | |
| United Arab Emirates | ||
| Turkey | ||
| Rest of Middle East | ||
| Africa | South Africa | |
| Nigeria | ||
| Rest of Africa | ||


Key Questions Answered in the Report
What is the projected value of the enterprise server market by 2031?
It is expected to reach USD 140.55 billion, growing at a 6.75% CAGR over 2026-2031.
Which operating system leads current enterprise server deployments?
Linux dominates with 65.72% share in 2025 and maintains the fastest growth through 2031.
Why is Asia-Pacific the fastest growing region?
Government stimulus, sovereign-cloud mandates, and local manufacturing incentives lift regional CAGR to 7.33%.
How are GPU shortages affecting server procurement?
Lead times stretch up to 26 weeks for tier-2 buyers, delaying revenue and pushing some customers to alternate accelerators.
What segment benefits most from AI investments?
High-end, GPU-dense servers expand at 6.81% CAGR as enterprises prioritize AI training and inference.
Page last updated on:


