Data Center And Server Semiconductor Market Size and Share
Market Overview
| Study Period | 2019 - 2030 |
|---|---|
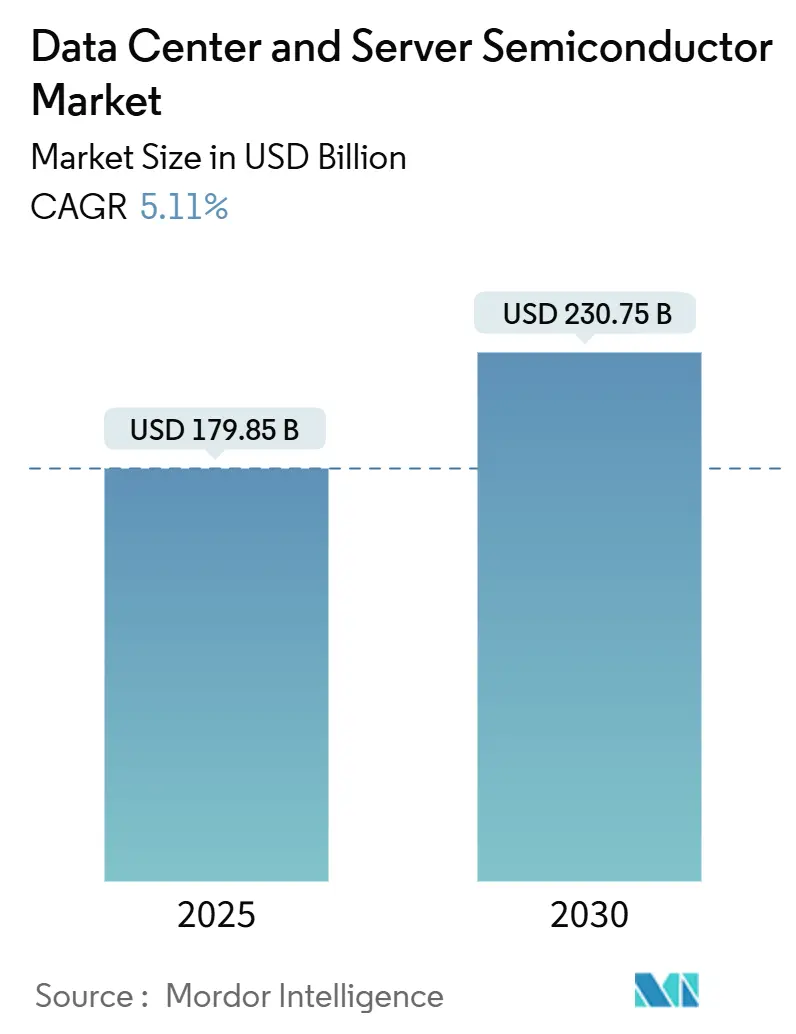
| Market Size (2025) | USD 179.85 Billion |
| Market Size (2030) | USD 230.75 Billion |
| Growth Rate (2025 - 2030) | 5.11% CAGR |
| Fastest Growing Market | Asia Pacific |
| Largest Market | North America |
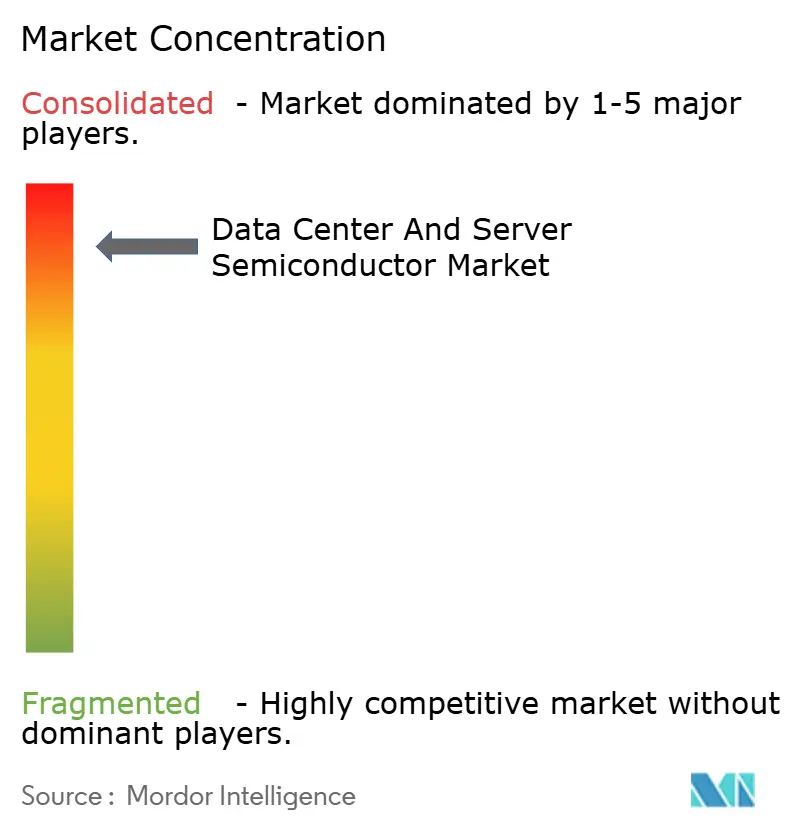
| Market Concentration | High |
Major Players *Disclaimer: Major Players sorted in no particular order Image © Mordor Intelligence. Reuse requires attribution under CC BY 4.0. | |
Data Center And Server Semiconductor Market Analysis by Mordor Intelligence
The global data center and server semiconductor market size stood at USD 179.85 billion in 2025 and is projected to reach USD 230.75 billion by 2030, reflecting a 5.11% CAGR during the forecast period. This moderate expansion reflects a maturing demand profile in which hyperscaler investment in artificial-intelligence infrastructure, rather than traditional PC or smartphone cycles, sets production priorities. Foundry roadmaps, therefore, emphasize custom compute architectures, high-bandwidth memory integration, and advanced packaging over pure wafer-volume growth. Government incentives such as the CHIPS Act continue to redirect leading-edge capacity toward the United States, while Asia-Pacific champions sovereign fabs to safeguard supply continuity. Meanwhile, liquid-cooling requirements for 2-3 kW accelerators are redefining data-center infrastructure, prompting parallel upgrades in power-delivery devices and thermal materials.[1]Taiwan Semiconductor Manufacturing Company, “TSMC Arizona Receives CHIPS Act Award,” tsmc.com
Key Report Takeaways
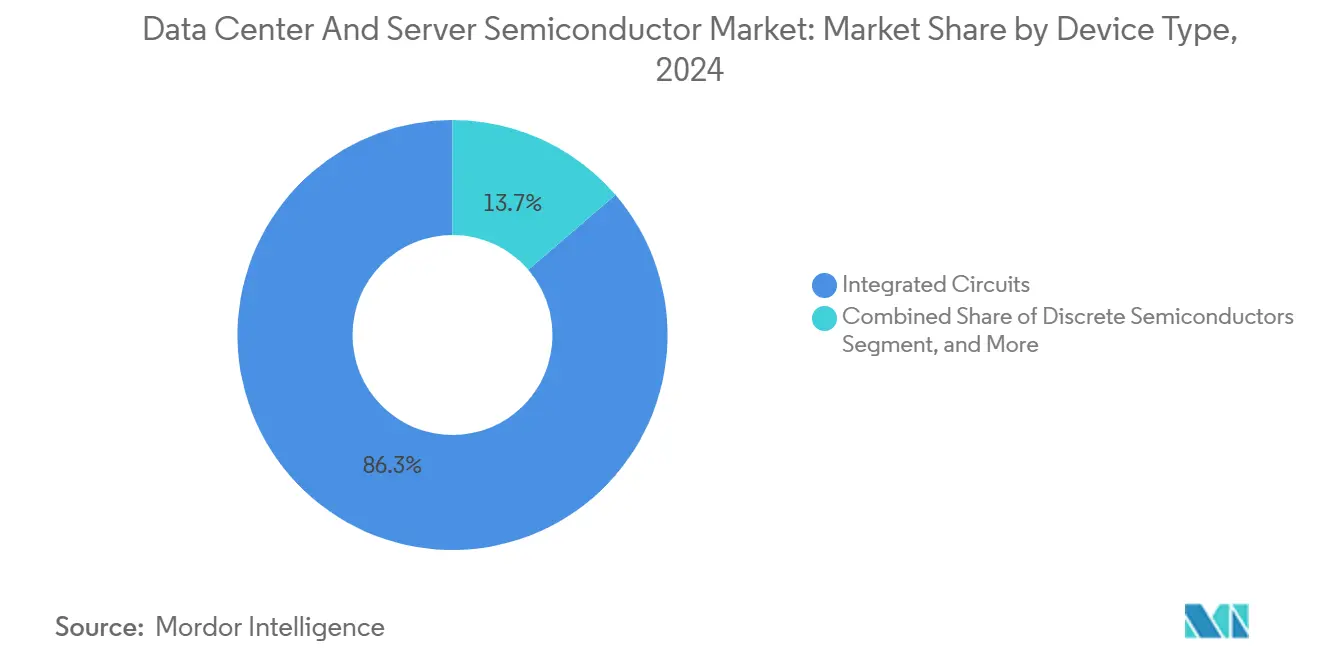
- By device type, Integrated Circuits accounted for 86.3% of the data center and server semiconductor market share in 2024 and are advancing at a 5.9% CAGR to 2030.
- By business model, Design/Fabless Vendors held 67.9% of the data center and server semiconductor market size in 2024, while the same segment is poised to expand at a 5.7% CAGR through 2030.
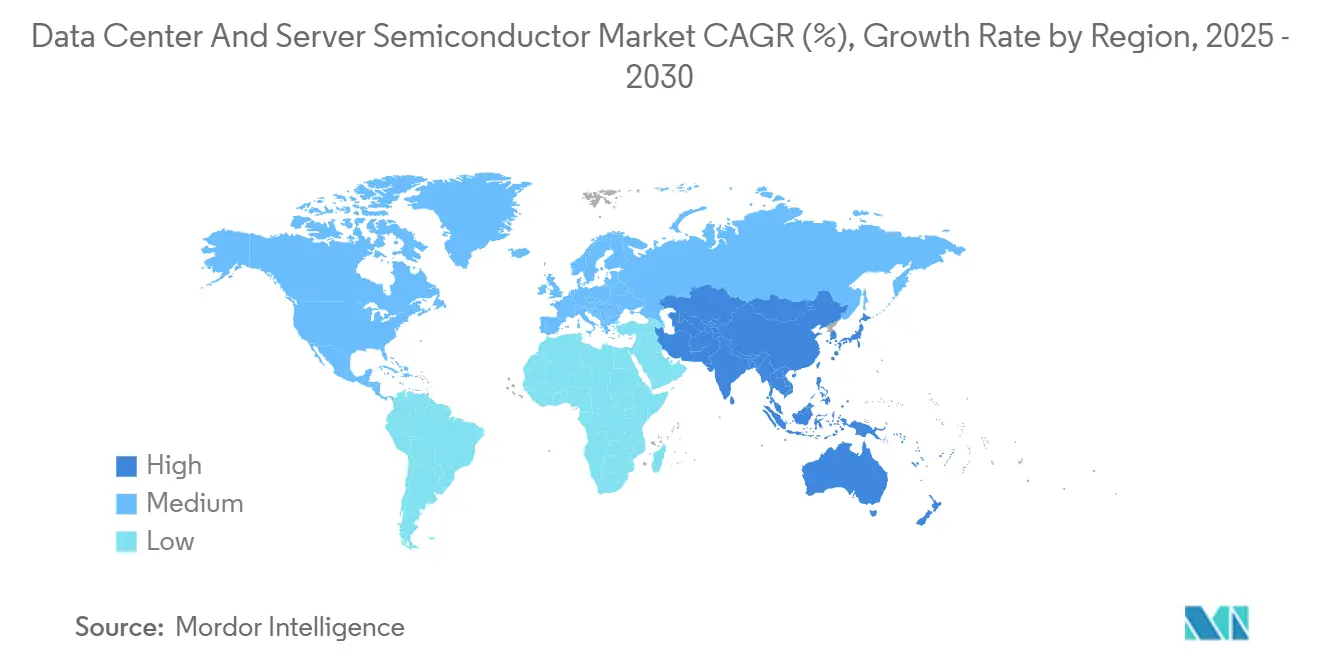
- By geography, North America led with 38.7% revenue share in 2024; Asia-Pacific is projected to post the fastest regional CAGR at 6.1% between 2025 and 2030.
Global Data Center And Server Semiconductor Market Trends and Insights
Drivers Impact Analysis*
| Driver | (~) % Impact on CAGR Forecast | Geographic Relevance | Impact Timeline |
|---|---|---|---|
| GPU dominance for AI model training | +1.8% | Global, concentrated in North America and the Asia-Pacific | Medium term (2-4 years) |
| Surging demand for High-Bandwidth Memory (HBM) | +1.2% | Global, led by South Korea and Taiwan, manufacturing | Short term (≤ 2 years) |
| Shift to custom ASICs by hyperscalers | +0.9% | North America and Europe, with Asia-Pacific manufacturing | Medium term (2-4 years) |
| Growth in chiplets and advanced packaging adoption | +0.7% | Global, concentrated in advanced foundries | Long term (≥ 4 years) |
| Government CHIPS-style subsidies for domestic fabs | +0.6% | North America, Europe, select Asia-Pacific | Long term (≥ 4 years) |
| Emerging liquid-cooling compatible power devices | +0.4% | Global, early adoption in data centers | Medium term (2-4 years) |
| Source: Mordor Intelligence | |||
GPU Dominance for AI Model Training
Accelerated-computing architectures built around thousands of parallel GPU cores now dominate hyperscaler capital spending. NVIDIA’s valuation surge past USD 2 trillion in 2024 underscores how performance leadership in AI training chips can reshape the semiconductor market. Data-center operators deploy ever-larger clusters where memory bandwidth and interconnect latency dictate the total cost of ownership. The specialization trend invites rivals—including AMD, Intel, Groq, and Cerebras—to deliver differentiated training silicon, pressuring incumbent GPU suppliers to optimize both power envelopes and ecosystem support. As workloads diversify, vendors must balance raw tera-flops with software portability to retain share.
Surging Demand for High-Bandwidth Memory (HBM)
HBM sits at the heart of performance scaling because AI models already exceed 1 TB/s bandwidth needs. SK Hynix, Samsung, and Micron jointly supply more than 95% of the world’s HBM capacity, sustaining six-to-nine-month lead times for HBM3E stacks.[2]Semiconductor Today Editors, “Halo Industries Raises USD 80 M Series B,” semiconductor-today.comFoundries answer with advanced packaging such as CoWoS that places memory dies adjacent to compute dies, driving up substrate complexity and capital intensity. Memory makers face a dilemma: retool for premium low-volume HBM or preserve high-volume DRAM margins. Resulting scarcity raises average-selling-price trends that ripple through accelerator bills of materials and ultimately raise hyperscaler capex.
Shift to Custom ASICs by Hyperscalers
Cloud providers now regard silicon differentiation as strategic, with Google TPU, Amazon Trainium, and Microsoft Maia demonstrating 15–30 × performance-per-watt gains over off-the-shelf GPUs. Foundries compete fiercely for these design wins because each chip can anchor multi-year node utilization. The model disrupts the historical merchant-silicon hierarchy: fabless houses must now pitch value-add IP rather than turnkey parts, while integrated device manufacturers (IDMs) evolve contract manufacturing arms to capture custom business. Electronic-design-automation vendors also benefit, selling advanced RTL-to-GDS flows tailored for hyperscaler workloads.
Growth in Chiplets and Advanced Packaging Adoption
With sub-5 nm transistors approaching cost-yield walls, chiplets deliver a practical route to heterogeneous integration. Intel’s disaggregated roadmap demonstrates how mixing core compute dies on a leading node with analog or I/O chiplets on mature nodes can cut system costs without sacrificing performance. Universal Chiplet Interconnect Express (UCIe) aims to guarantee interoperability, enabling ecosystem flexibility and component reuse. Yet multi-die assembly raises reliability and test complexity, prompting backend specialists to invest in X-ray inspection, automated optical metrology, and fine-pitch bumping. Over the long term, software abstractions that treat chiplet clusters like monolithic dies will decide adoption speed.
Restraints Impact Analysis*
| Restraint | (~) % Impact on CAGR Forecast | Geographic Relevance | Impact Timeline |
|---|---|---|---|
| Recurring server over-capacity cycles | -0.8% | Global, concentrated in data center markets | Short term (≤ 2 years) |
| Geopolitical export-control uncertainties | -1.1% | Global, particularly the China-US-Europe trade | Medium term (2-4 years) |
| Thermal envelope limits at sub-3 nm nodes | -0.6% | Global, affecting leading-edge manufacturing | Long term (≥ 4 years) |
| Shortage of advanced-node lithography equipment | -0.9% | Global, concentrated in advanced foundries | Medium term (2-4 years) |
| Source: Mordor Intelligence | |||
Recurring Server Over-Capacity Cycles
Hyperscalers periodically pause procurement once installed servers reach acceptable utilization, triggering inventory corrections that ripple upstream. The 2024 digestion period after the first AI-build-out saw order push-outs and component price erosion. Because server-class processors carry high die area and margin, even slight volume swings magnify fab loading volatility. Vendor forecasts, therefore, remain vulnerable to macroeconomic sentiment and utilization analytics rather than predictable refresh intervals. Contract manufacturers respond by widening customer portfolios to cushion revenue troughs.
Geopolitical Export-Control Uncertainties
Tightening export rules restrict China’s access to extreme-ultraviolet lithography and sub-7 nm design flows, compelling global companies to manage dual product lines. Compliance raises legal overhead and slows engineering collaboration, complicating roadmap alignment for multinational teams. In parallel, Beijing accelerates domestic alternatives while customers outside China hedge with multi-sourcing strategies. The regulatory tug-of-war injects uncertainty into demand planning and capital-expenditure timing, suppressing near-term semiconductor market momentum.
*Our forecasts treat driver/restraint impacts as directional, not additive. The impact forecasts reflect baseline growth, mix effects, and variable interactions.
Segment Analysis
By Device Type: Integrated Circuits Sustain Leadership
Integrated Circuits retained an 86.3% data center and server semiconductor market share in 2024 and are tracking a 5.9% CAGR to 2030, underscoring their pivotal role in AI accelerators, memory, and edge processors. Within this cluster, microprocessors and DRAM move in opposite directions: specialized AI cores push processor revenue upward, while commoditized mobile SoCs face price pressure. Memory growth concentrates in the HBM and GDDR segments, where bandwidth dictates premium pricing. Discrete power devices support electrification trends but contribute a smaller portion to the overall semiconductor market. Optoelectronics benefit from data-center optics and automotive lidar, with revenue pace outstripping unit shipments because of higher per-module value.
Hybrid architectures that co-package logic, memory, and photonics foster cross-device synergies. Assembly houses therefore market turnkey “silicon-system” services rather than individual die attach. As chiplets blur strict category lines, regulators and analysts increasingly treat the integrated system as a single accounting unit, further reinforcing the dominance of integrated circuits in the semiconductor market. Continuous investment in ultra-clean EUV tools and backside-power delivery networks shows that, despite cost headwinds, leading-edge nodes remain economically viable for performance-critical compute tiles within multi-die packages.


By Business Model: Fabless Strategy Extends Its Reach
Design/Fabless Vendors captured 67.9% of the data center and server semiconductor market size in 2024 and are projected to expand at a 5.7% CAGR through 2030. The fabless model offers capital agility and taps global foundries for process leadership without owning multibillion-dollar plants. Start-ups can iterate architectures quickly, while incumbents shift commodity parts to third-party fabs to concentrate internal lines on high-margin monolithic processors.
Integrated Device Manufacturers still matter in analog, power, and RF, where process tweaks deliver tangible performance gains. Yet even Intel now courts external customers under its Foundry 2.0 strategy, signaling convergence toward a mixed model. Competitive differentiation thus pivots on IP libraries, software stacks, and supply-chain orchestration rather than wafer ownership alone. Over the forecast horizon, design houses that master chiplet partitioning, firmware integration, and security certifications will consolidate their share inside the data center and server semiconductor market.
Geography Analysis
North America commanded 38.7% of the data center and server semiconductor market in 2024, propelled by hyperscaler AI facilities and defense procurement mandates prioritizing domestic supply. CHIPS-funded grants totaling USD 14.5 billion to TSMC and Intel have accelerated local wafer capacity, while Canada and Mexico supply assembly, test, and printed-circuit sub-systems that shorten regional lead times. Implementation success depends on talent pipelines and on-time tool deliveries against a backdrop of tight EUV availability.
Asia-Pacific remains the fastest-growing region at a 6.1% CAGR through 2030. Taiwan anchors leading-edge logic, South Korea leads in memory, and Japan excels in photoresist chemicals and advanced substrates. China focuses on mature-node self-reliance for automotive and industrial chips as export controls restrict access to EUV scanners.[3]Ji-hui Choi, “TSMC Surpasses Samsung with 2 nm Lead,” biz.chosun.com Singapore, Malaysia, and Vietnam win backend investments as brands diversify away from single-country concentration. Sovereign incentives—ranging from land grants to tax holidays—support this distributed capacity build-out even as energy grid upgrades lag wafer-fab growth.
Europe’s semiconductor market growth lags peers but gains momentum from a EUR 43 billion Chips Act that supports Dresden and Grenoble clusters. The region specializes in power discretes, automotive microcontrollers, and RF filters that align with its EV and industrial automation strengths. Research centers push quantum and neuromorphic proof-of-concept devices, but near-term revenue remains tied to established automotive OEM demand. Successful scale-up will rely on closing the talent gap, easing construction permitting, and streamlining subsidy allocation.

Competitive Landscape
The top five foundries control a significant share of global capacity, making the semiconductor market highly concentrated and sensitive to single-source disruptions. TSMC alone accounts for the majority of revenue share, providing customers with unmatched EUV capacity and CoWoS packaging services. Samsung follows TSMC, while Intel ramps its 18A node to reclaim high-performance computing sockets. Competitive battlegrounds now extend into advanced packaging, where TSMC’s revenue from CoWoS and InFO topped 10% of corporate sales in 2025.[4]Tech Taiwan, “TSMC’s Next-Gen CoWoS Hits Like a Death Note,” substack.com Suppliers of lithography tools, photoresists, and metrology systems form a tightly coupled ecosystem whose output dictates the pace of node migration.
Emergent players exploit architectural niches. Groq’s USD 640 million financing round targets high-throughput, low-latency inference silicon that can displace commodity GPUs in speech and language tasks. Optical-interconnect start-up Celestial AI and silicon-carbide wafer innovator Halo Industries advance materials that address bandwidth and power bottlenecks. Still, the capital intensity of wafer fabrication ensures that most challengers adopt a fabless model and rely on TSMC or Samsung for production.
Strategic alliances multiply as cost-sharing mitigates USD 20 billion-plus fab outlays. Foundries partner with chemical suppliers to guarantee resist purity, with substrate vendors for high-density interposers, and with cloud providers to co-optimize chip layouts for specific workloads. Intellectual-property licensing remains a barrier to entry, with patent pools enabling incumbents to extract royalties or block disruptive newcomers. Supply-chain security and environmental, social, and governance targets also reframe purchasing criteria, favoring vendors that verify ethical mineral sourcing and carbon-neutral operations.
Data Center And Server Semiconductor Industry Leaders
Nvidia Corporation
Intel Corporation
Samsung Electronics (Device Solutions)
Advanced Micro Devices Inc.
SK hynix Inc.
- *Disclaimer: Major Players sorted in no particular order

Recent Industry Developments
- July 2025: TSMC disclosed its 2 nm Gate-All-Around technology, promising 15% performance gain and 30% lower power than 3 nm, reinforcing its leadership in leading-edge processes.
- June 2025: TSMC’s advanced-packaging revenue reached 10% of total company sales, overtaking ASE Group in this segment.
- April 2025: Groq completed a USD 640 million Series D round to expand Language Processing Units across its GroqCloud infrastructure.
- March 2025: Intel reported steady progress toward 18A production that incorporates complementary field-effect transistors and backside power.


Global Data Center And Server Semiconductor Market Report Scope
| Discrete Semiconductors | Diodes | ||
| Transistors | |||
| Power Transistors | |||
| Rectifier and Thyristor | |||
| Other Discrete Devices | |||
| Optoelectronics | Light-Emitting Diodes (LEDs) | ||
| Laser Diodes | |||
| Image Sensors | |||
| Optocouplers | |||
| Other Device Types | |||
| Sensors and MEMS | Pressure | ||
| Magnetic Field | |||
| Actuators | |||
| Acceleration and Yaw Rate | |||
| Temperature and Others | |||
| Integrated Circuits | By Integrated Circuit Type | Analog | |
| Micro | Microprocessors (MPU) | ||
| Microcontrollers (MCU) | |||
| Digital Signal Processors | |||
| Logic | |||
| Memory | |||
| By Technology Node (Shipment Volume Not Applicable) | < 3 nm | ||
| 3 nm | |||
| 5 nm | |||
| 7 nm | |||
| 16 nm | |||
| 28 nm | |||
| > 28 nm | |||
| IDM |
| Design/ Fabless Vendor |
| North America | United States | |
| Canada | ||
| Mexico | ||
| South America | Brazil | |
| Argentina | ||
| Rest of South America | ||
| Europe | Germany | |
| United Kingdom | ||
| France | ||
| Italy | ||
| Russia | ||
| Rest of Europe | ||
| Asia-Pacific | China | |
| Japan | ||
| South Korea | ||
| India | ||
| Taiwan | ||
| Rest of Asia-Pacific | ||
| Middle East and Africa | Middle East | Saudi Arabia |
| United Arab Emirates | ||
| Turkey | ||
| Rest of Middle East | ||
| Africa | South Africa | |
| Nigeria | ||
| Rest of Africa | ||
| By Device Type (Shipment Volume for Device Type is Complementary) | Discrete Semiconductors | Diodes | ||
| Transistors | ||||
| Power Transistors | ||||
| Rectifier and Thyristor | ||||
| Other Discrete Devices | ||||
| Optoelectronics | Light-Emitting Diodes (LEDs) | |||
| Laser Diodes | ||||
| Image Sensors | ||||
| Optocouplers | ||||
| Other Device Types | ||||
| Sensors and MEMS | Pressure | |||
| Magnetic Field | ||||
| Actuators | ||||
| Acceleration and Yaw Rate | ||||
| Temperature and Others | ||||
| Integrated Circuits | By Integrated Circuit Type | Analog | ||
| Micro | Microprocessors (MPU) | |||
| Microcontrollers (MCU) | ||||
| Digital Signal Processors | ||||
| Logic | ||||
| Memory | ||||
| By Technology Node (Shipment Volume Not Applicable) | < 3 nm | |||
| 3 nm | ||||
| 5 nm | ||||
| 7 nm | ||||
| 16 nm | ||||
| 28 nm | ||||
| > 28 nm | ||||
| By Business Model | IDM | |||
| Design/ Fabless Vendor | ||||
| By Geography | North America | United States | ||
| Canada | ||||
| Mexico | ||||
| South America | Brazil | |||
| Argentina | ||||
| Rest of South America | ||||
| Europe | Germany | |||
| United Kingdom | ||||
| France | ||||
| Italy | ||||
| Russia | ||||
| Rest of Europe | ||||
| Asia-Pacific | China | |||
| Japan | ||||
| South Korea | ||||
| India | ||||
| Taiwan | ||||
| Rest of Asia-Pacific | ||||
| Middle East and Africa | Middle East | Saudi Arabia | ||
| United Arab Emirates | ||||
| Turkey | ||||
| Rest of Middle East | ||||
| Africa | South Africa | |||
| Nigeria | ||||
| Rest of Africa | ||||


Key Questions Answered in the Report
How large is the semiconductor market in 2025?
The semiconductor market size reached USD 179.85 billion in 2025 and is on track for steady expansion through 2030.
What is the expected growth rate for semiconductors over 2025-2030?
Industry revenue is forecast to record a 5.11% CAGR, reflecting balanced demand from AI infrastructure, memory upgrades, and advanced packaging.
Which device type dominates semiconductor revenue?
Integrated Circuits command 86.3% of 2024 revenue and remain the centerpiece of future growth due to their role in AI accelerators and high-bandwidth memory.
Why is Asia-Pacific the fastest-growing region?
Asia-Pacific benefits from sovereign fab investments, consumer-electronics demand, and supply-chain diversification, supporting a 6.1% CAGR to 2030.
How concentrated is global semiconductor manufacturing?
The top five foundries handle 98% of capacity, with TSMC alone responsible for 60%, indicating an oligopolistic structure that shapes pricing and supply security.
Page last updated on:


