NoSQL Market Size and Share
Market Overview
| Study Period | 2020 - 2031 |
|---|---|
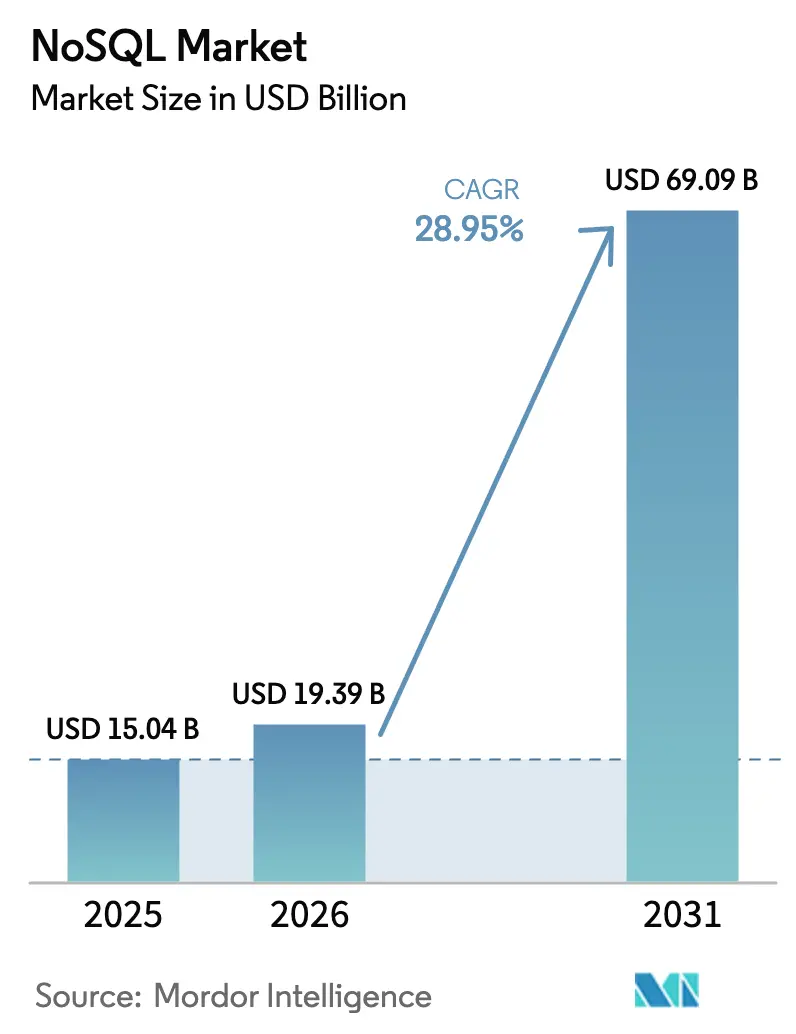
| Market Size (2026) | USD 19.39 Billion |
| Market Size (2031) | USD 69.09 Billion |
| Growth Rate (2026 - 2031) | 28.95% CAGR |
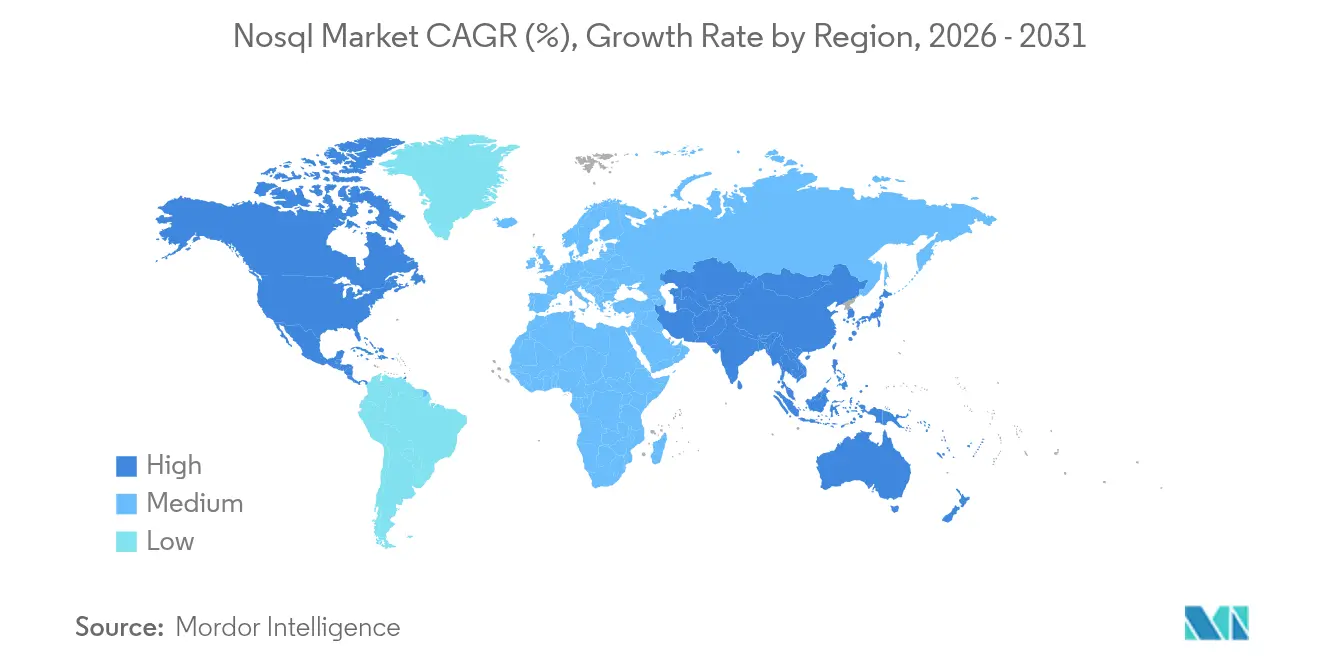
| Fastest Growing Market | Asia Pacific |
| Largest Market | North America |
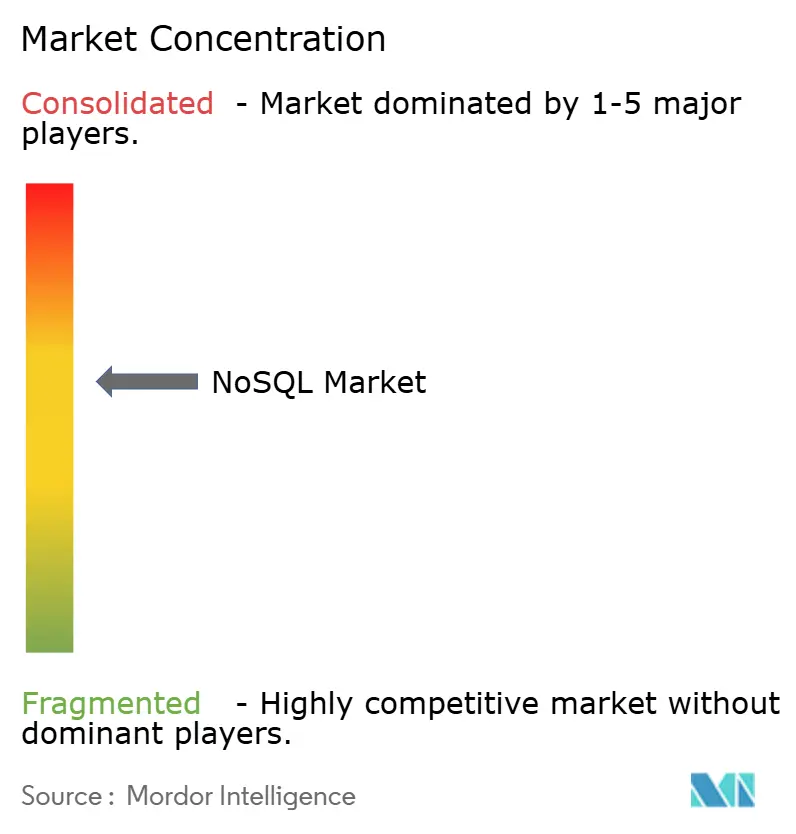
| Market Concentration | Medium |
Major Players *Disclaimer: Major Players sorted in no particular order Image © Mordor Intelligence. Reuse requires attribution under CC BY 4.0. | |
NoSQL Market Analysis by Mordor Intelligence
The NoSQL market size is expected to grow from USD 15.04 billion in 2025 to USD 19.39 billion in 2026 and is forecast to reach USD 69.09 billion by 2031 at 28.95% CAGR over 2026-2031. Accelerated enterprise reliance on flexible data models, the rise of cloud-native microservices, and generative-AI workloads underpin this expansion. Unstructured data already constitutes 93% of enterprise information assets, and its rapid growth is amplifying demand for schema-less databases. Key-value stores continue to anchor the NoSQL market thanks to sub-millisecond response times, while vector search integration is redefining competitive differentiation. Consolidation—highlighted by IBM’s 2025 agreement to acquire DataStax—signals heightened strategic interest as vendors race to bundle operational, analytical, and AI capabilities within one environment. Simultaneously, data-sovereignty regulations and cloud-cost controls are spurring interest in hybrid deployments that straddle public clouds and private infrastructure.
Key Report Takeaways
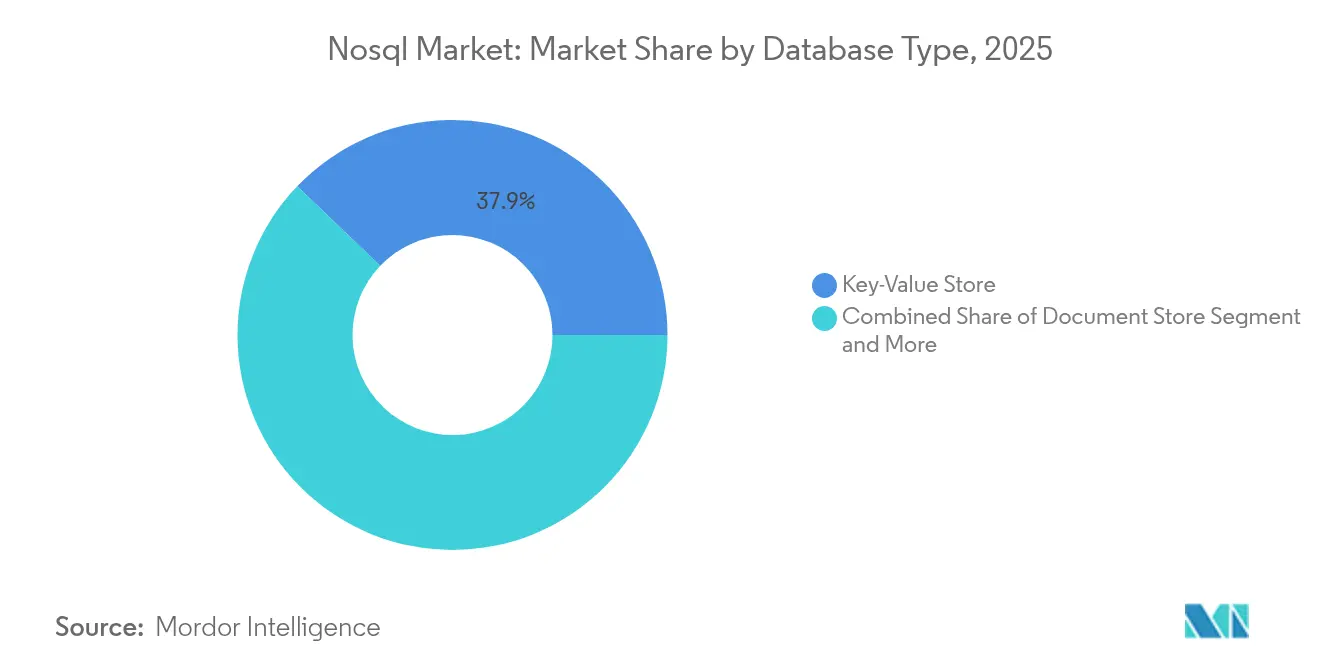
- By database type, key-value stores led with 37.85% of NoSQL market share in 2025, while graph databases are projected to grow at 29.05% CAGR through 2031.
- By deployment mode, cloud implementations held 65.25% revenue share in 2025; hybrid configurations are forecast to record the highest CAGR at 26.74% during 2026-2031.
- By application, data storage & caching accounted for 33.40% of the NoSQL market size in 2025; AI & ML workloads are advancing at 29.12% CAGR to 2031.
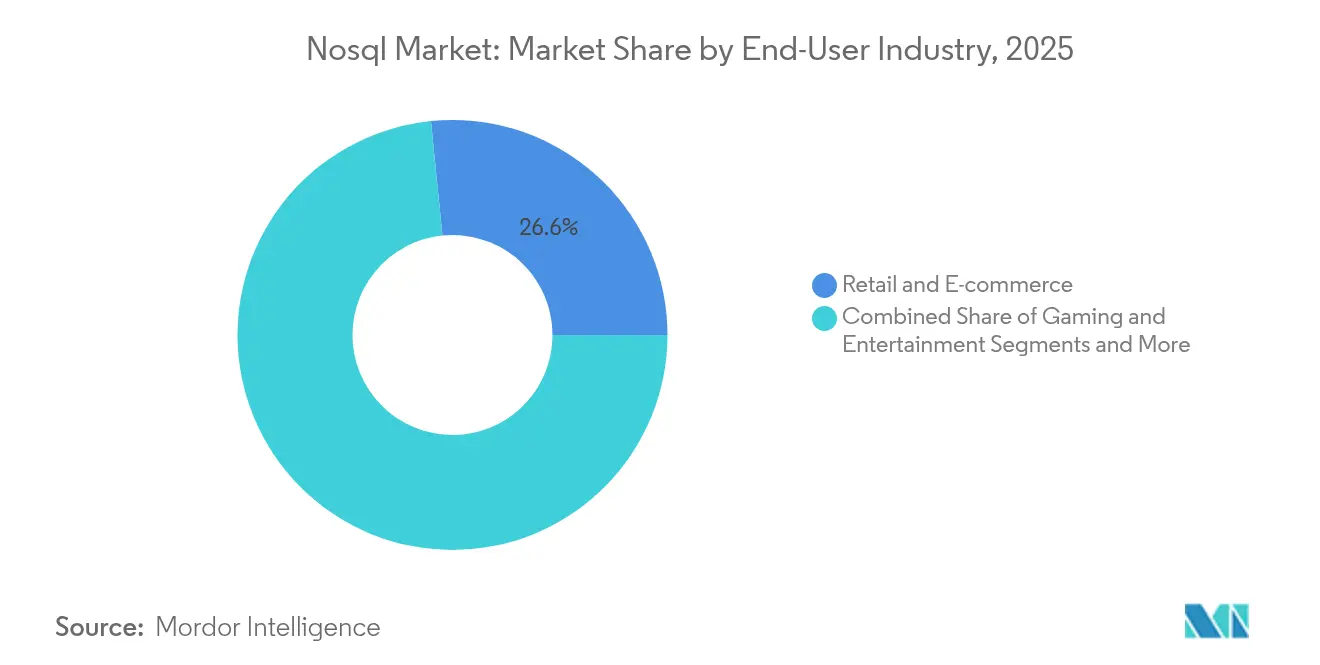
- By end-user industry, retail & e-commerce contributed 26.60% of 2025 revenue, whereas healthcare & life sciences is set to expand at a 25.58% CAGR.
- By enterprise size, large enterprises commanded 61.20% share of the NoSQL market size in 2025, but SMEs exhibit a 24.33% CAGR outlook.
- By geography, North America retained 44.40% share in 2025; Asia-Pacific is the fastest-growing geography with a 26.88% CAGR through 2031
Note: Market size and forecast figures in this report are generated using Mordor Intelligence’s proprietary estimation framework, updated with the latest available data and insights as of 2026.
Global NoSQL Market Trends and Insights
Drivers Impact Analysis*
| Driver | (~) % Impact on CAGR Forecast | Geographic Relevance | Impact Timeline |
|---|---|---|---|
| Rapid adoption of big-data analytics | +10.4% | Global, stronger in North America and Europe | Medium term (2-4 years) |
| Demand for real-time data processing | +8.4% | Global, emphasis on high e-commerce and financial hubs | Short term (≤ 2 years) |
| Shift toward cloud-native microservices | +6.6% | North America, Europe, advanced Asia-Pacific | Medium term (2-4 years) |
| Proliferation of IoT device data | +5.4% | Global, industrial hubs and smart-city programs | Long term (≥ 4 years) |
| Vector-search and GenAI embedding integration | +4.5% | North America, spreading to Europe and Asia-Pacific | Short term (≤ 2 years) |
| Data-sovereignty-driven distributed NoSQL | +3.6% | Europe, China, India, Middle East | Medium term (2-4 years) |
| Source: Mordor Intelligence | |||
Rapid adoption of big-data analytics
Organizations increasingly deploy NoSQL databases to ingest and analyze multi-modal datasets in one repository, avoiding costly ETL cycles. Retailers and banks use flexible document models to trace evolving customer behavior, enabling granular segmentation and dynamic pricing strategies. In parallel, vertical-optimized NoSQL variants—such as healthcare-focused document stores—have appeared to streamline regulatory reporting. MongoDB’s acquisition of Voyage AI underscores the pivot toward embedding-rich analytics for higher query relevance, accelerating the appeal of multi-model ecosystems[2]MongoDB, “Embedding Generative AI and Advanced Search,” mongodb.com.
Demand for real-time data processing
Sub-second decision-making in fraud detection, ad bidding, and inventory refresh is steering enterprises toward key-value and in-memory engines able to maintain throughput at web scale. Redis 8.0’s vector search allows semantic ranking and content similarity within microseconds, shrinking the gap between operational and analytical workloads. Consequently, firms consolidate OLTP and OLAP functions to cut infrastructure sprawl and licensing fees, boosting the NoSQL market across both cloud and edge footprints.
Shift toward cloud-native microservices architectures
Decoupled application stacks favor databases that scale horizontally without global downtime. Enterprises now treat the NoSQL market as core infrastructure rather than tactical add-ons, with 48% of IT leaders prioritizing hybrid cloud rollouts that keep latency-sensitive data local while bursting to public clouds for seasonal demand[1]Rackspace Technology, “2025 State of Cloud Report,” rackspace.com. Multi-model platforms that handle documents, graphs, and vectors within one engine reduce DevOps complexity, exemplified by ArangoDB’s unified interface. The resulting agility helps teams push new features weekly instead of quarterly.
Proliferation of IoT device data
Industrial facilities generate terabytes of time-series readings each day, well beyond the ingest limits of legacy RDBMS. Wide-column stores such as Apache Cassandra sustain high-velocity writes and enable roll-ups for long-term trend analytics. Edge gateways now embed lightweight NoSQL nodes, processing sensor streams locally to comply with data-residency laws and trim WAN traffic. This decentralization is expanding the addressable NoSQL market into manufacturing, energy, and smart-city domains.
Restraint Impact Analysis*
| Restraint | (~) % Impact on CAGR Forecast | Geographic Relevance | Impact Timeline |
|---|---|---|---|
| Implementation and migration complexity | -5.4% | Global, legacy-heavy regions | Medium term (2-4 years) |
| Shortage of skilled NoSQL professionals | -4.5% | Global, acute in developing economies | Short term (≤ 2 years) |
| Cloud-cost optimization driving repatriation | -3.6% | North America and Europe | Medium term (2-4 years) |
| Open-source license model uncertainty | -3.0% | Global, enterprise deployments | Long term (≥ 4 years) |
| Source: Mordor Intelligence | |||
Implementation and migration complexity
Enterprises entrenched in relational schemas face sizable refactoring when porting to NoSQL. Beyond data model redesign, teams must rebuild integrations, optimize indexing strategies, and retrain staff. Flexera’s 2025 survey found 21% of firms shifting certain workloads back on-premises after discovering cloud rewrites were cost-prohibitive. Tool vendors now offer automated schema translation and dual-write gateways, lowering risk but not eliminating it.
Shortage of skilled NoSQL professionals
Specialist know-how in Cassandra compaction tuning or graph traversal optimization remains scarce, inflating hiring costs and delaying deployments. University curricula lag industry demands, especially in emerging economies. Low-code layers such as DataStax Langflow abstract vector stores behind drag-and-drop interfaces, allowing smaller teams to launch AI features without deep internals knowledge, but the talent gap will persist into the medium term.
*Our forecasts treat driver/restraint impacts as directional, not additive. The impact forecasts reflect baseline growth, mix effects, and variable interactions.
Segment Analysis
By Database Type: Graph Databases Revolutionize Relationship Analytics
Graph engines recorded the fastest 29.05% CAGR outlook as organizations mine intricate networks spanning customers, devices, and supply chains for hidden patterns. Key-value stores nevertheless held a 37.85% NoSQL market share in 2025, demonstrating enduring demand for predictable, low-latency reads in session caching and shopping-cart operations. The NoSQL market size for graph deployments is forecast to expand sharply as cybersecurity teams adopt pathfinding queries to surface abnormal access chains.
Feature convergence defines vendor roadmaps. Document databases embed graph operators; wide-column stores add time-series roll-ups; and multi-model platforms such as ArangoDB blend graphs, documents, and vectors under one query layer. This blurring of lines helps enterprises consolidate licensing spend and simplify data governance. In-memory variants like Redis augment vector search to sustain millisecond similarity queries, aligning with AI pipelines while continuing to power traditional cache layers.


By Deployment Mode: Cloud Dominance Drives Innovation
Cloud deployments delivered 65.25% of 2025 revenue, underscoring enterprise appetite for fully managed elasticity. Within this setting, the NoSQL market size for multi-region serverless options is growing fastest, aided by consumption-based pricing that aligns overhead with demand peaks. DynamoDB’s global tables bolster latency-sensitive apps needing cross-continent consistency, fueling deeper adoption among digital-native firms.
On-premises installations remain critical for sectors with strict sovereignty mandates or deterministic latency targets. Hybrid footprints marrying local nodes with cloud replicas are gaining currency, reflected in a 26.74% CAGR momentum. Solutions that abstract topology details behind a single control plane encourage workload portability, and MongoDB Atlas exemplifies this seamless deployment narrative by offering uniform APIs across public cloud zones and customer-managed clusters.
By Application: AI and ML Workloads Drive Future Growth
Data storage and caching led with 33.40% contribution in 2025, affirming the historic role of NoSQL databases as operational backbones for high-traffic websites. Coupling cached objects with persistence has trimmed engineering toil and reduced stale-data incidents. Simultaneously, AI & ML workloads deliver the steepest 29.12% CAGR, as vector-friendly indexes enable retrieval-augmented generation pipelines that merge embeddings and metadata within one store.
Real-time analytics continues to attract budget allocation, notably in online gaming and fintech, where sub-second queries are non-negotiable. Mobile and web apps leverage auto-sharded clusters to absorb unpredictable spikes. IoT telemetry management strengthens wide-column stores’ relevance, while content management systems exploit flexible document schemas to house images, videos, and textual metadata side by side.
By End-User Industry: Healthcare Accelerates Adoption
Retail and e-commerce retained 26.60% share, harnessing document models for product catalogues and customer profiles that evolve hourly during peak holiday campaigns. Fraud detection in BFSI rests on graph traversals that uncover anomalous payment chains faster than relational joins. The NoSQL market size for healthcare and life sciences is projected to surge at 25.58% CAGR as genomic datasets and imaging archives demand horizontally scalable object storage with HIPAA controls.
Manufacturers maturing into Industry 4.0 stream unremitting sensor feeds, using time-series functions to monitor equipment anomalies in near real time. Government agencies widen smart-city deployments, blending traffic flows, weather updates, and citizen feedback—a diverse payload tailor-made for schema-flexible stores. Each vertical now benchmarks database choices on AI readiness, pushing vendors to expose embedding APIs and secure fine-grained access models.
By Enterprise Size: SMEs Embrace NoSQL Flexibility
Large enterprises dominated with 61.20% revenue share in 2025, often deploying polyglot architectures that intertwine legacy RDBMS with multiple NoSQL engines. Their investment capacity accelerates experiments across graph, document, and vector modalities. However, SMEs represent the fastest-growing cohort at 24.33% CAGR, buoyed by serverless offerings that remove cluster-ops burdens and pay-as-you-grow billing.
No-code development suites integrating document or graph stores cut delivery timelines by up to 60% versus traditional stacks, enabling SMEs to iterate customer-facing features quickly. Stack Overflow’s 2024 survey showed MongoDB leading NoSQL mindshare among developers, suggesting accessible APIs and vibrant communities are vital levers in penetrating the SME segment.
Geography Analysis
North America held 44.40% of 2025 revenue, spearheaded by United States cloud hyperscalers that bundle multiple NoSQL services. Canada follows with healthcare and fintech pilots, while Mexico accelerates retail modernization. A mature venture ecosystem and aggressive GenAI experimentation sustain top-line spend, ensuring the region remains the anchor tenant of the NoSQL market.
Asia-Pacific is the fastest-expanding theatre at 26.88% CAGR as domestic clouds in China and India broaden managed offerings tuned to local compliance codes. Southeast Asian e-commerce giants build hyper-personalization engines atop document stores, while Japanese automotive manufacturers capture edge sensor data in wide-column clusters. Data-locality statutes spur interest in globally distributed clusters that can tether shards to national borders.
Europe commands significant stake, led by the United Kingdom, Germany, and France, where GDPR compliance drives adoption of fine-grained encryption and auditing features. Nordic telcos deploy graph analytics for fraud signaling, and Southern Europe applies document stores to tourism platforms. Meanwhile, GCC economies in the Middle East deploy distributed key-value grids to underpin smart-city command centers. Brazil anchors Latin American demand, combining graph and vector search to fight payment fraud; Argentina’s mobile-app start-ups lean on serverless document stores to scale internationally without standing up regional data centers.

Competitive Landscape
The NoSQL market features moderate concentration: the top five providers aggregate roughly 60% revenue, leaving white space for vertical specialists and open-source newcomers. IBM’s proposed DataStax acquisition underscores how foundational NoSQL capabilities have become to broader AI platforms, as integrated vector search and global distribution climb executive priority lists. MongoDB catalyzes feature velocity through Voyage AI, while Couchbase injects native vector indexes into Capella to remain competitive[3]DataStax, “Healthcare,” datastax.com.
Niche disruptors carve out territory by simplifying developer workflows. Fauna promotes a serverless globally distributed architecture with strong consistency, sidestepping operational drudgery for SaaS builders. PingCAP’s TiDB straddles transactional and analytical boundaries, drawing interest from fintechs seeking single-stack architectures. Strategic alliances, such as RavenDB’s pact with QBS Software to widen European reach, highlight regional go-to-market maneuvering.
Technology differentiation now orbits AI integration, multi-model breadth, and deployment optionality across hybrid footprints. Vendors providing unified control planes that govern on-premises clusters and multiple public clouds gain procurement preference among risk-averse multinationals. Subscription revenue dominates income statements; Couchbase’s USD 209.5 million FY 2025 top line reflects the shift toward cloud-delivered database-as-a-service bundles under multi-year contracts.
NoSQL Industry Leaders
Amazon Web Services, Inc.
Microsoft Corporation
Google LLC
MongoDB, Inc.
Couchbase, Inc.
- *Disclaimer: Major Players sorted in no particular order

Recent Industry Developments
- April 2025: Google Cloud enhanced its database lineup with native vector search and AI optimizations unveiled at Next 2025.
- March 2025: RavenDB and QBS Software formed a partnership to expand NoSQL solutions across the UK and Europe.
- February 2025: IBM agreed to acquire DataStax, integrating Astra DB with watsonx for unified AI-ready data access.
- February 2025: Microsoft introduced NoSQL-style extensions to PostgreSQL, blending relational strengths with document and key-value patterns.


Research Methodology Framework and Report Scope
Market Definitions and Key Coverage
Our study defines the global NoSQL market as the revenue generated from new software licenses, cloud-based subscriptions, and managed services for non-relational databases that store, retrieve, and manage structured, semi-structured, or unstructured data using flexible schemas and horizontally scalable architectures. We view NoSQL as a technology layer rather than an application vertical, so spending linked to analytics engines or visualization tools is excluded unless bundled inside the database contract.
We therefore exclude stand-alone professional services, legacy relational maintenance, and hardware appliances that merely host NoSQL instances; we also set aside ad-hoc open-source deployments that carry no commercial support agreements.
Segmentation Overview
- By Database Type
- Document Store
- Key-Value Store
- Wide-Column Store
- Graph Database
- Multi-Model Database
- In-Memory NoSQL Database
- By Deployment Mode
- Cloud
- On-Premises
- By Application
- Data Storage and Caching
- Real-Time Analytics
- Mobile and Web Apps
- IoT and Sensor Data Management
- AI and ML Workloads
- Content Management
- By End-User Industry
- Retail and E-commerce
- Gaming and Entertainment
- IT and Telecom
- BFSI
- Healthcare and Life Sciences
- Manufacturing and Supply Chain
- Government and Public Sector
- Other Industries
- By Enterprise Size
- Large Enterprises
- Small and Medium Enterprises
- By Geography
- North America
- United States
- Canada
- Mexico
- South America
- Brazil
- Argentina
- Rest of South America
- Europe
- United Kingdom
- Germany
- France
- Italy
- Spain
- Nordics
- Rest of Europe
- Asia-Pacific
- China
- India
- Japan
- South Korea
- ASEAN
- Australia
- New Zealand
- Rest of Asia-Pacific
- Middle East and Africa
- Middle East
- Saudi Arabia
- United Arab Emirates
- Turkey
- Rest of Middle East
- Africa
- South Africa
- Egypt
- Nigeria
- Rest of Africa
- Middle East
- North America
Detailed Research Methodology and Data Validation
Primary Research
Our analysts spoke with database architects, DevOps leads, and procurement heads across North America, Europe, and Asia-Pacific, then ran follow-up surveys with cloud resellers to validate usage rates, average contract values, and migration timelines. These touchpoints helped us close information gaps and refine assumptions suggested by secondary data.
Desk Research
We began by mining tier-one public sources such as US Census ICT spend tables, Eurostat digital economy dashboards, and Japan's Ministry of Internal Affairs cloud surveys to size addressable demand. Trade bodies such as the Cloud Native Computing Foundation and the Asia Cloud Association provided statistics on project commits, contributor counts, and download velocity that signal developer traction. Company 10-Ks, S-1 filings, and quarterly cloud revenue disclosures anchored vendor benchmarks, while paid intelligence from D&B Hoovers and Dow Jones Factiva enriched financial and news context. The sources listed are illustrative; many additional references informed data collection, validation, and clarification.
Market-Sizing & Forecasting
A top-down model links overall enterprise IT outlays to the share flowing into non-relational data platforms, which is then split by industry, deployment mode, and region. Select bottom-up roll-ups, sampled average selling price multiplied by active clusters plus channel checks, are used to reconcile totals. Key variables include cloud infrastructure spend, real-time analytics workload volume, microservices per application, open-source download momentum, and pilot-to-production conversion rates. Multivariate regression projects those drivers through 2030, with scenario ranges reviewed by our interviewed experts.
Data Validation & Update Cycle
Outputs pass variance checks against independent indicators and a three-step analyst review before sign-off. Mordor refreshes the model every twelve months and publishes interim updates when material events, large funding rounds, significant price shifts, or regulatory changes, alter baseline inputs. A final pre-delivery audit ensures clients receive the most current view.
Why Mordor's Nosql Baseline Commands Reliability
Published estimates often diverge because firms choose different revenue buckets, cut-off years, and growth ramps. Our disciplined scope definition, variable-driven modeling, and annual refresh cadence narrow those gaps.
Key drivers behind external differences include whether support services are counted, how free open-source usage is monetized, and the aggressiveness of workload migration assumptions.
Benchmark comparison
| Market Size | Anonymized source | Primary gap driver |
|---|---|---|
| USD 15.04 B (2025) | Mordor Intelligence | |
| USD 11.69 B (2024) | Global Consultancy A | excludes managed service revenue and uses earlier base year |
| USD 12.30 B (2024) | Regional Consultancy A | limits scope to four verticals and applies linear growth |
| USD 15.59 B (2025) | Trade Journal B | bundles support and training income, inflating baseline |
The comparison shows that Mordor's balanced mix of scoped revenue streams, variable-led forecasting, and yearly updates delivers a dependable baseline that decision-makers can trace back to clear, repeatable steps.


Key Questions Answered in the Report
What is the current size of the NoSQL market?
The NoSQL market stands at USD 19.39 billion in 2026 and is projected to reach USD 69.09 billion by 2031.
Which database type is growing fastest within the NoSQL market?
Graph databases show the strongest momentum with a projected 29.05% CAGR through 2031.
Why are AI and ML workloads important for NoSQL adoption?
Vector search and embedding support allow NoSQL platforms to serve retrieval-augmented generation and other AI pipelines, driving the segment’s 29.12% CAGR outlook.
How are cloud-cost concerns affecting NoSQL deployments?
Sixty-nine percent of IT leaders are evaluating workload repatriation or hybrid models to trim egress and instance fees, boosting demand for platforms that operate seamlessly across cloud and on-premises environments.
Which region will see the fastest NoSQL market growth?
Asia-Pacific leads with a 26.88% CAGR forecast due to rapid digitalization, expanding cloud infrastructure, and growing data-sovereignty regulations.
What competitive strategies are vendors using to differentiate?
Leading vendors fold vector search, multi-model support, and hybrid-deployment controls into their offerings, while acquisition activity, such as IBM buying DataStax, consolidates capabilities around unified AI-ready data stacks.
Page last updated on:


