High Dynamic Range Market Size and Share
Market Overview
| Study Period | 2019 - 2030 |
|---|---|
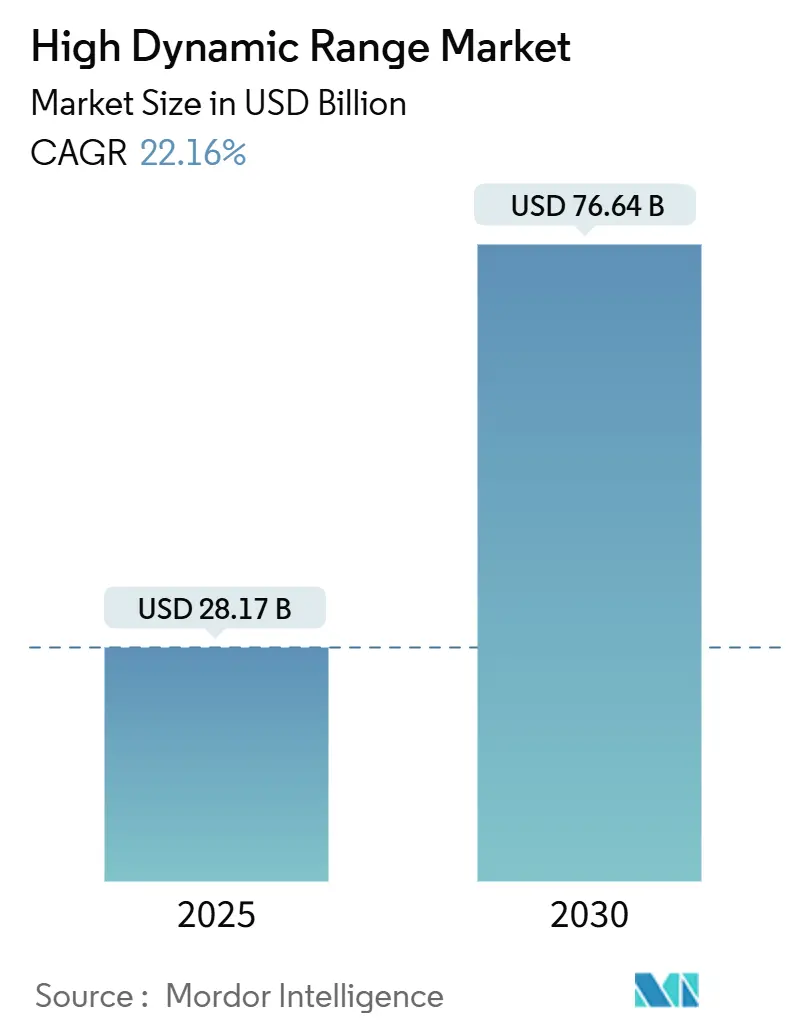
| Market Size (2025) | USD 28.17 Billion |
| Market Size (2030) | USD 76.64 Billion |
| Growth Rate (2025 - 2030) | 22.16% CAGR |
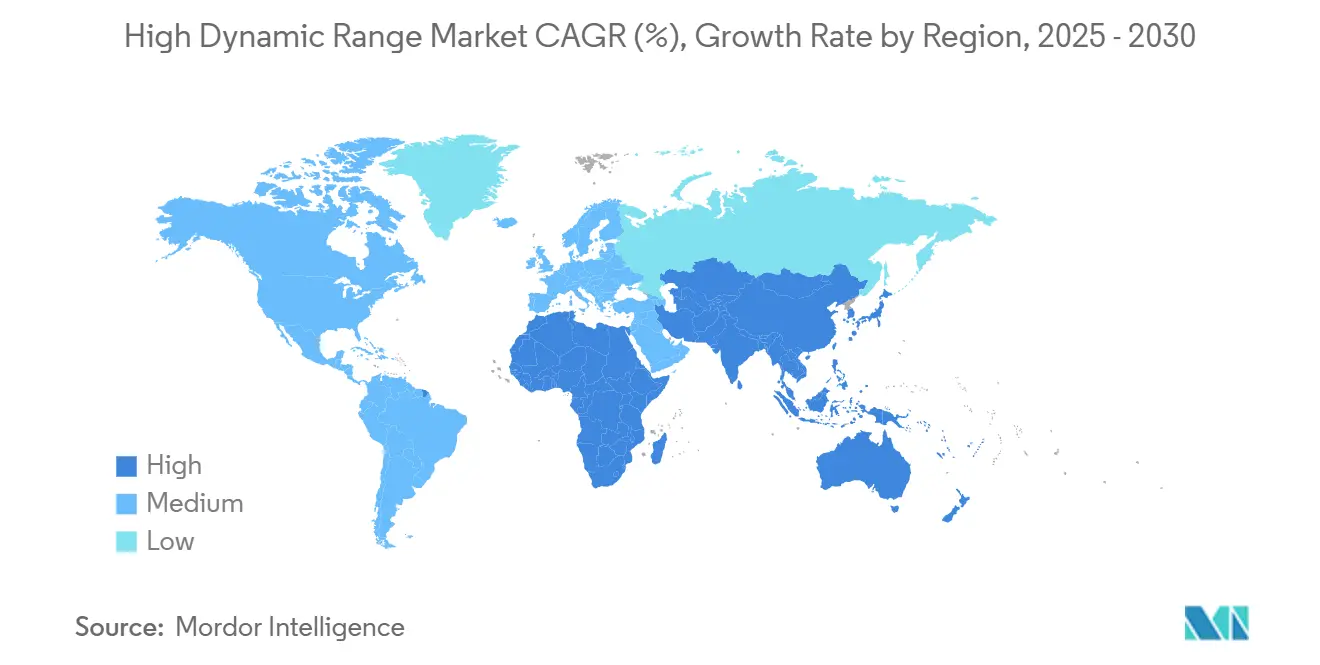
| Fastest Growing Market | Asia Pacific |
| Largest Market | North America |
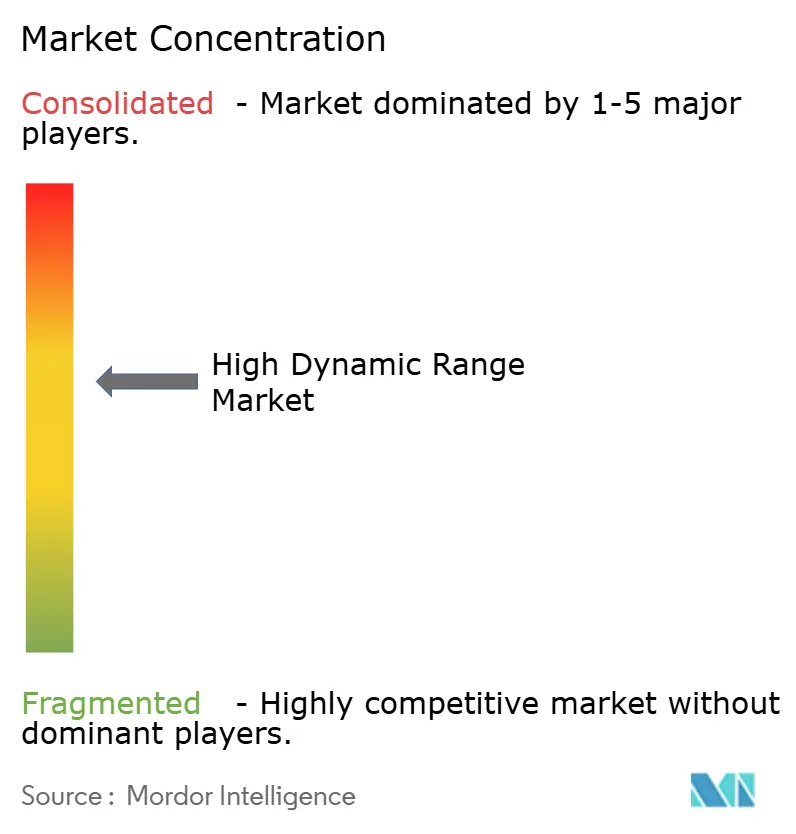
| Market Concentration | Medium |
Major Players *Disclaimer: Major Players sorted in no particular order Image © Mordor Intelligence. Reuse requires attribution under CC BY 4.0. | |
High Dynamic Range Market Analysis by Mordor Intelligence
The High Dynamic Range market size stands at USD 28.17 billion in 2025 and is projected to reach USD 76.64 billion by 2030, implying a 22.16% CAGR that signals rapid mainstream adoption. This expansion is fueled by a swelling 4K/8K television replacement wave, steep Mini-LED cost reductions that have reached virtual price parity with conventional backlights, and new automotive cockpit requirements that push brightness beyond 1,000 nits for safe daylight readability. Content availability is no longer a bottleneck; NBC’s 4K HDR coverage of Paris 2024 and CBS’s 1080p HDR workflow for Super Bowl LVIII demonstrate that dynamic-metadata production is moving from pilot projects to routine operations. Smartphones amplify the virtuous cycle; AI-driven multi-frame imaging now captures up to 20 stops of dynamic range, raising consumer expectations for every screen they own. Simultaneously, the bandwidth overhead of HDR streaming is falling thanks to codec advances, allowing platforms to prioritize HDR libraries without crippling delivery costs.
Key Report Takeaways
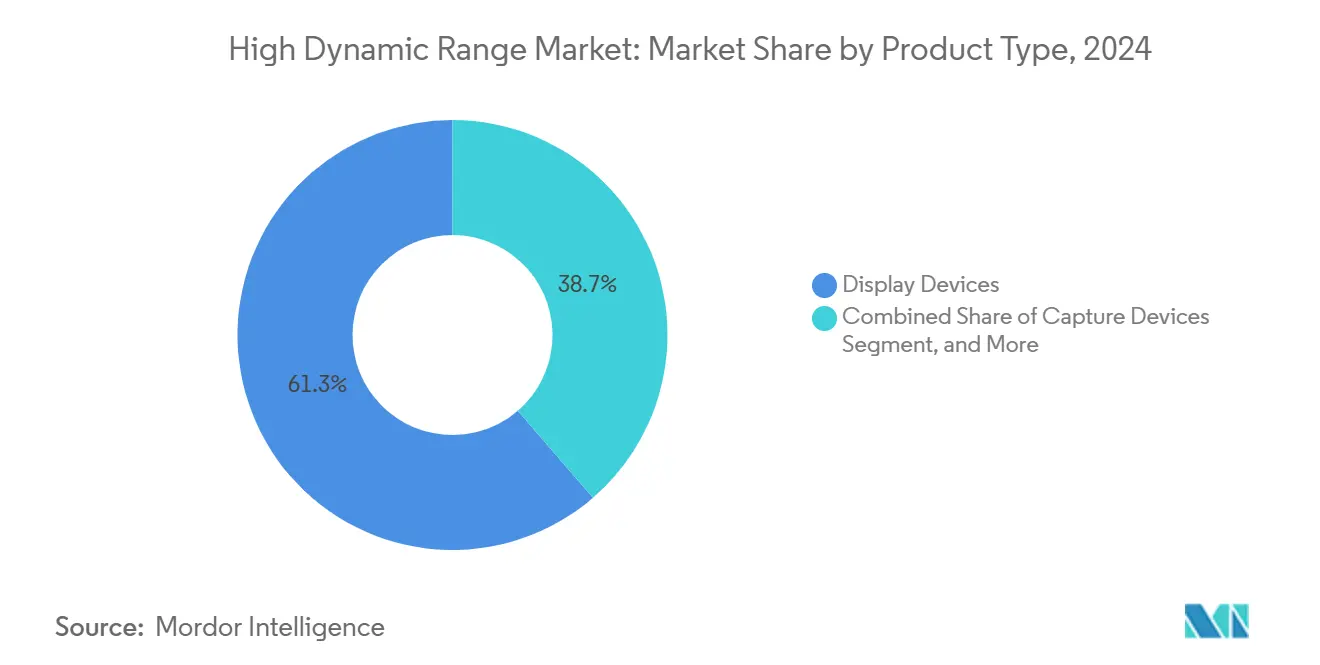
- By product type, Display Devices led with 61.34% revenue share in 2024, while Capture Devices are advancing at a 25.31% CAGR through 2030.
- By HDR format, HDR10 held 59.28% share in 2024; HDR10+ is forecast to post a 25.19% CAGR to 2030.
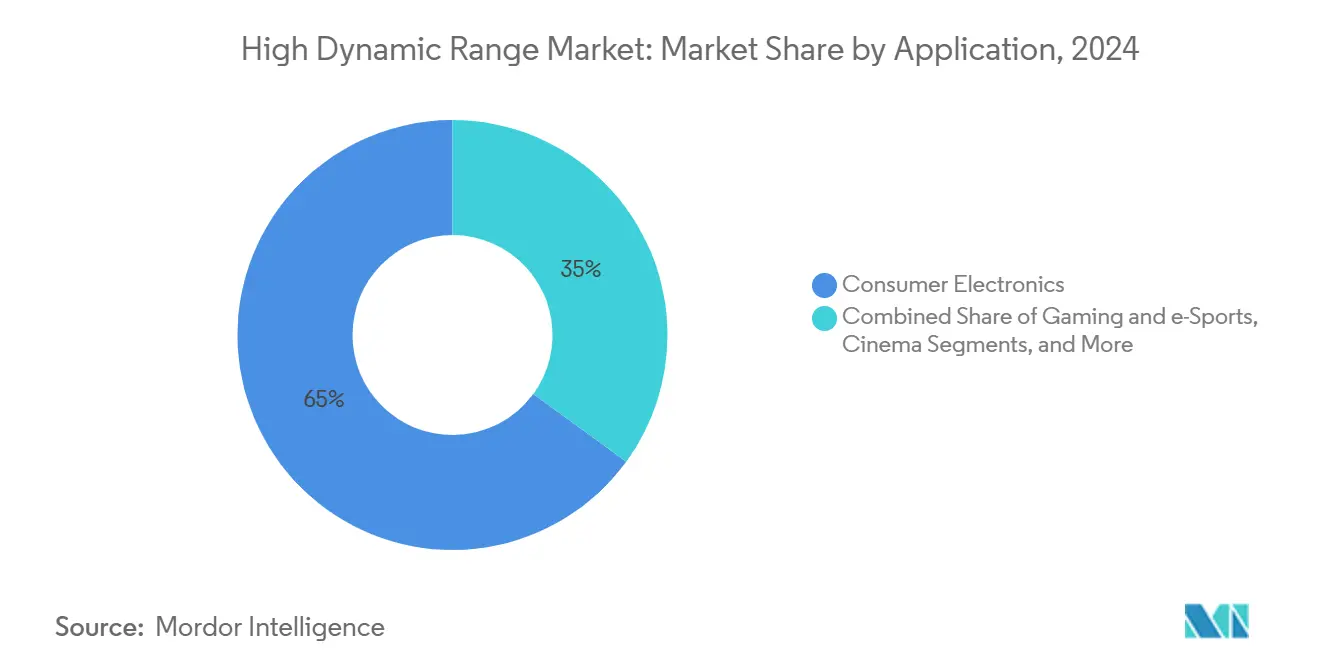
- By application, Consumer Electronics accounted for 64.97% of the High Dynamic Range market size in 2024; Gaming and e-Sports is projected to expand at a 24.56% CAGR to 2030.
- By display technology, Standard LED-Backlit LCD controlled 56.12% share of the High Dynamic Range market size in 2024, whereas Mini-LED LCD is set to record a 22.12% CAGR through 2030.
- By geography, North America led with 34.87% share in 2024, yet Asia-Pacific is on track for a 22.63% CAGR, the fastest worldwide.
Global High Dynamic Range Market Trends and Insights
Drivers Impact Analysis*
| Driver | (~) % Impact on CAGR Forecast | Geographic Relevance | Impact Timeline |
|---|---|---|---|
| Explosive 4K/8K TV replacement cycle | +4.8% | Global with early traction in North America and EU | Medium term (2-4 years) |
| Growth of HDR-enabled AAA gaming and e-sports | +3.9% | Asia-Pacific and North America hubs | Short term (≤ 2 years) |
| Rapid Mini-LED cost decline | +3.2% | Asia-Pacific manufacturing, global rollout | Medium term (2-4 years) |
| Dynamic-metadata formats earning broadcaster backing | +2.7% | North America and EU | Long term (≥ 4 years) |
| Automotive cockpit rules demanding >1,000 nits | +2.1% | EU-led, global OEM follow-through | Long term (≥ 4 years) |
| AI-powered multi-frame HDR imaging in smartphones | +1.8% | Global flagship handsets | Short term (≤ 2 years) |
| Source: Mordor Intelligence | |||
Explosive 4K/8K TV Replacement Cycle
Households are replacing legacy sets well before the seven-year mark because 4K libraries have crossed a critical mass and 8K panels have broken key price thresholds, making the upgrade decision routine rather than aspirational. [1]Advanced Television, “US Broadcasters Reach HDR Milestone,” advanced-television.com NBC’s 4K HDR Olympics feed and ESPN’s 1080p HDR college tournament broadcasts validate consumer expectations for premium pictures. NextGen TV now blankets 50% of U.S. homes with HDR-ready signals, so content scarcity no longer restrains adoption. Streaming giants amplify demand as Disney+ and Netflix add HDR10+ catalogs to differentiate offerings. Together, the hardware-and-software feedback loop keeps the High Dynamic Range market on a persistent growth slope.
Growth of HDR-enabled AAA Gaming and e-Sports
Professional gaming venues mandate 360 Hz refresh displays with DisplayHDR True Black 400 certification, forcing monitor makers to deliver HDR and ultra-high frame rates in the same package. Samsung’s five-year run at the top of the gaming monitor league underscores how HDR capability is now table stakes in competitive e-sports. QD-OLED panels unlock near-true blacks and wide color at the latency gamers require, creating decisive visual clarity for split-second choices. E-sports tournaments stream HDR feeds in-arena and online, rippling demand from pros to mainstream players. Game engines now ship with native HDR rendering pipelines, embedding HDR in the design DNA of new titles rather than treating it as an afterthought.
Rapid Mini-LED Cost Decline
Fab efficiency and local supply chains have driven Mini-LED backlight unit costs to parity with standard LED in less than two years, removing the premium surcharge that once confined the technology to flagships. Sony’s 4,000-nit RGB backlight raised the performance ceiling, forcing rivals to recalibrate roadmaps to avoid obsolescence. Chinese vendors such as TCL pivoted to domestic die procurement, chopping import duties and slashing lead times. The economic tipping point widens Mini-LED’s addressable space: from consumer TVs to professional reference monitors and sunlight-readable automotive clusters where OLED burn-in risks remain unacceptable. The confluence of lower cost and high brightness keeps Mini-LED central to the High Dynamic Range market narrative.
Dynamic-metadata Formats Winning Broadcaster Support
Gray Television’s Dolby Vision rollout and Sinclair’s embrace of Advanced HDR by Technicolor reveal how dynamic metadata is considered essential for scene-by-scene optimization that static HDR10 cannot match. [2]Digital TV News, “Gray Television Rolls Out Advanced Features with NextGen TV,” digitaltvnews.net Stations cite longer viewer dwell times and superior ad-slot premiums as tangible benefits. The competitive response is swift: broadcasters unable to match HDR fidelity risk eyeball erosion as viewers gravitate to channels with visibly better pictures. Global content houses now master files in HDR10+ and Dolby Vision simultaneously to keep distribution options fluid, reinforcing dynamic metadata’s long-term future in the High Dynamic Range industry.
Restraints Impact Analysis*
| Restraint | (~) % Impact on CAGR Forecast | Geographic Relevance | Impact Timeline |
|---|---|---|---|
| Royalty fragmentation across HDR formats | -2.8% | Global, sharpest in cost-sensitive regions | Medium term (2-4 years) |
| Limited brightness headroom in mass-market LCD panels | -2.1% | Global entry-level tiers | Long term (≥ 4 years) |
| Bandwidth premiums for HDR live streaming | -1.6% | Worldwide streamers | Short term (≤ 2 years) |
| Supply-chain exposure to high-end LED driver ICs | -1.4% | Asia-Pacific fab clusters | Medium term (2-4 years) |
| Source: Mordor Intelligence | |||
Royalty Fragmentation Across HDR Formats
Device makers juggle Dolby Vision licensing on premium SKUs while deploying royalty-free HDR10+ for midrange lines, complicating silicon roadmaps and UI designs. Each additional decoder block lifts BoM costs and increases power draw, a penalty that hurts in razor-thin margin segments. Content owners face parallel friction: crafting multiple deliverables drives up encoding labor and QC cycles, sometimes resulting in mismatched experiences when the wrong stream reaches the wrong display. [3]TV Technology, “The Many Moving Parts of the Transition to NextGen TV,” tvtechnology.comThese inefficiencies shave points off the High Dynamic Range market CAGR until the ecosystem narrows to fewer standards or patent pools harmonize.
Limited Brightness Headroom in Mass-Market LCD Panels
Entry-level LCD sets rarely top 400 nits, yet meaningful HDR impact begins at 1,000 nits. Manufacturers must choose between accepting mediocre HDR or upselling consumers into Mini-LED or OLED tiers. Edge-lit tricks help marginally but trade off uniformity, exposing banding that erodes consumer trust. Automotive dashboards amplify the issue: federal visibility rules prescribe >1,000 nits, forcing carmakers to bypass commodity panels entirely, which slows price-down cycles in lower trims. Until low-cost panels break the brightness ceiling, the High Dynamic Range market risks a two-tier experience that tempers mass adoption.
*Our forecasts treat driver/restraint impacts as directional, not additive. The impact forecasts reflect baseline growth, mix effects, and variable interactions.
Segment Analysis
By Product Type: Capture Devices Propel Professional Uptake
Capture Devices grow at a 25.31% CAGR, outpacing all other categories despite Display Devices commanding 61.34% of 2024 revenue. The High Dynamic Range market size for Capture Devices is on track to more than triple by 2030 as film crews demand native 17-stop cameras such as ARRI ALEXA 35 that dominated Sundance 2025. Digital cinema cameras no longer chase resolution alone; dynamic range has become the trait that secures festival placements and streaming deals. Smartphones echo that trajectory: Apple’s 20-stop computational patent is already informing next-gen image sensors, broadening the creator base.
Growth continues because broadcasters are revamping studio pipelines in parallel. Content processing and encoding gear that handles Dolby Vision or HDR10+ metadata now appears on every cap-ex roadmap, while reference-grade HDR monitors shore up QC suites to guarantee color integrity end-to-end. As professional output climbs, downstream demand for HDR displays multiplies, reinforcing a self-sustaining loop inside the High Dynamic Range market.


By HDR Format: HDR10+ Eats Into Static Leadership
HDR10 still owns 59.28% share, but HDR10+ is posting a 25.19% CAGR as manufacturers chase royalty-free economics. The High Dynamic Range market share for HDR10 is expected to erode steadily because buyers associate dynamic metadata with visibly better contrast in mixed-scene content. Dolby Vision retains brand cachet yet faces value erosion unless it bundles exclusive studio partnerships.
Hybrid Log-Gamma thrives in live broadcast where SDR backward compatibility is paramount, notably in Japan and the U.K. Meanwhile, Advanced HDR by Technicolor leapfrogs static options in Sinclair’s network, showing that broadcasters can tip format momentum through infrastructure alliances alone. Over time, the field should coalesce around two dynamic metadata giants plus HLG for legacy chains.
By Application: Gaming Overtakes Passive Viewing
Consumer Electronics generated 64.97% of 2024 revenue, but Gaming and e-Sports is sprinting at a 24.56% CAGR. Esports arenas now spec HDR-certified monitors for both athlete stations and audience walls, dialing up visual engagement that sponsors can monetize. Monitor makers lean into QD-OLED for near-instant pixel response, while Mini-LED proves resilient in long-hour tournaments that expose burn-in issues.
Professional broadcasters are the next demand node. CBS’s successful 1080p HDR Super Bowl pipeline showed that bandwidth constraints no longer preclude HDR once workflows mature. Automotive follows close behind: EU cockpit mandates make >1,000 nits non-negotiable. Security surveillance also climbs as HDR enables full-color footage under street-lamp lux levels, widening use cases well beyond entertainment.
By Display Technology: Mini-LED Challenges OLED at the Top
Standard LED-Backlit LCD maintains volume heft with 56.12% share, yet Mini-LED’s 22.12% CAGR makes it the technological centerpiece of the High Dynamic Range industry roadmap. Sony’s 4,000-nit prototype set a new bar, neutralizing OLED’s one-time brightness advantage and resetting customer expectations. OEMs now segment portfolios by brightness longevity rather than contrast alone. OLED and QD-OLED still dominate gaming where dark-scene fidelity decides matches, but Mini-LED is finding favor in automotive and pro graphics.
Quantum-Dot LCD acts as a stepping-stone for midrange shoppers, giving them wider color without OLED’s price premium. Micro-LED remains aspiration only, but its lab milestones keep incumbent vendors vigilant. In sum, efficacy versus cost is sorting technologies into niches, and Mini-LED’s improving yield curves keep it pivotal to the High Dynamic Range market growth narrative.
Geography Analysis
North America led 2024 with 34.87% of global revenue as early HDR broadcasting and deep streaming catalogs nurtured an informed buyer base. Hollywood and national sports leagues supply a steady flow of HDR content, further fortifying upgrade incentives. Yet competitive gravity is shifting. Asia-Pacific is forecast to post a 22.63% CAGR through 2030, the fastest worldwide, because China’s government-backed trade-in programs subsidize premium TV buys while regional giants Samsung and LG combine capacity expansions with aggressive panel roadmaps to keep price curves descending.
China itself embodies the hardware flywheel. Domestic fabs like BOE and CSOT scale Mini-LED tooling while licensing HDR10+ royalty-free to remove cost drag. Concurrently, South Korea’s new multi-year OLED supply pact guarantees that panel shortages will not impede premium tier growth, giving downstream brands the confidence to commit to HDR-only product lines. India is emerging as an assembly hub for midrange HDR televisions, leveraging production-linked incentives to attract foreign lines and capture export share within the High Dynamic Range market.
Europe remains a mature but vital arena. Automakers headquartered in Germany and Sweden must meet cockpit brightness regulations, making HDR displays a compliance requirement rather than an upsell. Broadcast Europe leans heavily on HLG for live events to keep backward compatibility, yet the region’s premium cinema chains already grade features in Dolby Vision, maintaining top-end demand. The Middle East and Africa, though smaller, enjoy greenfield infrastructure rollouts that allow direct jumps to NextGen TV and fiber streaming, positioning them as late-cycle accelerants once device ASPs fall.

Competitive Landscape
The High Dynamic Range market is moderately concentrated. Samsung and LG anchor the top tier through vertical integration that spans panel fabs to picture-processing ASICs, but Chinese rivals erode share by localizing Mini-LED supply chains and eliminating dollar-denominated royalty exposure. Samsung’s 34.7% share in OLED monitors showcases how tactical product focus can carve out sizable niches even within crowded segments.
Partnerships are the strategy of choice. Samsung and LG’s five-year OLED panel accord secures 5 million units, mitigating capacity risk while allowing each brand to innovate on software and industrial design. Meanwhile, American broadcasters align with Dolby Laboratories or Technicolor to secure differentiated pipelines that advertisers can monetize. Patent filings for AI-calculated tone-mapping reveal that IP is supplanting scale as the lever for sustainable advantage. Niche vendors such as Atomos flourish by delivering HDR field monitors to film crews, exploiting gaps that giants overlook.
Supply chain stress lingers at the high-end driver IC layer; capacity bottlenecks in 10-bit source drivers temporarily cap output, forcing producers to stagger launches. Overall, competitive dynamics are tilting from raw panel economics to holistic experience delivery, where format support, ecosystem services, and post-sale firmware updates decide brand loyalty inside the High Dynamic Range market.
High Dynamic Range Industry Leaders
Samsung Electronics Co., Ltd.
LG Electronics Inc.
Sony Group Corporation
Hisense Visual Technology Co., Ltd.
TCL Technology Group Corporation
- *Disclaimer: Major Players sorted in no particular order

Recent Industry Developments
- May 2025: Samsung gained 34.7% OLED monitor share within a year of product launch, highlighting the potency of gaming-centric HDR offerings.
- March 2025: Harmonic showcased cloud workflows that cut HDR delivery bandwidth at NAB 2025.
- February 2025: ESPN used a 1080p HDR live pipeline for the NCAA Women’s Basketball Final Four with 4K upconversion for OTT distribution.
- January 2025: Fox deployed a 1080p-to-4K HDR upscaling chain for Super Bowl 2025, confirming HDR deliverability even in bandwidth-capped venues.


Global High Dynamic Range Market Report Scope
| Display Devices | Televisions |
| Monitors | |
| Smartphones and Tablets | |
| VR/AR Headsets | |
| Automotive Displays | |
| Cinema Screens | |
| Capture Devices | Digital Cameras |
| Smartphone Image Sensors | |
| Broadcast/Studio Cameras | |
| Content Processing and Encoding Solutions | |
| HDR Monitoring and Measurement Instruments |
| HDR10 (Static) |
| HDR10+ (Dynamic) |
| Dolby Vision |
| Hybrid Log-Gamma (HLG) |
| Advanced HDR by Technicolor |
| Consumer Electronics |
| Gaming and e-Sports |
| Professional/Broadcast |
| Cinema |
| Automotive |
| Security and Surveillance |
| Mini-LED LCD |
| OLED / QD-OLED |
| Quantum-Dot LCD (QLED) |
| Micro-LED |
| Standard LED-Backlit LCD |
| North America | United States | |
| Canada | ||
| Mexico | ||
| South America | Brazil | |
| Argentina | ||
| Rest of South America | ||
| Europe | Germany | |
| United Kingdom | ||
| France | ||
| Russia | ||
| Rest of Europe | ||
| Asia-Pacific | China | |
| Japan | ||
| India | ||
| South Korea | ||
| Australia | ||
| Rest of Asia-Pacific | ||
| Middle East and Africa | Middle East | Saudi Arabia |
| United Arab Emirates | ||
| Rest of Middle East | ||
| Africa | South Africa | |
| Egypt | ||
| Rest of Africa | ||
| By Product Type | Display Devices | Televisions | |
| Monitors | |||
| Smartphones and Tablets | |||
| VR/AR Headsets | |||
| Automotive Displays | |||
| Cinema Screens | |||
| Capture Devices | Digital Cameras | ||
| Smartphone Image Sensors | |||
| Broadcast/Studio Cameras | |||
| Content Processing and Encoding Solutions | |||
| HDR Monitoring and Measurement Instruments | |||
| By HDR Format | HDR10 (Static) | ||
| HDR10+ (Dynamic) | |||
| Dolby Vision | |||
| Hybrid Log-Gamma (HLG) | |||
| Advanced HDR by Technicolor | |||
| By Application | Consumer Electronics | ||
| Gaming and e-Sports | |||
| Professional/Broadcast | |||
| Cinema | |||
| Automotive | |||
| Security and Surveillance | |||
| By Display Technology | Mini-LED LCD | ||
| OLED / QD-OLED | |||
| Quantum-Dot LCD (QLED) | |||
| Micro-LED | |||
| Standard LED-Backlit LCD | |||
| By Geography | North America | United States | |
| Canada | |||
| Mexico | |||
| South America | Brazil | ||
| Argentina | |||
| Rest of South America | |||
| Europe | Germany | ||
| United Kingdom | |||
| France | |||
| Russia | |||
| Rest of Europe | |||
| Asia-Pacific | China | ||
| Japan | |||
| India | |||
| South Korea | |||
| Australia | |||
| Rest of Asia-Pacific | |||
| Middle East and Africa | Middle East | Saudi Arabia | |
| United Arab Emirates | |||
| Rest of Middle East | |||
| Africa | South Africa | ||
| Egypt | |||
| Rest of Africa | |||


Key Questions Answered in the Report
What is the projected value of the High Dynamic Range market in 2030?
It is forecast to reach USD 76.64 billion, reflecting a 22.16% CAGR from 2025.
Which product type is expanding fastest in HDR?
Capture Devices are growing at 25.31% CAGR as professional creators migrate to HDR-native workflows.
Why is Asia-Pacific the fastest-growing HDR region?
Trade-in subsidies, robust panel manufacturing, and strategic OLED alliances push a 22.63% CAGR through 2030.
How do dynamic-metadata formats benefit broadcasters?
Scene-by-scene tone mapping boosts picture quality, raises viewer engagement, and attracts premium ad rates.
What limits HDR adoption in entry-level TVs?
Mass-market LCD panels cap peak brightness below 400 nits, delivering lackluster HDR that deters upgrades.
Which display technology now rivals OLED for brightness?
Mini-LED, with Sony’s 4,000-nit prototype, matches or exceeds OLED luminance while sidestepping burn-in risk.
Page last updated on:


