Green Fertilizer Market Size and Share
Market Overview
| Study Period | 2021 - 2031 |
|---|---|
| Market Size (2026) | USD 2.97 Billion |
| Market Size (2031) | USD 3.97 Billion |
| Growth Rate (2026 - 2031) | 6.00% CAGR |
| Fastest Growing Market | Asia-Pacific |
| Largest Market | Europe |
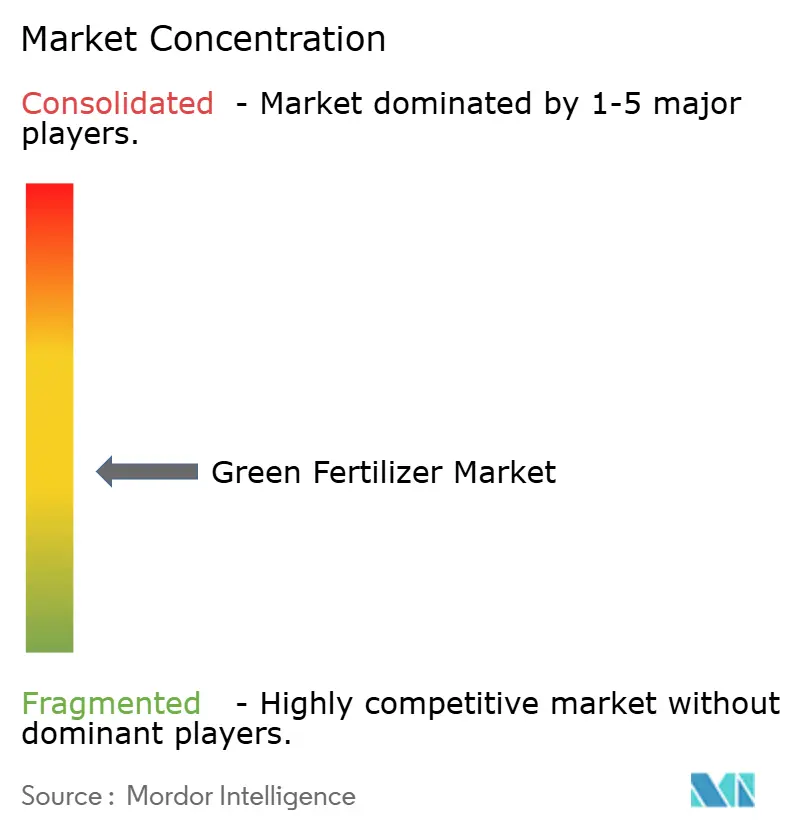
| Market Concentration | Medium |
Major Players *Disclaimer: Major Players sorted in no particular order Image © Mordor Intelligence. Reuse requires attribution under CC BY 4.0. | |
Green Fertilizer Market Analysis by Mordor Intelligence
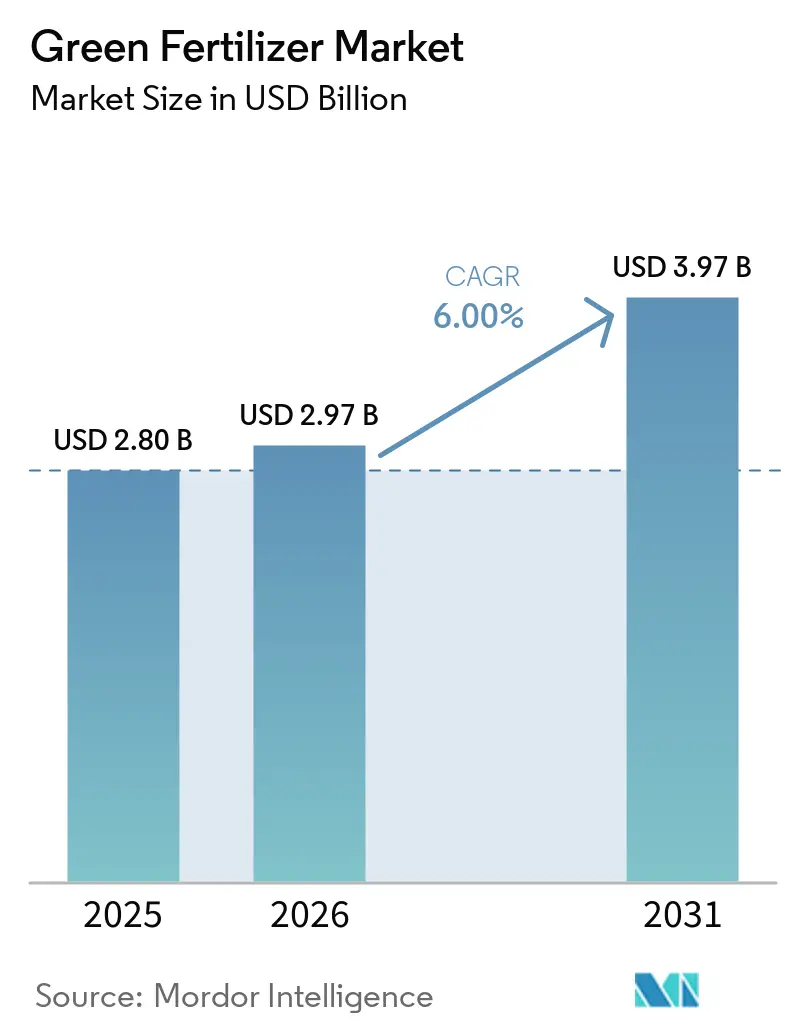
The green fertilizer market size is projected to grow from USD 2.80 billion in 2025 to USD 2.97 billion in 2026 and is anticipated to reach USD 3.97 billion by 2031, registering a CAGR of 6.0% during the period 2026-2031. Energy-transition policies are influencing nitrogen economics as ammonia serves a dual role as a crop nutrient and as an emerging maritime fuel, creating new demand opportunities. Carbon border adjustment mechanisms and Japan’s contract-for-difference scheme are shifting green-premium tolerance from voluntary adoption to compliance requirements, narrowing the price gap between conventional and green ammonia. Declining renewable power costs, combined with clean-hydrogen tax credits, are reducing payback periods for electrolyzer projects. Additionally, municipal waste-to-hydrogen initiatives are driving circular-economy efforts, while precision-agriculture tools are broadening the market for liquid blends that minimize volatilization losses.
Key Report Takeaways
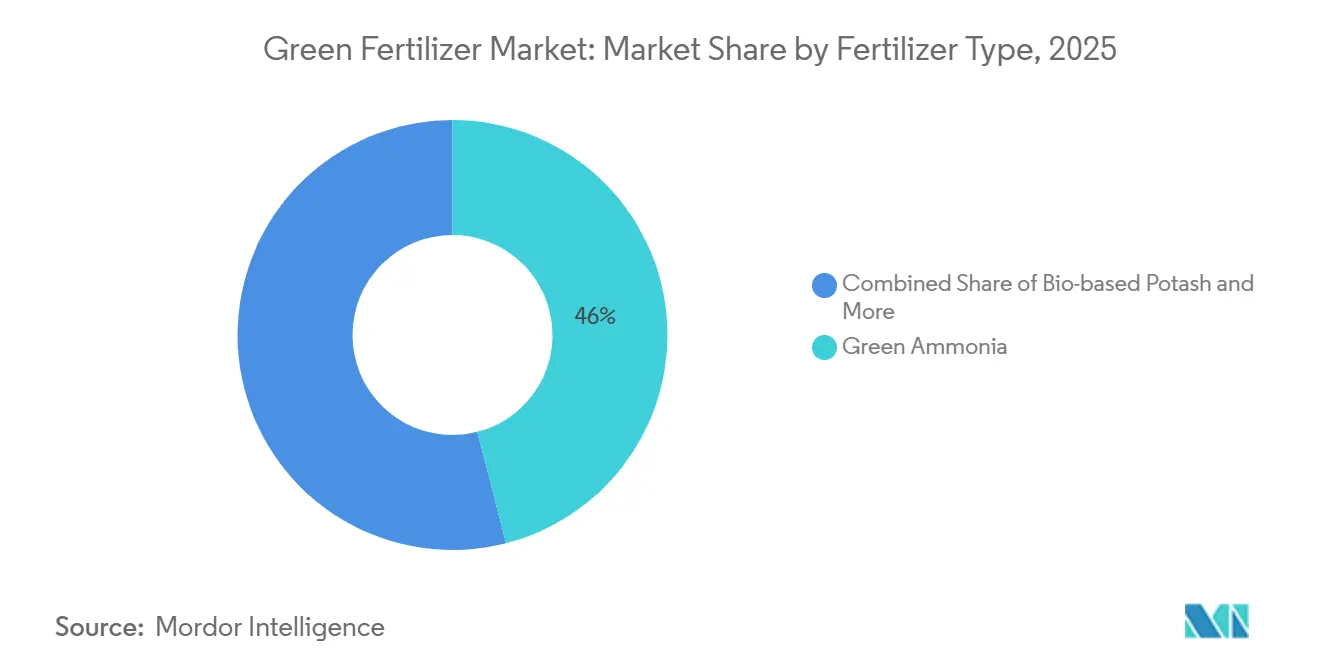
By fertilizer type, green ammonia held the largest 46% of the green fertilizer market share in 2025, while bio-based potash is projected to grow at the fastest 9.0% CAGR from 2026 to 2031.
By source technology, electrolytic hydrogen accounted for the largest share of the green fertilizer market in 2025, at 54%, whereas waste-to-hydrogen is projected to expand at the fastest 10.0% CAGR from 2026 to 2031.
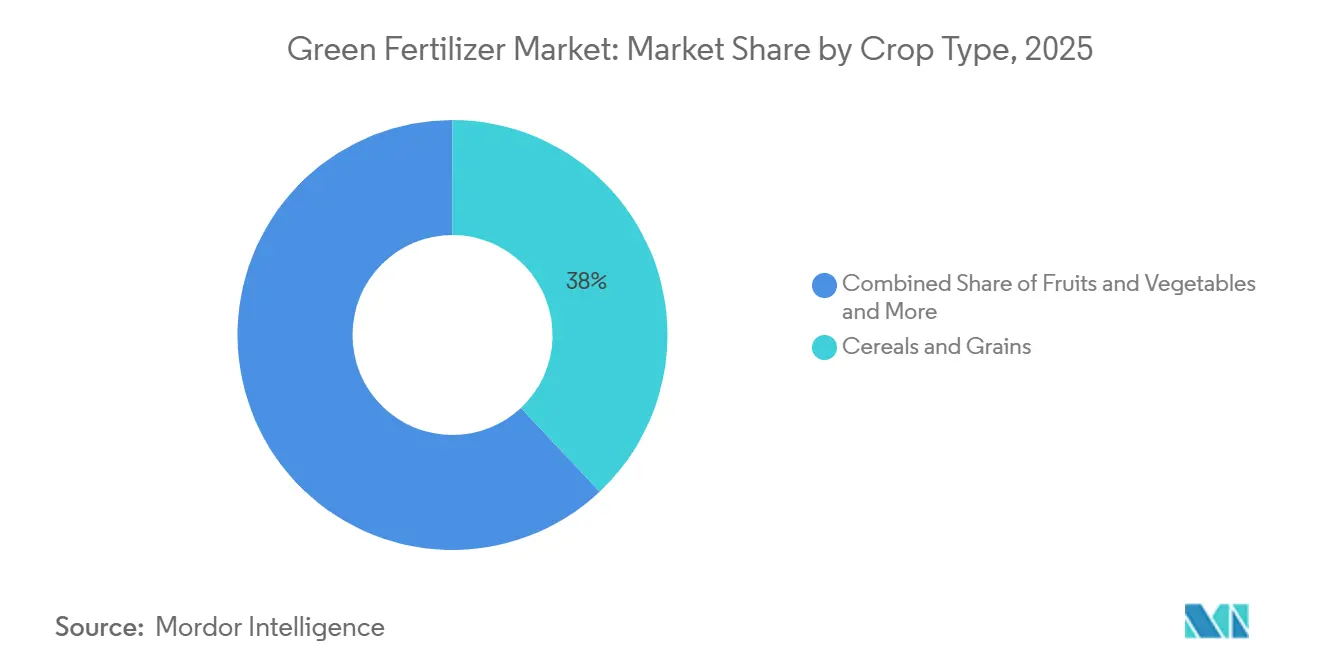
By crop type, cereals and grains captured the largest 38% of the green fertilizer market share in 2025, while fruits and vegetables are anticipated to grow at the fastest 7.5% CAGR from 2026 to 2031.
By form, solid held the largest 65% of the green fertilizer market share in 2025, whereas liquid is projected to grow at the fastest 7.2% CAGR from 2026 to 2031.
By geography, Europe commanded the largest 32% of the green fertilizer market share in 2025, while Asia-Pacific is forecast to grow at the fastest 7.8% CAGR from 2026 to 2031.
Note: Market size and forecast figures in this report are generated using Mordor Intelligence’s proprietary estimation framework, updated with the latest available data and insights as of January 2026.
Global Green Fertilizer Market Trends and Insights
Drivers Impact Analysis*
| Driver | (~) % Impact on CAGR Forecast | Geographic Relevance | Impact Timeline |
|---|---|---|---|
| Carbon-neutral fertilizer mandates | +1.2% | Europe, Japan, and South Korea | Medium term (2–4 years) |
| Renewable-power cost parity | +1.0% | Middle East, Australia, and Chile | Short term (≤ 2 years) |
| Corporate net-zero farming programs | +0.8% | Global (North America and Europe focus) | Medium term (2–4 years) |
| Ammonia bunkering demand pull-through for maritime fuel | +0.9% | Europe, Asia-Pacific, and Norway | Long term (≥ 4 years) |
| Carbon border adjustment mechanisms | +0.7% | European Union and trade partners | Short term (≤ 2 years) |
| Green-hydrogen tax credits in the United States | +0.6% | United States (Gulf Coast and Midwest) | Medium term (2–4 years) |
| Source: Mordor Intelligence | |||
Carbon-Neutral Fertilizer Mandates
Carbon-neutral fertilizer mandates are driving the adoption of low-emission nitrogen inputs through binding regulatory frameworks. According to the European Commission, the Effort Sharing Regulation (ESR) requires EU member states to achieve a 40% reduction in greenhouse gas emissions by 2030 in non-Emissions Trading System (ETS) sectors, including agriculture. This regulation is compelling fertilizer producers to decarbonize production processes and transition to green ammonia and renewable-based inputs to meet regulatory deadlines and avoid carbon-related penalties.
Renewable-Power Cost Parity
Reductions in renewable power costs play a crucial role in improving the economics of green fertilizers by decreasing hydrogen production expenses. According to the International Energy Agency's Global Hydrogen Review 2024, the cost gap between low-emissions hydrogen and fossil-based hydrogen is projected to shrink from USD 1.5–8/kg in 2024 to USD 1–3/kg by 2030 [1]Source: International Energy Agency (IEA), Global Hydrogen Review 2024, iea.org. This reduction is primarily attributed to the availability of low-cost renewable electricity and the scaling up of electrolyzer deployment. The narrowing cost gap enhances the competitiveness of green ammonia and fertilizers, particularly in regions with abundant and affordable solar and wind energy resources, such as the Middle East, Australia, and Chile.
Corporate Net-Zero Farming Programs
Corporate sustainability commitments are increasingly shaping agricultural supply chains, with fertilizers being a major contributor to emissions. Food and beverage companies are working with input providers to adopt low-carbon and green fertilizers, targeting measurable emission reductions in sourcing activities. These efforts include long-term supply agreements, farmer incentives, and certification systems to ensure consistent demand for sustainable inputs. Agrochemical companies are also promoting carbon-reduction farming initiatives, encouraging farmers to transition to bio-based fertilizers through premium pricing models and support programs. This alignment between sustainability goals and farming practices is driving global green fertilizer adoption.
Ammonia Bunkering Demand Pull-Through for Maritime Fuel
Ammonia bunkering is emerging as a strong growth avenue for green fertilizers as maritime decarbonization accelerates infrastructure development. According to the Port of Rotterdam Authority, in April 2025, the port completed its first ship-to-ship ammonia bunkering pilot involving 800 cubic meters of ammonia transfer, demonstrating operational readiness for ammonia as a marine fuel [2]Source: Port of Rotterdam Authority, Ammonia Bunkering Pilot (April 2025), portofrotterdam.com . This milestone reflects the transition toward ammonia-based fuel ecosystems, where long-term maritime fuel contracts offer higher volume certainty compared to seasonal fertilizer demand. As ports expand such infrastructure, producers are increasingly aligning output toward dual-use markets, strengthening demand visibility for green ammonia and fertilizers.
Restraints Impact Analysis*
| Restraint | (~) % Impact on CAGR Forecast | Geographic Relevance | Impact Timeline |
|---|---|---|---|
| High capital intensity of electrolyzers above 1 GW | -0.5% | Global (North America and Europe focus) | Medium term (2–4 years) |
| Grid congestion limiting renewable Power Purchase Agreements in key hubs | -0.4% | Texas, California, Germany, and Australia | Short term (≤ 2 years) |
| Scarcity of certified green water resources in arid zones | -0.3% | Middle East, North Africa, and Australia | Long term (≥ 4 years) |
| Slow agronomic validation data for novel formulations | -0.2% | Global (bio-based and liquid products focus) | Medium term (2–4 years) |
| Source: Mordor Intelligence | |||
High Capital Intensity of Electrolyzers Above 1 GW
High capital intensity remains a significant barrier to the development of large-scale green fertilizer projects, primarily due to delays in project realization and financing difficulties. According to the International Energy Agency's Global Hydrogen Review 2024, only approximately 4% of the global electrolyzer project pipeline estimated at around 520 GW by 2030 has reached the final investment decision stage or is under construction. This underscores the considerable investment and execution challenges faced by the industry. The limited transition from announced capacity to operational projects highlights the substantial capital demands and financial risks associated with gigawatt-scale electrolyzer facilities, thereby hindering the expansion of green hydrogen production and its downstream application in green fertilizer manufacturing.
Grid Congestion Limiting Renewable Power Purchase Agreements in Key Hubs
Grid congestion is increasingly hindering the integration of renewable energy, delaying the execution of power purchase agreements for green fertilizer projects. The Electric Reliability Council of Texas (ERCOT) reported that by 2026, the interconnection queue had grown to approximately 410 GW of requests, significantly surpassing the state’s peak demand and highlighting severe transmission bottlenecks. This substantial backlog suggests multi-year delays for renewable projects seeking grid access, limiting the availability of low-cost electricity. Consequently, developers are exploring alternative solutions, such as off-grid renewable systems, which increase production costs and slow the scalability of green ammonia and fertilizer production.
*Our forecasts treat driver/restraint impacts as directional, not additive. The impact forecasts reflect baseline growth, mix effects, and variable interactions.
Segment Analysis
By Fertilizer Type: Ammonia Anchors While Potash Accelerates
Green ammonia held the largest 46.0% of the green fertilizer market share in 2025, supported by compatibility with existing ammonia-based fertilizer infrastructure and its dual application across agriculture and emerging fuel markets. Its scalability is supported by established production methods, such as retrofitting the Haber-Bosch process with renewable hydrogen. At the same time, bio-based potash is gaining momentum due to regulatory support for waste-derived nutrients and its contribution to sustainable soil management. These factors collectively reinforce ammonia's market dominance while positioning potash as a niche but rapidly growing segment.
Bio-based potash market size is projected to grow at the fastest 9.0% CAGR from 2026 to 2031, driven by increasing adoption of circular nutrient recovery systems and demand for sustainable alternatives in high-value crops. Growth is further supported by policy incentives promoting the use of recycled and bio-based inputs. In contrast, ammonia benefits from scale advantages due to established logistics and widespread agronomic acceptance. This creates a dual-track market structure, with ammonia dominating in volume while bio-based potash expands in premium and environmentally regulated applications.


By Source Technology: Electrolysis Leads, Waste Routes Surge
Electrolytic hydrogen (renewable energy) accounted for the largest 54.0% of the green fertilizer market share in 2025, supported by strong policy backing and increasing deployment of renewable-powered hydrogen production systems. Its prominence is attributed to its scalability and alignment with decarbonization goals across the energy and agriculture industries. Additionally, waste-derived hydrogen pathways are gaining traction due to their ability to utilize municipal and industrial waste streams, enabling localized production and supporting circular economy initiatives.
Waste-to-hydrogen is projected to grow at the fastest 10.0% CAGR from 2026 to 2031, driven by increasing interest in resource efficiency and waste management solutions. While electrolysis remains dominant due to well-defined regulatory frameworks and steady investment, waste-based hydrogen production is expanding in regions with abundant feedstock availability. This trend highlights a geographic distinction, with renewable-rich areas favoring electrolysis and waste-dense regions adopting alternative hydrogen production technologies.
By Crop Type: Cereals Lead, Horticulture Sprints
Cereals and grains captured the largest 38.0% of the green fertilizer market share in 2025, driven by extensive cultivation areas and high nitrogen demand. This dominance is further supported by established large-scale farming practices and traditional fertilizer usage patterns. The segment's growth is underpinned by the critical role of cereals and grains as staple crops, necessitating consistent yield and soil fertility management. Additionally, the increasing focus on sustainability within global grain supply chains has amplified the demand for green nitrogen inputs, ensuring the segment remains a key contributor to the green fertilizer market.
Fruits and vegetables are projected to grow at the fastest 7.5% CAGR from 2026 to 2031, supported by rising demand for sustainable and high-quality produce. The adoption of advanced agricultural practices, such as precision farming techniques and fertigation systems, is driving the use of specialized green fertilizers in horticulture. This segment also benefits from stronger pricing power and procurement standards focused on sustainability. As consumer preferences shift toward environmentally friendly produce, the fruits and vegetables segment is projected to outpace bulk cereal applications in growth, solidifying its position in the market.
By Form: Solid Commands While Liquid Gains Precision Edge
Solid fertilizers accounted for the largest share, 65.0%, of the green fertilizer market share in 2025. This dominance is attributed to their ease of storage, transportation, and compatibility with conventional farming equipment. Their established supply chains and cost-effectiveness make them the preferred option for large-scale agricultural operations, particularly in staple crop production. Solid fertilizers are extensively used in cereals and grains due to their ability to provide nutrients over extended periods and support bulk application methods. Additionally, their stability under varying environmental conditions enhances their adoption, especially in regions with limited infrastructure and advanced application technologies.
Liquid fertilizers are projected to grow at the fastest CAGR of 7.2% from 2026 to 2031. This growth is driven by the increasing adoption of precision agriculture and irrigation-based nutrient delivery systems. Liquid formulations offer improved nutrient absorption and reduced losses, making them particularly suitable for high-value crops. Their compatibility with fertigation and controlled application systems enables farmers to optimize nutrient use efficiency and enhance crop performance. This trend reflects a growing focus on efficiency and environmental compliance, especially in regions with strict runoff regulations and heightened awareness of sustainable farming practices.
Geography Analysis
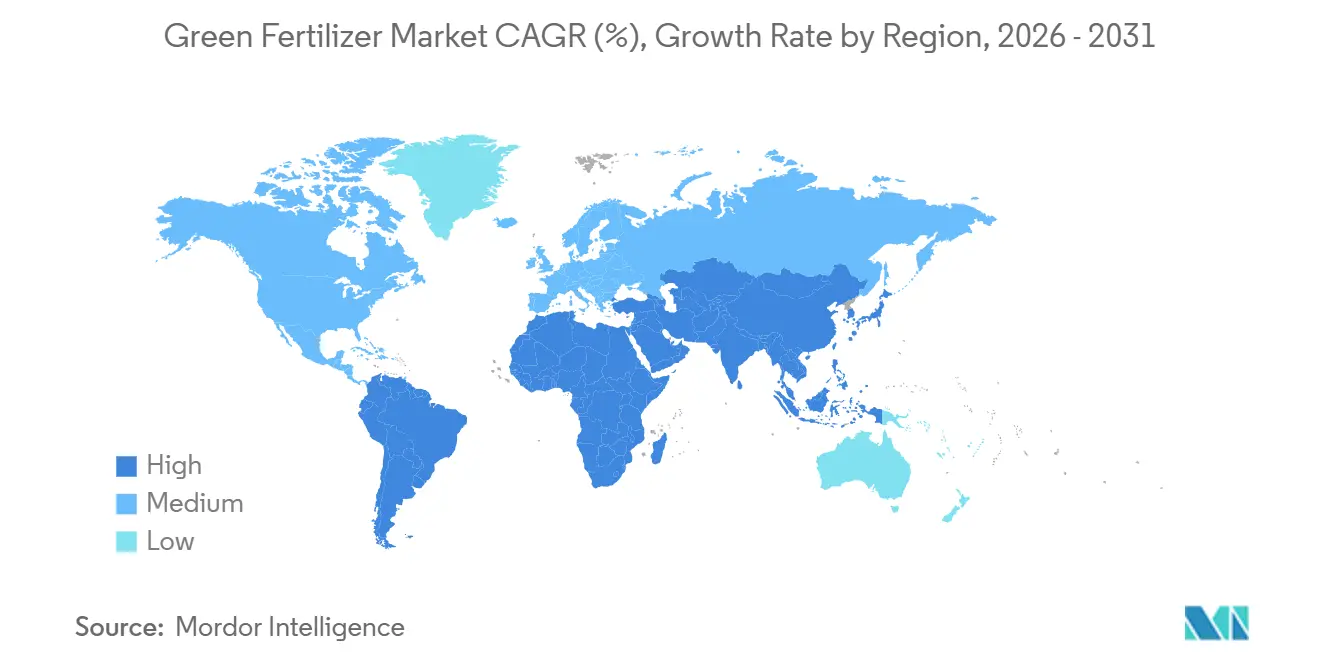
Europe accounted for the largest 32.0% of the green fertilizer market share in 2025, driven by robust regulatory frameworks and the early adoption of low-emission agricultural inputs. Carbon pricing mechanisms and sustainability mandates are facilitating the shift toward renewable-based fertilizer production. Countries like Germany and the Netherlands are integrating renewable energy with hydrogen and ammonia production systems, thereby strengthening regional supply chains. Although grid constraints and policy differences exist across countries, consistent regulatory pressure continues to support the region's leadership in sustainable fertilizer adoption.
The Asia-Pacific region is projected to grow at the fastest CAGR of 7.8% from 2026 to 2031, driven by rapid industrialization and strong government initiatives promoting clean energy integration. Countries such as China, India, and Australia are expanding renewable hydrogen capacity to support fertilizer production. The region benefits from abundant solar and wind resources, which provide cost advantages, while policy-driven investments are accelerating infrastructure development. Despite challenges such as water availability and grid limitations, the region remains a key growth driver due to its scale and resource availability.
North America is advancing low-carbon fertilizer value chains through robust policy incentives and cross-border trade dynamics. The clean hydrogen production tax credit under Section 45V provides up to USD 3.00 per kilogram of hydrogen for a 10-year period, enhancing project economics and facilitating retrofits across the Gulf Coast and Midwest [3]Source: United States Department of Energy, Clean Hydrogen Production Tax Credit (45V) Resources, 2025 . Canada is progressing with blue-ammonia export strategies, while Mexico is assessing imports from the United States Southwest. Simultaneously, the Middle East is developing large-scale renewable-powered ammonia projects, positioning itself as a significant export hub for Europe and Asia.

Competitive Landscape
The competitive landscape is moderately fragmented, with major players such as Yara International ASA, CF Industries Holdings Inc., Nutrien Ltd., OCI N.V., and Fertiglobe PLC driving investments in low-emission fertilizer production. These companies are expanding into integrated hydrogen and ammonia value chains to achieve long-term supply security and meet sustainability objectives. Technology providers offering electrolyzers and renewable integration solutions are essential in facilitating large-scale production. New entrants are focusing on modular and decentralized systems, aiming to serve regional agricultural markets with flexible deployment models.
Innovation serves as a critical differentiator, with companies advancing alternative production technologies to lower costs and enhance efficiency. Research efforts are concentrated on improving hydrogen generation, ammonia synthesis, and nutrient recovery processes. Access to renewable energy, water resources, and infrastructure remains a key factor influencing competitive positioning. Companies that secure long-term supply agreements and optimize production economics are better equipped to scale operations and meet emerging demand effectively.
Technology integration, strategic partnerships, and large-scale project investments continue to shape the competitive positioning of leading players in the green fertilizer market. Companies are increasingly collaborating across the hydrogen and ammonia value chain to accelerate low-emission fertilizer production and distribution. For example, Air Products and Chemicals Inc. and Yara International ASA entered into a partnership in December 2025 to develop and commercialize low-emission ammonia. This partnership integrates hydrogen production with global fertilizer distribution networks, reflecting the industry's growing focus on decarbonization, large-scale green ammonia production, and cross-sector integration.
Green Fertilizer Industry Leaders
Yara International ASA
CF Industries Holdings Inc.
Nutrien Ltd.
OCI N.V.
Fertiglobe PLC
- *Disclaimer: Major Players sorted in no particular order

Recent Industry Developments
- December 2025: Yara International ASA and Air Products and Chemicals Inc. have entered advanced negotiations for low-emission ammonia projects in the United States and Saudi Arabia, with a target to reach a final investment decision by mid-2026.
- May 2025: ACME Group signed agreements to advance Phases 2 and 3 of its green hydrogen and ammonia project in Duqm, Oman, under the national hydrogen portfolio and regulatory framework. Each phase is projected to produce ~71,000 metric tons of green hydrogen and 400,000 metric tons of green ammonia annually.
- March 2024: Yara International ASA entered into a binding long-term agreement with ACME Group for the supply of 100,000 metric tons per year of renewable ammonia from ACME’s Oman project. This agreement represents one of the first large-scale commercial green ammonia offtake contracts globally.


Global Green Fertilizer Market Report Scope
Green fertilizer refers to fertilizers manufactured using renewable energy sources or sustainable raw materials, such as green ammonia produced from hydrogen obtained through electrolysis powered by solar or wind energy. These fertilizers aim to reduce carbon emissions in agriculture while preserving soil fertility and crop productivity. The green fertilizer market report is segmented by fertilizer type (green ammonia, green urea, green phosphate, bio-based potash, and other fertilizers), by source technology (electrolytic hydrogen (renewable energy), biomass gasification, waste-to-hydrogen, and othersources), by form (solid and liquid), by crop type (cereals and grains, fruits and vegetables, oilseeds and pulses, and other crops), and by geography (North America, South America, Europe, Asia-Pacific, Middle East, and Africa). The market forecasts are provided in terms of value (USD).
| Green Ammonia |
| Green Urea |
| Green Phosphate |
| Bio-based Potash |
| Others |
| Electrolytic Hydrogen (Renewable Energy) |
| Biomass Gasification |
| Waste-to-Hydrogen |
| Other Emerging Technologies |
| Solid |
| Liquid |
| Cereals and Grains |
| Fruits and Vegetables |
| Oilseeds and Pulses |
| Others |
| North America | United States |
| Canada | |
| Mexico | |
| Rest of North America | |
| South America | Brazil |
| Argentina | |
| Rest of South America | |
| Europe | Germany |
| France | |
| United Kingdom | |
| Italy | |
| Spain | |
| Russia | |
| Rest of Europe | |
| Asia-Pacific | China |
| Japan | |
| India | |
| South Korea | |
| Australia and New Zealand | |
| Rest of Asia-Pacific | |
| Middle East | Saudi Arabia |
| United Arab Emirates | |
| Turkey | |
| Rest of Middle East | |
| Africa | South Africa |
| Egypt | |
| Rest of Africa |
| By Fertilizer Type | Green Ammonia | |
| Green Urea | ||
| Green Phosphate | ||
| Bio-based Potash | ||
| Others | ||
| By Source Technology | Electrolytic Hydrogen (Renewable Energy) | |
| Biomass Gasification | ||
| Waste-to-Hydrogen | ||
| Other Emerging Technologies | ||
| By Form | Solid | |
| Liquid | ||
| By Crop Type | Cereals and Grains | |
| Fruits and Vegetables | ||
| Oilseeds and Pulses | ||
| Others | ||
| By Region | North America | United States |
| Canada | ||
| Mexico | ||
| Rest of North America | ||
| South America | Brazil | |
| Argentina | ||
| Rest of South America | ||
| Europe | Germany | |
| France | ||
| United Kingdom | ||
| Italy | ||
| Spain | ||
| Russia | ||
| Rest of Europe | ||
| Asia-Pacific | China | |
| Japan | ||
| India | ||
| South Korea | ||
| Australia and New Zealand | ||
| Rest of Asia-Pacific | ||
| Middle East | Saudi Arabia | |
| United Arab Emirates | ||
| Turkey | ||
| Rest of Middle East | ||
| Africa | South Africa | |
| Egypt | ||
| Rest of Africa | ||


Key Questions Answered in the Report
What is the current value of the green fertilizer market?
The green fertilizer market size stood at USD 2.97 billion in 2026 and is projected to reach USD 3.97 billion by 2031.
How fast is the green fertilizer market growing?
The market is forecast to expand at a 6.0% CAGR between 2026 and 2031, driven by carbon-neutral mandates and falling renewable-power costs.
Which fertilizer type dominates revenue?
Green ammonia led with the largest 46.0% of green fertilizer market share in 2025.
Which region leads adoption?
Europe accounted for the largest 32.0% of green fertilizer market share in 2025.
Page last updated on:


