Market Overview
| Study Period | 2021 - 2031 |
|---|---|
| Forecast Data Period | 2026 - 2031 |
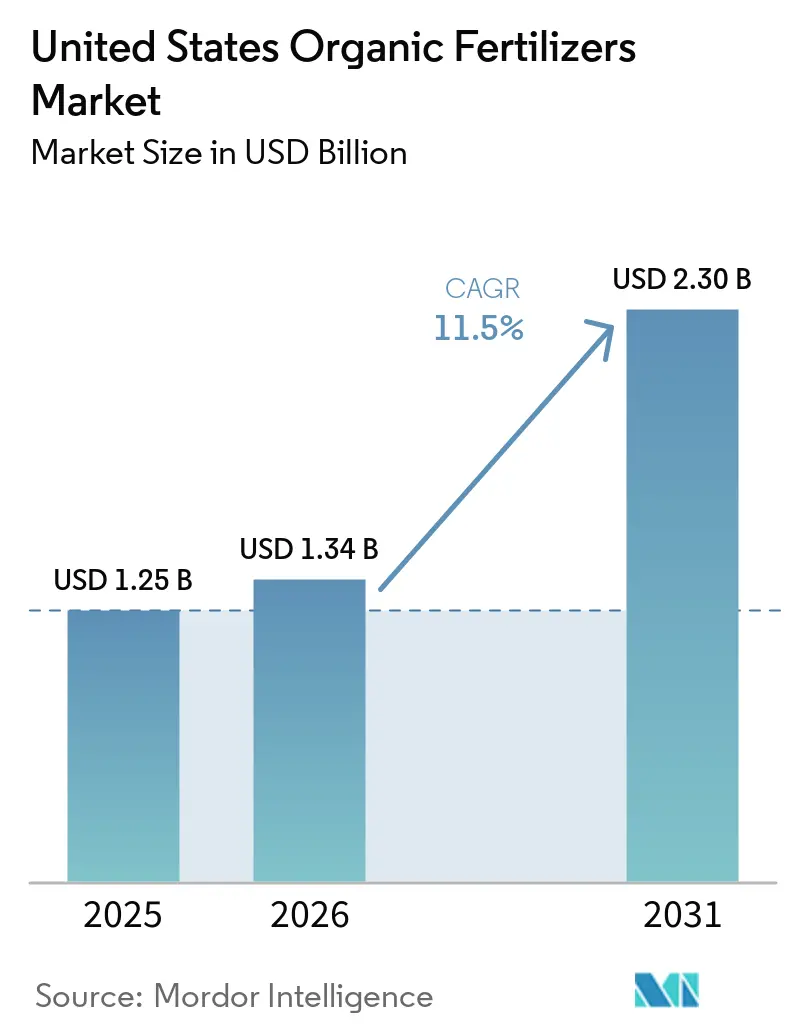
| Base Year Market Size (2025) | USD 1.25 Billion |
| Market Size (2026) | USD 1.34 Billion |
| Market Size (2031) | USD 2.30 Billion |
| Growth Rate (2026 - 2031) | 11.50% CAGR |
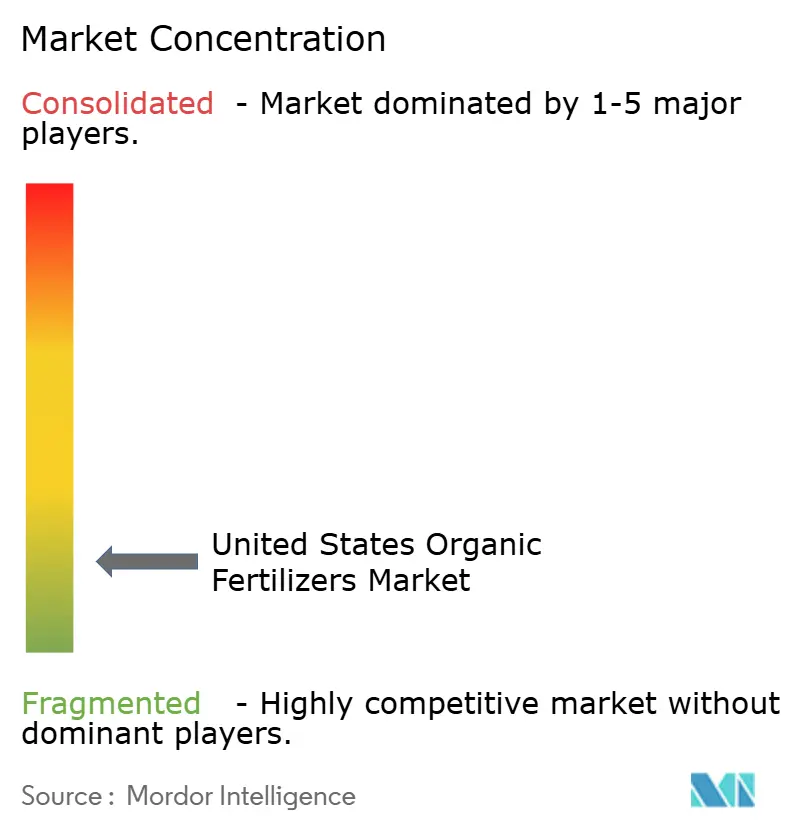
| Market Concentration | Low |
Major Players *Disclaimer: Major Players sorted in no particular order Image © Mordor Intelligence. Reuse requires attribution under CC BY 4.0. | |
United States Organic Fertilizers Market Analysis by Mordor Intelligence
The United States Organic Fertilizers Market size is anticipated to increase from USD 1.25 billion in 2025 to USD 1.34 billion in 2026 and reach USD 2.30 billion by 2031, growing at a CAGR of 11.5% over 2026-2031. Federal cost-share incentives, expanding carbon-credit programs, and state mandates on soil health are steering nutrient-management budgets towards compliant organic inputs. Large row-crop growers are combining compost applications with cover-crop rotations to qualify for program payments. Meanwhile, specialty producers are paying a premium for meal-based products to align with the United States Department of Agriculture's National Organic Program and maintain brand integrity. Growing consumer demand for chemical-free produce has strengthened retail premiums, providing growers a buffer against fertilizer cost inflation. At the same time, while low market concentration and a plentiful supply of manure feedstock ease entry for new participants, compliance costs are rising due to stricter pathogen regulations in certain states.
Key Report Takeaways
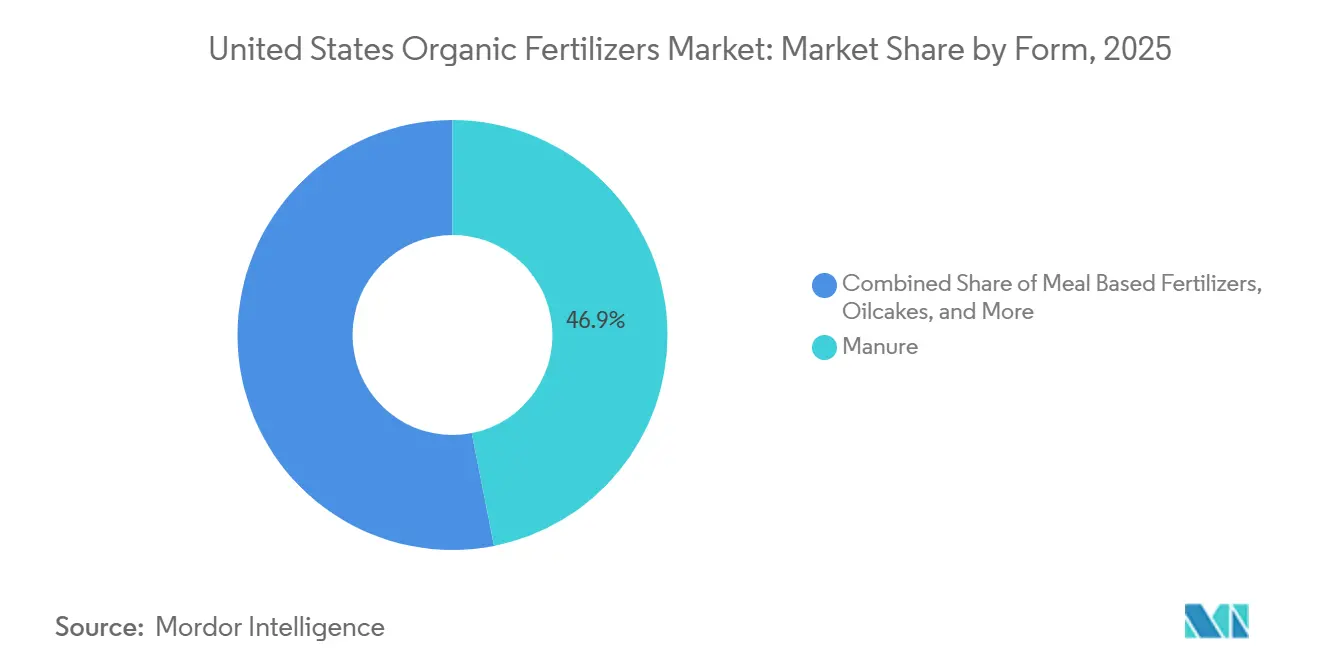
- By form, manure-based products led with 46.9% of the United States organic fertilizers market share in 2025 and are projected to climb at a 12.5% CAGR through 2031.
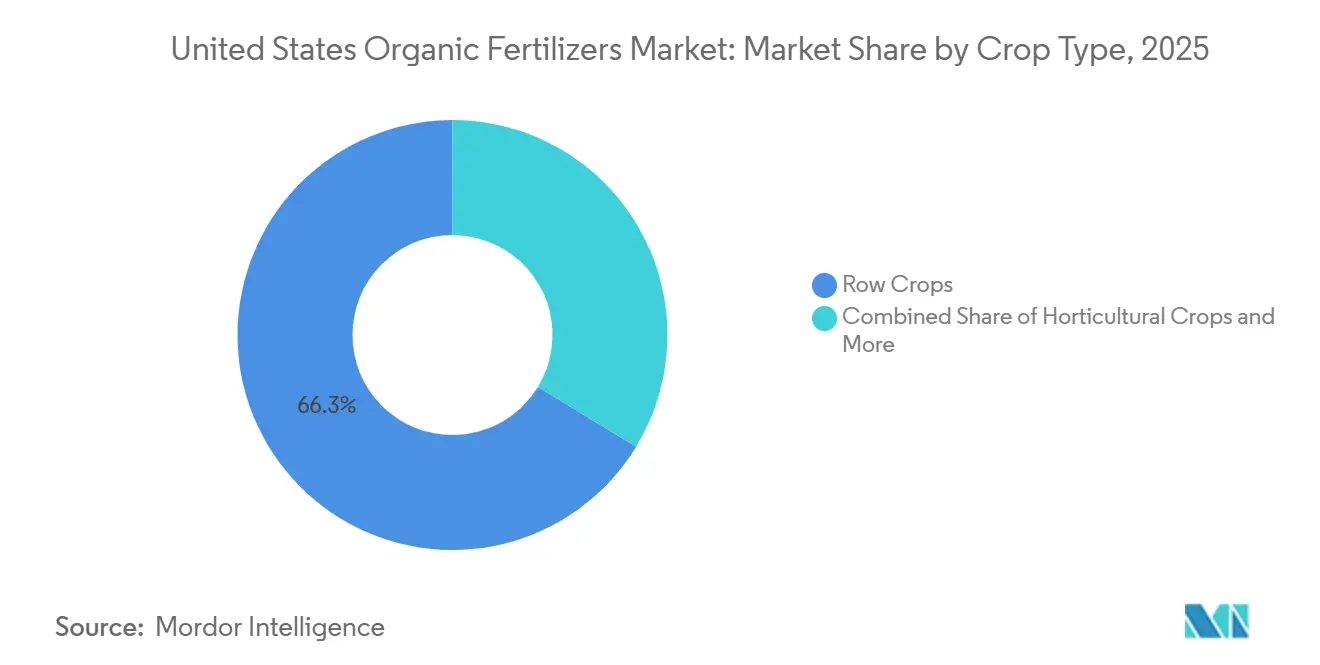
- By crop type, row crops accounted for 66.3% of the United States organic fertilizers market size in 2025 and are set to expand at a 12.6% CAGR to 2031.
Note: Market size and forecast figures in this report are generated using Mordor Intelligence’s proprietary estimation framework, updated with the latest available data and insights as of January 2026.
United States Organic Fertilizers Market Trends and Insights
Drivers Impact Analysis*
| Driver | (~) % Impact on CAGR Forecast | Geographic Relevance | Impact Timeline |
|---|---|---|---|
| Rapid growth of certified organic farmland | +2.8% | National, with concentration in California, Washington, Pennsylvania, and Wisconsin | Medium term (2-4 years) |
| Rising consumer demand for chemical-free produce | +2.5% | National, strongest in urban coastal markets and Northeast corridor | Short term (≤ 2 years) |
| Federal cost-share incentives for transitioning farms | +2.1% | National, with higher uptake in Midwest row-crop regions and Pacific Northwest | Medium term (2-4 years) |
| Expansion of organic livestock operations | +1.6% | National, concentrated in dairy regions of Vermont, Wisconsin, and California | Long term (≥ 4 years) |
| Carbon-credit monetization for compost use | +1.4% | California LCFS jurisdictions, expanding to voluntary markets in Midwest and Northeast | Long term (≥ 4 years) |
| Emerging state soil-health mandates favoring organic amendments | +1.2% | New York, Maryland, Vermont, with spillover to adjacent states | Medium term (2-4 years) |
| Source: Mordor Intelligence | |||


Rapid Growth of Certified Organic Farmland
United States Department of Agriculture data confirm that grant-funded technical support is accelerating acreage conversion despite weather-related certification backlogs[1]Source: United States Department of Agriculture, “Organic Transition Initiative Funding Details,” usda.gov. The USD 300 million Organic Transition Initiative covers up to 75% of testing and audit fees, making Organic Materials Review Institute-listed inputs financially accessible for midsize farms. Newly issued Harmonized Tariff Schedule codes for organic imports tighten traceability rules, which indirectly benefit domestic growers by reducing fraudulent competition. As each acre enters compliance, baseline demand for the United States organic fertilizers market rises because synthetic nitrogen is prohibited, locking in multi-year purchasing commitments.
Rising Consumer Demand for Chemical-Free Produce
The Organic Trade Association reported a 5.2% year-over-year sales increase to USD 71.6 billion in 2024, even as inflation constrained household budgets[2].Source: Organic Trade Association, “2024 Organic Industry Survey,” ota.com Retail contracts now require year-round organic supply, forcing growers to secure reliable nutrient sources that meet National Organic Program standards. Because price premiums remain 20%-50% over conventional equivalents, farmers can absorb the higher per-acre cost of organic products without eroding margins. This spending resilience ties fertilizer demand more tightly to consumer sentiment than to commodity cycles, insulating the United States organic fertilizers market from global synthetic price swings.
Federal Cost-Share Incentives for Transitioning Farms
Natural Resources Conservation Service Environmental Quality Incentives Program reimbursements of up to USD 140,000 per operation substantially defray start-up costs tied to organic compliance. Companion Conservation Stewardship Program payments reward producers that maintain organic nutrient-management plans beyond the initial transition. The Transition and Organic Partnership Program injects technical expertise into underserved counties, lowering knowledge barriers that once stalled conventional growers. Collectively, these measures convert one-time conversion hurdles into manageable, cash-flow-positive projects, boosting near-term sales across the United States organic fertilizers market.
Expansion of Organic Livestock Operations
The United States produces approximately 1.4 billion metric tons of livestock manure annually, but only a small fraction undergoes the composting and pathogen-reduction treatments required for OMRI certification. Vertically integrated operators divert a portion of this manure into branded fertilizer lines, capturing additional margin and stabilizing supply chains. Because livestock output is seasonally consistent, feedstock availability buffers the market against municipal food-waste volatility. Over time, this closed-loop model embeds manure-based formulations deeper into the United States organic fertilizers market.
Restraints Impact Analysis*
| Restraint | (~) % Impact on CAGR Forecast | Geographic Relevance | Impact Timeline |
|---|---|---|---|
| Limited nutrient density versus synthetic alternatives | -1.8% | National, most acute in high-intensity vegetable and specialty-crop regions | Short term (≤ 2 years) |
| Volatility in feedstock supply prices | -1.3% | National, concentrated in urban areas with competitive food-waste diversion programs | Medium term (2-4 years) |
| Slow-release profile unsuitable for certain cash crops | -0.9% | Greenhouse operations and high-value specialty crops in California, Arizona, and controlled-environment agriculture facilities | Short term (≤ 2 years) |
| Stringent state-level pathogen regulations increasing compliance costs | -0.7% | California, Washington, Oregon, with spillover to Northeast states | Long term (≥ 4 years) |
| Source: Mordor Intelligence | |||
Limited Nutrient Density Versus Synthetic Alternatives
Typical organic formulations offer NPK ratios under 5-5-5, forcing 10-15 times greater application volumes to match synthetic nitrogen delivery. The logistics burden inflates hauling costs and strains labor during tight planting windows. Higher-density options such as blood meal improve efficiency but retail for three to five times the cost of urea, restricting adoption to premium operations. Until cost-effective concentration technologies scale, density gaps will moderate growth across the United States organic fertilizers market.
Slow-Release Profile Unsuitable for Certain Cash Crops
Organic nitrogen mineralizes over three to six months, misaligning with rapid uptake phases in greenhouse tomatoes and lettuce. Drip systems require soluble nutrients delivered on demand, a function that organic powders rarely meet without supplemental fish emulsions. Frequent supplemental applications escalate labor and dilute sustainability messaging when growers import marine-based products. This agronomic misfit limits penetration of the United States organic fertilizers market into high-margin specialty segments.
*Our forecasts treat driver/restraint impacts as directional, not additive. The impact forecasts reflect baseline growth, mix effects, and variable interactions.
Segment Analysis
By Form: Manure Dominates on Feedstock Availability
Manure-based products secured the largest United States organic fertilizers market share of 46.9% in 2025 and are projected to maintain their leadership position, registering the fastest CAGR of 12.5% during 2026–2031. Although manure has a low nutrient density, its contribution of organic matter aligns with regenerative agriculture standards, making it a key input for soil health programs. To address transportation costs, producers are pelletizing manure, which slightly increases its density while maintaining Organic Materials Review Institute (OMRI) approval.
Meal-based fertilizers, oilcakes, and blended compost products occupy premium positions in the retail market. However, rising feed costs are limiting raw material availability and pushing price ceilings higher. Oilcake products offer balanced macronutrient ratios and appeal to vegetable growers, but their supply depends on byproduct volumes from crush plants, which are influenced by fluctuations in biofuel demand. Specialty compost blends, incorporating biochar and microbial inoculants, are designed to meet carbon-credit protocols, further diversifying the organic fertilizer market in the United States. As regulatory scrutiny on contaminants increases, the traceability benefits of vertically integrated supply chains enhance the competitive advantage of established market players.


By Crop Type: Row Crops Lead on Acreage Scale
Row crops captured the largest share of 66.3% of the United States organic fertilizers market size in 2025 and are projected to register the fastest-growing CAGR of 12.6% from 2026–2031, as corn and soybean producers chase export premiums of USD 2–4 per bushel(approx 25-27kg). Environmental Quality Incentives Program subsidies lower transition risk for corn and soybean acres, and carbon-credit sales offset up-front compost costs, keeping net fertilizer expense manageable for large enterprises. Commodity growers are increasingly adopting precision spreaders to optimize application timing, reducing waste while meeting program documentation standards. These practices reinforce sustained organic input volumes even when conventional fertilizer prices decline.
Conversely, cash crops such as cotton and sugar beets lag due to nutrient-timing misalignment, which exposes yield risk during critical growth stages. Horticultural segments are growing from a smaller base, powered by strong produce premiums in coastal metropolitan markets that justify higher per-acre cost structures. Greenhouse operators continue to rely on synthetic solubles, capping upside for the United States organic fertilizers market in controlled environments. Overall segment diversification underscores the importance of product portfolios tailored to both broadacre and specialty needs.
Geography Analysis
California anchors demand within the United States organic fertilizers market, pairing Low Carbon Fuel Standard carbon credits with Senate Bill 1383 waste-diversion mandates to institutionalize compost use across several acres of organic production[3]Source: California Air Resources Board, “Low Carbon Fuel Standard Compost Credit Protocol,” arb.ca.gov. Municipalities funnel diverted organics into expanded processing plants, ensuring year-round feedstock even as pathogen rules raise processing costs. Carbon-credit revenues improve grower economics, prompting continuous acreage expansion despite drought-related water constraints. This policy stack positions the state as a primary innovation hub for new product formulations and verification technologies.
The Midwest row-crop belt spanning Iowa, Illinois, Indiana, and Nebraska, represents the largest contiguous addressable acreage, and emerging voluntary carbon markets accelerate conversion momentum. Equipment dealers report rising demand for high-capacity spreaders configured for compost, signaling operational shifts that entrench organic inputs at scale. Organic transition cost-share rates top 75% in several underserved counties, closing viability gaps for first-mover farms. The flat geography also lowers transport costs, easing manure distribution from expanding dairy hubs in Wisconsin.
Northeast states such as New York, Pennsylvania, and Vermont combine proximity to dense organic consumer markets with early adoption of soil-health mandates. Proposed Carbon Farming Act tax credits would reinforce economic returns on compost applications, driving incremental volume into the United States organic fertilizers market. Maryland’s runoff regulations underpin steady demand for slow-release formulations along the Chesapeake Bay. While the Pacific Northwest experiences similar regulatory drivers, heavy rainfall necessitates stricter pathogen controls, slightly restraining growth relative to Mid-Atlantic peers.
Competitive Landscape
The United States organic fertilizers market is fragmented, with opportunities for regional entrants to establish a foothold. Some companies utilize national infrastructure to ensure a consistent supply of inputs, mitigating risks associated with feedstock fluctuations. Others benefit from long-term contracts with metropolitan utilities, enabling the supply of pathogen-controlled compost to broadacre markets at competitive prices. Companies also differentiate themselves by offering localized agronomic advisory services, including soil testing and custom fertilizer blends.
High freight costs create geographic barriers, favoring decentralized production clusters located near farm customers. Companies with internal transportation fleets or rail access achieve lower delivered-cost positions, a competitive advantage during periods of fuel-price volatility. Additionally, compliance with certification requirements across multi-feedstock production lines demands robust quality-assurance systems. This operational complexity often pushes smaller composting businesses toward partnerships or acquisitions, contributing to gradual market consolidation.
Strategic innovation in the organic fertilizer market is increasingly focused on value-added features rather than basic nutrient delivery. Companies are incorporating enhancements to improve soil microbiome performance, allowing them to command premium pricing. Precision agriculture platforms are also being integrated, offering variable-rate spreading capabilities combined with carbon-tracking software. These tools enable growers to document carbon sequestration for regulatory compliance and market incentives. Such service-oriented strategies create switching costs, fostering customer loyalty and raising the competitive threshold for new entrants in the United States organic fertilizers market.
United States Organic Fertilizers Industry Leaders
Cedar Grove Composting Inc.
The Espoma Company
California Organic Fertilizers Inc.
Morgan Composting Inc.
EB Stone & Son Inc.
- *Disclaimer: Major Players sorted in no particular order

Recent Industry Developments
- March 2025: Nitricity has secured USD 10 million in new funding for the development of an innovative organic fertilizer plant in Central California. The facility will produce Nitricity’s flagship organic nitrogen fertilizer using recycled almond shells and renewable energy. This plant-based solution is cost-competitive, pathogen-free, odor-free, and designed for application through irrigation systems.
- December 2024: Hello Nature has inaugurated a new bionutrients facility in Wabash, Indiana, United States. The 300,000-square-foot plant has a production capacity of 150,000 tons of organic fertilizers and other biosolutions, primarily derived from chicken manure sourced from local facilities. This facility will cater to the North American market, providing organic fertilizers and other specialty products.
- September 2024: Perfect Blend LLC completed construction of a new palletization facility in Nebraska, reducing transportation costs by 35% while improving product handling characteristics for large-scale row crop applications. The facility processes 15,000 metric tons annually of organic materials into concentrated pellets with consistent nutrient profiles.


United States Organic Fertilizers Market Report Scope
Organic fertilizer is a natural soil amendment obtained from plant, animal, or mineral sources, including compost, manure, bone meal, and seaweed. It enhances soil fertility and structure by releasing nutrients gradually, improving water retention, and supporting beneficial microbial activity.
The United States Organic Fertilizer Market Report provides a detailed analysis based on form and crop type. By form, the market includes manure, meal-based fertilizers, and other product types. By crop type, it covers cash crops, horticultural crops, and row crops segments. Market estimates and forecasts are presented in terms of value (USD) and volume (metric tons).
By Form
| Manure |
| Meal-Based Fertilizers |
| Oilcakes |
| Other Organic Fertilizer |
By Crop Type
| Cash Crops |
| Horticultural Crops |
| Row Crops |
| By Form | Manure |
| Meal-Based Fertilizers | |
| Oilcakes | |
| Other Organic Fertilizer | |
| By Crop Type | Cash Crops |
| Horticultural Crops | |
| Row Crops |


Market Definition
- AVERAGE DOSAGE RATE - The average application rate is the average volume of organic fertilizers applied per hectare of farmland in the respective region/country.
- CROP TYPE - Crop type includes Row crops (Cereals, Pulses, Oilseeds), Horticultural Crops (Fruits and vegetables) and Cash Crops (Plantation Crops, Fibre Crops and Other Industrial Crops)
- FUNCTION - The crop nutrition function of agricultural biological consists of various products that provide essential plant nutrients and enhance soil quality.
- TYPE - Organic fertilizers are applied to provide essential crop nutrients and enhance the soil quality.
| Keyword | Definition |
|---|---|
| Cash Crops | Cash crops are non-consumable crops sold as a whole or part of the crop to manufacture end-products to make a profit. |
| Integrated Pest Management (IPM) | IPM is an environment-friendly and sustainable approach to control pests in various crops. It involves a combination of methods, including biological controls, cultural practices, and selective use of pesticides. |
| Bacterial biocontrol agents | Bacteria used to control pests and diseases in crops. They work by producing toxins harmful to the target pests or competing with them for nutrients and space in the growing environment. Some examples of commonly used bacterial biocontrol agents include Bacillus thuringiensis (Bt), Pseudomonas fluorescens, and Streptomyces spp. |
| Plant Protection Product (PPP) | A plant protection product is a formulation applied to crops to protect from pests, such as weeds, diseases, or insects. They contain one or more active substances with other co-formulants such as solvents, carriers, inert material, wetting agents or adjuvants formulated to give optimum product efficacy. |
| Pathogen | A pathogen is an organism causing disease to its host, with the severity of the disease symptoms. |
| Parasitoids | Parasitoids are insects that lay their eggs on or within the host insect, with their larvae feeding on the host insect. In agriculture, parasitoids can be used as a form of biological pest control, as they help to control pest damage to crops and decrease the need for chemical pesticides. |
| Entomopathogenic Nematodes (EPN) | Entomopathogenic nematodes are parasitic roundworms that infect and kill pests by releasing bacteria from their gut. Entomopathogenic nematodes are a form of biocontrol agents used in agriculture. |
| Vesicular-arbuscular mycorrhiza (VAM) | VAM fungi are mycorrhizal species of fungus. They live in the roots of different higher-order plants. They develop a symbiotic relationship with the plants in the roots of these plants. |
| Fungal biocontrol agents | Fungal biocontrol agents are the beneficial fungi that control plant pests and diseases. They are an alternative to chemical pesticides. They infect and kill the pests or compete with pathogenic fungi for nutrients and space. |
| Biofertilizers | Biofertilizers contain beneficial microorganisms that enhance soil fertility and promote plant growth. |
| Biopesticides | Biopesticides are natural/bio-based compounds used to manage agricultural pests using specific biological effects. |
| Predators | Predators in agriculture are the organisms that feed on pests and help control pest damage to the crops. Some common predator species used in agriculture include ladybugs, lacewings, and predatory mites. |
| Biocontrol agents | Biocontrol agents are living organisms used to control pests and diseases in agriculture. They are alternatives to chemical pesticides and are known for their lesser impact on the environment and human health. |
| Organic Fertilizers | Organic fertilizer is composed of animal or vegetable matter used alone or in combination with one or more non-synthetically derived elements or compounds used for soil fertility and plant growth. |
| Protein hydrolysates (PHs) | Protein hydrolysate-based biostimulants contain free amino acids, oligopeptides, and polypeptides produced by enzymatic or chemical hydrolysis of proteins, primarily from vegetal or animal sources. |
| Biostimulants/Plant Growth Regulators (PGR) | Biostimulants/Plant Growth Regulators (PGR) are substances derived from natural resources to enhance plant growth and health by stimulating plant processes (metabolism). |
| Soil Amendments | Soil Amendments are substances applied to soil that improve soil health, such as soil fertility and soil structure. |
| Seaweed Extract | Seaweed extracts are rich in micro and macronutrients, proteins, polysaccharides, polyphenols, phytohormones, and osmolytes. These substances boost seed germination and crop establishment, total plant growth and productivity. |
| Compounds related to biocontrol and/or promoting growth (CRBPG) | Compounds related to biocontrol or promoting growth (CRBPG) are the ability of a bacteria to produce compounds for phytopathogen biocontrol and plant growth promotion. |
| Symbiotic Nitrogen-Fixing Bacteria | Symbiotic nitrogen-fixing bacteria such as Rhizobium obtain food and shelter from the host, and in return, they help by providing fixed nitrogen to the plants. |
| Nitrogen Fixation | Nitrogen fixation is a chemical process in soil which converts molecular nitrogen into ammonia or related nitrogenous compounds. |
| ARS (Agricultural Research Service) | ARS is the U.S. Department of Agriculture's chief scientific in-house research agency. It aims to find solutions to agricultural problems faced by the farmers in the country. |
| Phytosanitary Regulations | Phytosanitary regulations imposed by the respective government bodies check or prohibit the importation and marketing of certain insects, plant species, or products of these plants to prevent the introduction or spread of new plant pests or pathogens. |
| Ectomycorrhizae (ECM) | Ectomycorrhiza (ECM) is a symbiotic interaction of fungi with the feeder roots of higher plants in which both the plant and the fungi benefit through the association for survival. |


Research Methodology
Mordor Intelligence follows a four-step methodology in all our reports.
- Step-1: Identify Key Variables: In order to build a robust forecasting methodology, the variables and factors identified in Step-1 are tested against available historical market numbers. Through an iterative process, the variables required for market forecast are set and the model is built on the basis of these variables.
- Step-2: Build a Market Model: Market-size estimations for the forecast years are in nominal terms. Inflation is not a part of the pricing, and the average selling price (ASP) is kept constant throughout the forecast period.
- Step-3: Validate and Finalize: In this important step, all market numbers, variables and analyst calls are validated through an extensive network of primary research experts from the market studied. The respondents are selected across levels and functions to generate a holistic picture of the market studied.
- Step-4: Research Outputs: Syndicated Reports, Custom Consulting Assignments, Databases & Subscription Platforms.


