
Asia-Pacific Green IT Software Market Size and Share
Market Overview
| Study Period | 2020 - 2031 |
|---|---|
| Forecast Data Period | 2026 - 2031 |
| Base Year Market Size (2025) | USD 4.55 Billion |
| Market Size (2026) | USD 5.35 Billion |
| Market Size (2031) | USD 13.31 Billion |
| Growth Rate (2026 - 2031) | 20.00 % |
| Market Concentration | Medium |
Major Players *Disclaimer: Major Players sorted in no particular order Image © Mordor Intelligence. Reuse requires attribution under CC BY 4.0. | |
Asia-Pacific Green IT Software Market Analysis by Mordor Intelligence
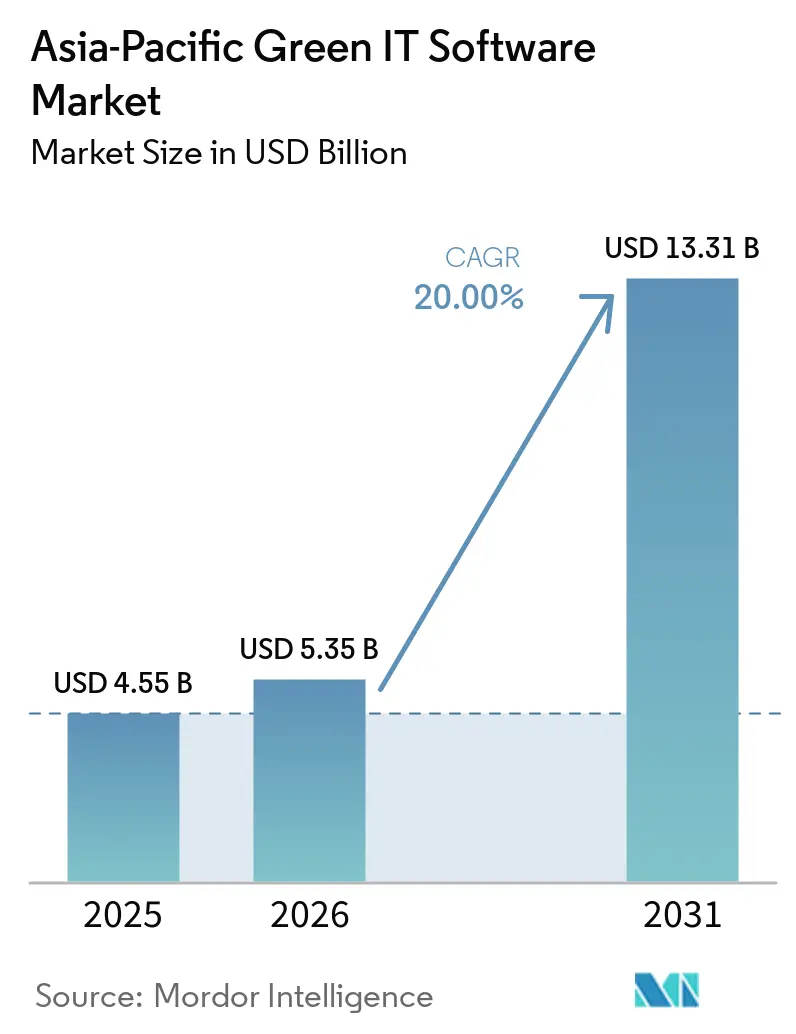
The Asia-Pacific green IT software market size is expected to grow from USD 4.55 billion in 2025 to USD 5.35 billion in 2026 and is forecast to reach USD 13.31 billion by 2031 at 20.00% CAGR over 2026-2031. The main push comes from mandatory disclosure rules moving into force across several major Asia-Pacific economies within a short period, which has moved software buying from a deferred task to an immediate operating need. The market is also widening because buyers now need systems that can collect, validate, and organize data across finance, operations, procurement, and supplier networks instead of producing only year-end reports. Cloud adoption, growing demand for audit-ready records, and rising pressure around Scope 3 reporting are making enterprise platforms more central to daily workflows. Competition is strengthening as global enterprise software companies face specialist platforms and regional providers that offer stronger local language support, narrower onboarding needs, and better alignment with country-specific reporting rules. The Asia-Pacific green IT software market also has room to expand because companies that treat these platforms as a continuous data infrastructure can improve compliance speed, reporting consistency, and operating visibility at the same time.
Key Report Takeaways
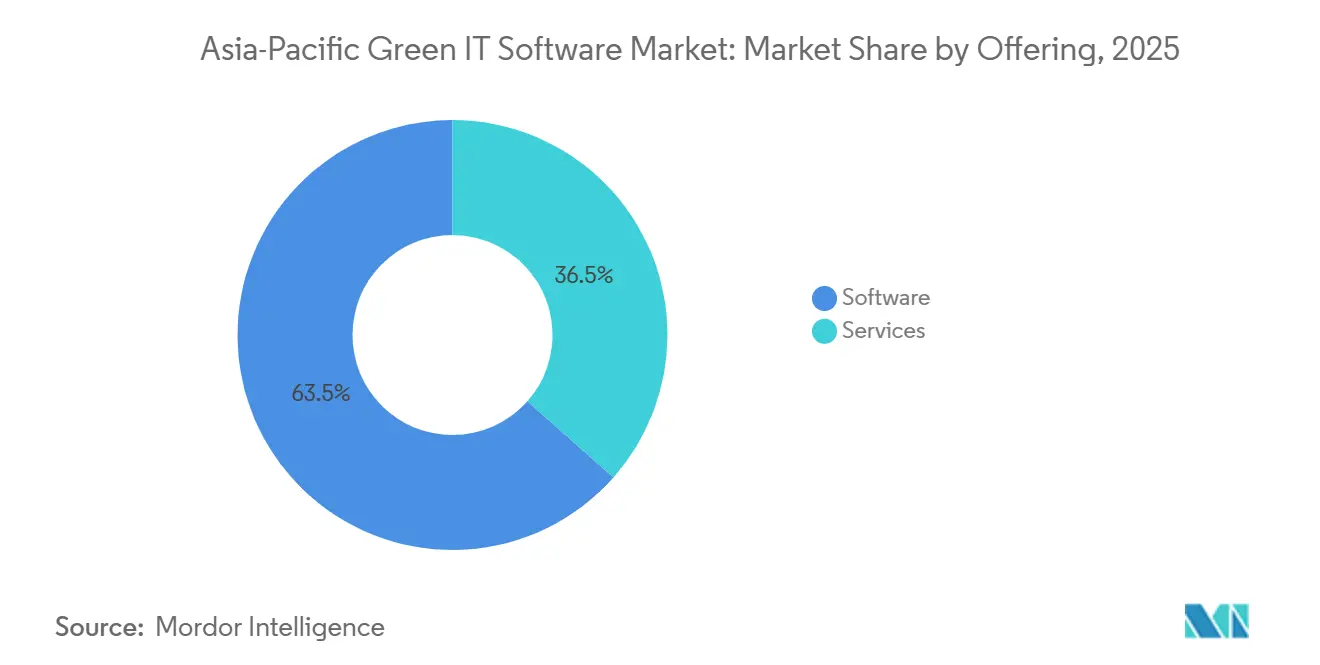
- By offering, software led with 63.47% revenue share of the Asia-Pacific green IT software market in 2025, while services are projected to expand at a 22.96% CAGR through 2031.
- By deployment, cloud-based deployment held 61.94% revenue share in 2025, while on-premise deployment is projected to expand at a 21.59% CAGR through 2031.
- By enterprise size, large enterprises held 69.53% revenue share in 2025, while SMEs are projected to expand at a 20.46% CAGR through 2031.
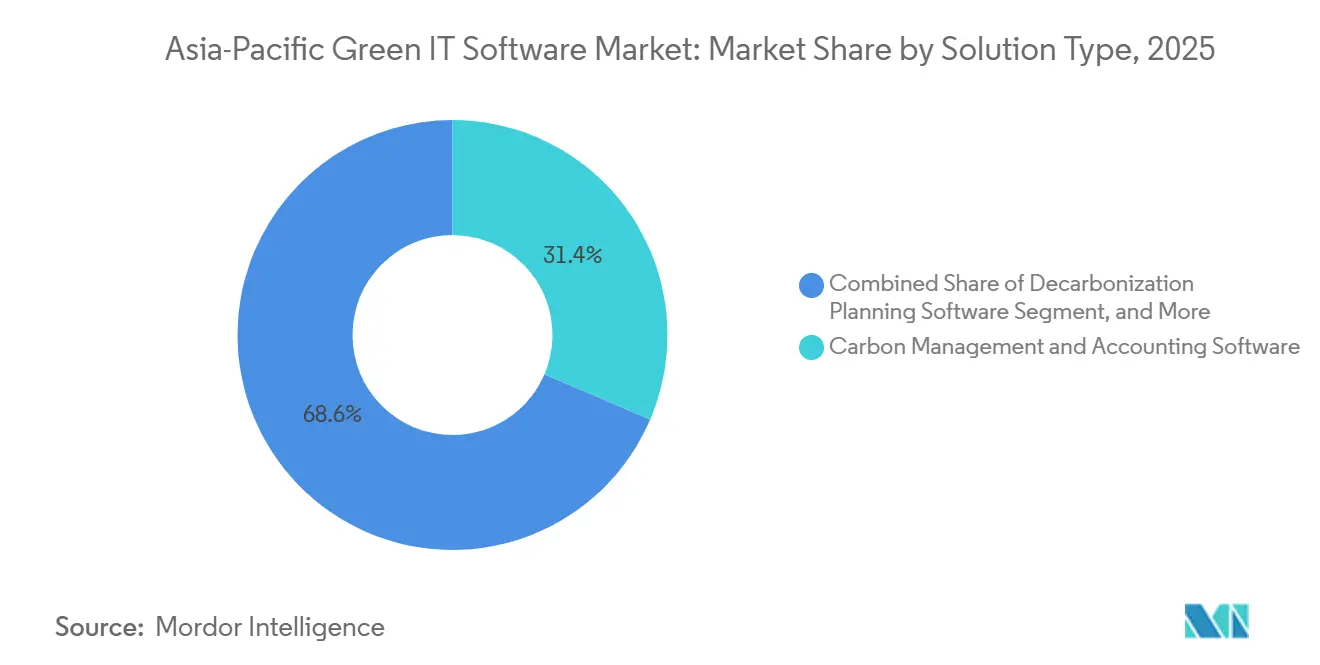
- By solution type, carbon management and accounting software led with 31.42% revenue share in 2025, while sustainability data management platforms are projected to expand at a 22.81% CAGR through 2031 in the Asia-Pacific green IT software market.
- By end-user industry, manufacturing held 22.34% revenue share in 2025 and is also projected to expand at a 21.11% CAGR through 2031.
- By country, China led with 32.43% revenue share in 2025, while India is projected to expand at a 23.87% CAGR through 2031.
Note: Market size and forecast figures in this report are generated using Mordor Intelligence’s proprietary estimation framework, updated with the latest available data and insights as of January 2026.
Market Trends and Insights
Drivers Impact Analysis of Asia-Pacific Green IT Software Market*
| DRIVER | (~) % IMPACT ON CAGR FORECAST | GEOGRAPHIC RELEVANCE | IMPACT TIMELINE |
|---|---|---|---|
| ESG Disclosure Mandates Across Asia-Pacific | +4.8% | China, Japan, South Korea, Singapore, Australia, India | Short term (≤ 2 years) |
| AI-Enabled Automation of Sustainability Data Capture | +3.5% | Global, led by Japan, Singapore, India | Medium term (2-4 years) |
| Scope 3 Reporting Pressure on Supplier Networks | +2.8% | APAC core, with global supply chain spillover | Medium term (2-4 years) |
| Cloud Migration Lowering Software Carbon Intensity | +2.2% | APAC-wide, led by Singapore and Australia | Short term (≤ 2 years) |
| Data Center Power Efficiency and Cooling Optimization Priorities | +1.9% | Japan, Singapore, China, Australia | Medium term (2-4 years) |
| Green Procurement Linked to Enterprise Cost and Reputation Goals | +1.4% | Global supply chains | Long term (≥ 4 years) |
| Source: Mordor Intelligence | |||
ESG Disclosure Mandates Across Asia-Pacific
Mandatory disclosure rules are creating the strongest current demand base for the Asia-Pacific green IT software market because compliance deadlines now require companies to formalize reporting processes instead of delaying platform investment. China moved toward its first mandatory reporting cycle for A-share listed companies in 2026, which made disclosure readiness a near-term operating priority for a large corporate base. Japan also advanced the regulatory path when the Financial Services Agency finalized SSBJ-aligned disclosure standards on February 26, 2026, giving large listed companies a clearer timetable for reporting obligations.[1] Singapore and Australia were already further along in climate reporting rollout, which reinforced a wider regional pattern of rising compliance depth and shorter preparation windows. This sequence matters because software selection now happens closer to the filing deadline, which favors vendors with ready-built templates, stronger implementation support, and established audit trails. It also supports faster commercial scale for the Asia-Pacific green IT software market because each regulatory activation creates another concentrated wave of first-time and repeat buyers.
AI-Enabled Automation of Sustainability Data Capture
AI is improving the value case for the Asia-Pacific green IT software market because it reduces the manual effort needed to gather, classify, and map information across multiple frameworks. SAP announced new sustainability AI agents in May 2026, including tools intended to support regulatory readiness and supply chain carbon intelligence inside existing sustainability workflows. IBM also expanded practical emissions accounting tools in 2026 with Envizi capabilities that brought recognized emissions factors into existing spreadsheets and enterprise processes.[2] Workiva continued to strengthen its Asia-Pacific commercial presence in 2026, which reflects growing enterprise demand for reporting automation that can support broader regional expansion. As automation improves, companies can add new frameworks with less extra labor, and that changes buying priorities toward platforms that combine data ingestion, disclosure review, and governance controls in one environment. This shift helps the Asia-Pacific green IT software market move beyond narrow compliance use cases and toward broader operating adoption.
Scope 3 Reporting Pressure on Supplier Networks
Scope 3 disclosure needs are widening software demand beyond listed corporations because supplier reporting duties now reach into vendor and contractor ecosystems across the region. The Asia-Pacific green IT software market benefits from this pattern because large buyers cannot complete credible reporting without collecting consistent data from external partners. India’s broader ESG disclosure model drew attention from the OECD in 2025, and that wider reporting structure increases the need for systems that can capture social, governance, and value-chain information alongside emissions data. Singapore’s reporting direction also adds pressure for better value-chain visibility because climate reporting expectations are becoming more structured and more difficult to manage in manual formats. This creates demand for supplier portals, questionnaires, validation tools, and audit logs that sit upstream of the final report. Vendors that link supplier engagement with reporting workflows are better placed than narrow carbon tools because buyers increasingly want one system that can handle collection, review, and disclosure in the same process.
Cloud Migration Lowering Software Carbon Intensity
Cloud migration supports the Asia-Pacific green IT software market because it improves update speed and also helps companies reduce the operational burden of on-premise software management. Cloud delivery allows vendors to push reporting template changes faster when rules change across several countries at the same time. That matters in the Asia-Pacific green IT software market because enterprises cannot afford long upgrade cycles when disclosure standards are still evolving. Regional hosting and data governance expectations also push vendors to invest in local infrastructure, which raises the entry bar for smaller providers that lack the capacity to localize deployment. As a result, cloud adoption is not only a delivery preference, it is also shaping which vendors can scale credibly across multiple Asia-Pacific jurisdictions.
Restraints Impact Analysis of Asia-Pacific Green IT Software Market*
| RESTRAINT | (~) % IMPACT ON CAGR FORECAST | GEOGRAPHIC RELEVANCE | IMPACT TIMELINE |
|---|---|---|---|
| Fragmented Asia-Pacific Reporting Frameworks and Taxonomies | -1.8% | Regional, Asia-Pacific-wide | Medium term (2-4 years) |
| High Integration Effort With Legacy Enterprise Systems | -1.5% | Global, strongly felt in APAC manufacturing | Short term (≤ 2 years) |
| Data Quality Gaps Across Supplier and Operational Systems | -1.0% | Asia-Pacific-wide, most acute in Southeast Asia | Medium term (2-4 years) |
| Shortage of Sustainability Analytics Talent | -0.7% | Global, most acute in ASEAN markets | Long term (≥ 4 years) |
| Source: Mordor Intelligence | |||
Fragmented Asia-Pacific Reporting Frameworks and Taxonomies
Fragmented rules still limit the pace of the Asia-Pacific green IT software market because companies operating across borders often face different timelines, assurance needs, and reporting definitions. The OECD highlighted the region’s widening focus on sustainability-related disclosure in 2025, but country approaches still differ in scope and emphasis. Japan’s disclosure path is moving under SSBJ-aligned standards, while Singapore applies its own reporting and assurance structure through local regulatory channels.[3] This creates hesitation during procurement because buyers want proof that a platform can adjust to several rulebooks at once before they commit to a multi-year rollout. The problem becomes more difficult when supplier networks span several markets and use different definitions for transition activity, materiality, or assurance depth. Even when demand stays strong, the Asia-Pacific green IT software market grows less efficiently when every new rollout needs extra mapping, customization, and legal review.
High Integration Effort With Legacy Enterprise Systems
Legacy integration remains a direct brake on the Asia-Pacific green IT software market because sustainability data sits across finance, procurement, logistics, human resources, utility records, and plant systems that were not designed to work together. Many industrial companies still operate fragmented core systems, so new ESG platforms often require middleware, custom connectors, and manual validation before data becomes usable. This is especially relevant in manufacturing, where older enterprise systems were built for production control and cost tracking, not for non-financial disclosure and audit workflows. The result is that implementation cost and deployment time can outweigh annual license fees during the first phase of adoption. Smaller suppliers face the same problem with fewer internal resources, which is why simple pre-connected tools can win accounts even when they offer fewer advanced features. Until interoperability improves, integration friction will continue to slow rollout speed in parts of the Asia-Pacific green IT software market.
*Our forecasts treat driver/restraint impacts as directional, not additive. The impact forecasts reflect baseline growth, mix effects, and variable interactions.
Asia-Pacific Green IT Software Market Segment Analysis
By Offering:
Software Platforms Anchor Revenue While Services ExpandSoftware held 63.47% of the market in 2025, which shows that recurring platforms remain the main commercial base for the Asia-Pacific green IT software market. Buyers favored software because subscription models give them faster updates, clearer audit trails, and better control over repeat reporting cycles. Platform demand also rose because disclosure frameworks now change more frequently, which makes static project-based work less practical over time. Software providers benefit when customers want one environment for data capture, calculation, review, and final disclosure output. This part of the Asia-Pacific ESG and sustainability software industry has therefore become more closely tied to operational reporting needs than to one-time advisory engagement.
Services are projected to expand at a 22.96% CAGR from 2026 to 2031, which reflects the near-term needs of first-time filers across newly covered jurisdictions. Many companies still need help with gap assessments, data readiness checks, framework interpretation, and first-cycle disclosure preparation before they can use a platform with confidence. That is why software vendors with implementation and managed support capabilities are better placed during the first 12 to 24 months of a new reporting phase. Over time, customers usually move toward more self-service use as internal teams gain process familiarity and governance routines become stable. This means services can accelerate initial adoption even while software remains the long-run anchor of the Asia-Pacific green IT software market.
By Deployment:
Cloud Leads Revenue While On-Premise Gains Institutional DemandCloud-based deployment accounted for 61.94% of the Asia-Pacific green IT software market share in 2025, confirming that buyers still prefer flexible delivery when reporting rules change quickly. Cloud systems help enterprises receive template updates, control changes, and new calculation logic without waiting for lengthy internal upgrade schedules. This matters in the Asia-Pacific green IT software market because several national reporting systems are being developed simultaneously. Hybrid deployment is also gaining ground because some multinationals want centralized analytics in the cloud while keeping sensitive data collection closer to site operations. That pattern shows that deployment decisions are increasingly based on governance needs rather than on a single technology preference.
On-premise deployment is projected to expand at a 21.59% CAGR from 2026 to 2031, indicating a durable niche among institutions with stricter data control requirements. Financial institutions, state-linked firms, and defense-adjacent manufacturers often need stronger control over storage, transfer, and system access. In these cases, the preference for on-premise or private environments is shaped less by convenience and more by regulatory and policy constraints. This segment therefore grows for a different reason than cloud, even though cloud still holds the larger revenue base. The Asia-Pacific green IT software market is becoming more segmented by data sovereignty, which means vendors need flexible architecture if they want to serve both large multinational buyers and tightly regulated domestic institutions.
By Enterprise Size:
Large Enterprises Lead While SMEs Add New VolumeLarge enterprises accounted for 69.53% of total revenue in 2025, reflecting the early focus of mandatory disclosure rules on the largest listed companies. Their reporting structures are more complex, their compliance exposure is higher, and their budgets allow faster software procurement when deadlines become clearer. These buyers usually want deep controls, strong integration with finance systems, and full audit readiness across business units and jurisdictions. That is why established enterprise vendors remain highly relevant in the top end of the Asia-Pacific green IT software market. Large organizations also shape downstream behavior because their supplier reporting requirements often push smaller firms to formalize data-collection processes.
SMEs are projected to expand at a 20.46% CAGR from 2026 to 2031, which shows that growth volume is increasingly moving beyond the first group of listed companies. The main trigger is not only regulation directly aimed at SMEs, but also supplier pressure from large customers that now require broader emissions and ESG data coverage. This part of the Asia-Pacific green IT software market favors simpler onboarding, lower implementation effort, and clearer workflow guidance for teams with limited internal reporting capacity. Public and private efforts to expand access to reporting infrastructure also support this demand direction, even as small firms remain cautious about costs and complexity. The Asia-Pacific ESG and sustainability software industry, therefore, faces a dual structure, with enterprise-grade depth at the top and modular ease of use becoming more important in the fast-growing lower-middle tier.
By Solution Type:
Carbon Management Leads While Data Platforms Grow FastestCarbon management and accounting software led the Asia-Pacific green IT software market with a 31.42% share in 2025, making it the primary entry point for many software purchases. Companies often start with emissions measurement because it is one of the most immediate and technically demanding disclosure requirements. This category benefits from a clear operating need, since organizations must quantify Scope 1 and Scope 2 emissions before they can build stronger reporting credibility. Reporting and compliance tools remain important because they convert collected information into structured outputs that can align with multiple frameworks. Together, these categories show that the Asia-Pacific green IT software market is still heavily shaped by the practical demands of emissions accounting and formal disclosure.
Sustainability data management platforms are projected to expand at a 22.81% CAGR from 2026 to 2031, which shows that many buyers now see data infrastructure as the longer-term bottleneck. As reporting programs mature, the hard part shifts from filing the final report to gathering consistent information across entities, facilities, and supply chains. This is why the Asia-Pacific green IT software market is moving from isolated use cases toward broader systems that support governance, traceability, and repeated operational review. Decarbonization planning and energy optimization tools also become more relevant as companies move from disclosure to targeted action. Buyers who once accepted a narrow carbon calculator now increasingly prefer platforms that integrate measurement, planning, and enterprise data management into a single framework.

By End-User Industry:
Manufacturing Leads Revenue and GrowthManufacturing held a 22.34% share of the Asia-Pacific green IT software market in 2025 and is projected to expand at a 21.11% CAGR through 2031, giving it both the largest current base and the fastest growth pace. This position reflects the region’s role in global supply chains, where manufacturers increasingly need to provide emissions and ESG data to retain customer relationships. The sector also faces complex operating footprints, making manual reporting across plants, suppliers, and logistics partners especially difficult. Because procurement qualification now depends more often on sustainability records, software demand in manufacturing is tied to commercial continuity as much as to formal regulation. This makes manufacturing one of the clearest demand centers in the Asia-Pacific green IT software market.
Information technology and telecommunications, along with BFSI, also represent important revenue pools because these sectors face rising expectations for disclosure, governance, and climate risk. Retail and e-commerce are gaining traction as vendor scoring and supply chain transparency become more central to supplier selection and brand control. Government, healthcare, and construction and infrastructure remain earlier-stage adopters, but each has reasons to strengthen reporting over time. Construction and infrastructure, in particular, can benefit as building performance, energy targets, and broader sustainability disclosure expectations widen the reporting perimeter. Across end users, the Asia-Pacific green IT software market is becoming more diverse, but manufacturing still sets the pace for both scale and urgency.
Geography Analysis
China and Japan Green IT Software Market
China held 32.43% of revenue in 2025, which made it the largest country base within the Asia-Pacific green IT software market. Its scale matters because 2026 became the first mandatory reporting year for a large set of A-share listed companies, which created a concentrated software buying cycle. The size of that compliance wave is important because it brings a large number of enterprises into active preparation at the same time. Japan remained the second-largest national market, supported by the Financial Services Agency’s February 2026 finalization of SSBJ-aligned disclosure standards for large Prime Market companies. Japanese demand is also widening as companies manage several reporting expectations together, which increases the value of platforms with local templates and stronger mapping support.
India and South Korea Green IT Software Market
India is projected to expand at a 23.87% CAGR from 2026 to 2031, which makes it the fastest-growing country market in the region. That pace reflects the broadening compliance perimeter under the BRSR Core framework, which brings a larger group of listed companies into more structured disclosure and assurance requirements. The OECD also pointed to India’s wider ESG disclosure model in 2025, which supports demand for platforms that can manage more than climate-only information.[4] South Korea entered a more formal disclosure phase in 2026, and that is significant because its large industrial groups face heavy reporting needs across complex supply chains. These factors support a strong next wave of adoption in the Asia-Pacific green IT software market, especially among firms that need enterprise-grade controls but are still building internal reporting maturity.
Australia and Singapore Green IT Software Market
Australia and Singapore remain two of the most regulation-ready markets in the Asia-Pacific green IT software market because both moved earlier on structured climate disclosure. Singapore’s reporting and assurance requirements strengthened the local need for systems that can support repeatable, audit-ready workflows. Australia continues to add reporting depth through a phased rollout to wider company groups, which extends the addressable buyer base over time. The rest of Asia-Pacific is likely to form a broader second wave, with local language support, lower complexity deployments, and practical onboarding becoming more important as mid-sized enterprises enter the compliance path.
Competitive Landscape
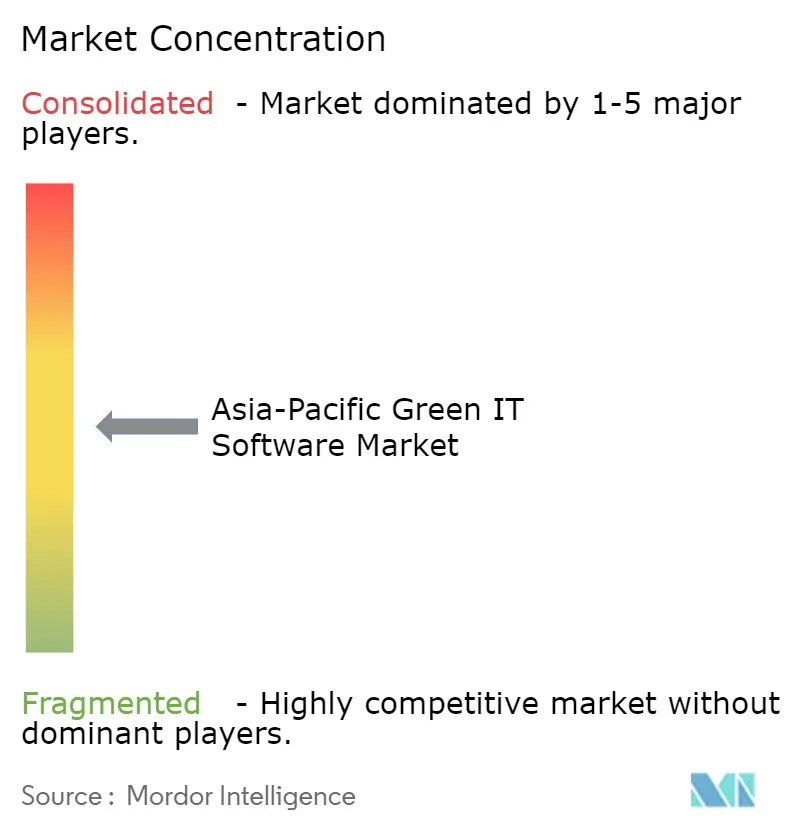
The Asia-Pacific green IT software market is moderately concentrated at the top end and more fragmented below that level, because a small group of global enterprise vendors serves large accounts while many specialist and regional firms pursue narrower use cases. SAP, IBM, Microsoft, Salesforce, Oracle, and Workiva are prominent in large enterprise environments because they benefit from existing system relationships and stronger governance credibility. Specialist providers and AI-native regional entrants compete by offering faster onboarding, more local language support, and better alignment with country-specific reporting needs. This split means the Asia-Pacific green IT software market rewards both scale and local precision, depending on customer size and compliance maturity.
Strategic moves in 2025 and 2026 show how vendors are trying to widen platform breadth before regional demand becomes even more competitive. SAP introduced new sustainability AI agents in May 2026 to automate regulatory readiness and supply chain carbon tasks inside its broader software environment.[5] Makersite completed the acquisition of Siemens’ SiGREEN platform in June 2026, which strengthened its position in product carbon footprint and Scope 3 data exchange for manufacturing-heavy use cases. Fujitsu also launched an AI-based non-financial information analysis service for Japanese listed companies in May 2026, which reflects the growing importance of local disclosure support ahead of tighter reporting deadlines. IBM expanded practical workflow access with Envizi Emissions Calculations in Excel in April 2026, which helps organizations move from spreadsheet habits toward more structured emissions accounting.
White space remains strongest in simplified platforms for first-time filers and in solutions tailored to manufacturing, construction, and financial services. Regional firms can still win where local rule interpretation, language support, and lower integration burden matter more than global brand scale. At the same time, enterprise buyers are showing interest in platforms that can connect financial, operational, and sustainability records with fewer manual handoffs. That means the Asia-Pacific green IT software market is likely to keep consolidating in core enterprise accounts while staying open to newer entrants in the SME and vertical-specific layers.
Asia-Pacific Green IT Software Industry Leaders
-
IBM Corporation
-
Microsoft Corporation
-
SAP SE
-
Schneider Electric SE
-
Oracle Corporation
- *Disclaimer: Major Players sorted in no particular order
Asia-Pacific Green IT Software Market Companies Covered in this Report
- IBM Corporation
- Microsoft Corporation
- SAP SE
- Schneider Electric SE
- Oracle Corporation
- Salesforce, Inc.
- Workiva Inc.
- Wolters Kluwer N.V.
- Sphera Solutions, Inc.
- EcoVadis SAS
- Diligent Corporation
- Persefoni AI Inc.
- Greenly SAS
- Enablon, a Wolters Kluwer Company
- Benchmark Digital Partners LLC
- Cority Software Inc.
- Intelex Technologies ULC
- Siemens AG
- Cisco Systems, Inc.
- Accenture PLC
Recent Industry Developments in Asia-Pacific Green IT Software Market
- June 2026: Makersite completed the acquisition of SiGREEN, Siemens AG's product carbon footprint and supply chain data exchange platform, effective June 1, 2026, significantly strengthening Makersite's ability to deliver end-to-end Scope 3 and product-level carbon footprint capabilities for manufacturers and their supply chain partners across Asia-Pacific.
- May 2026: SAP announced new sustainability AI agents at SAP Sapphire, including the Sustainability Regulatory Readiness Agent and Supply Chain Carbon Intelligence Agent, designed to automate multi-framework reporting scope assembly within SAP Sustainability Control Tower. General availability is targeted for year-end 2026, covering concurrent IFRS S1, S2, and regional reporting obligations.
- May 2026: Fujitsu launched an AI-powered non-financial information analysis service for Japanese listed companies, leveraging disclosure data from more than 1,000 domestic enterprises to enable objective benchmarking and strategic ESG disclosure planning as SSBJ mandatory deadlines approach for FY2026-27.
- April 2026: IBM launched Envizi Emissions Calculations in Excel on April 30, 2026, embedding GHG calculations into spreadsheet-based sustainability workflows using Envizi's library of more than 140,000 globally recognized emissions factors, providing a low-friction on-ramp to enterprise emissions accounting for organizations managing complex Scope 3 data.
Asia-Pacific Green IT Software Market Report Scope
The Asia-Pacific Green IT Software Market refers to technologies and practices designed to minimize the environmental impact of computing. These solutions focus on optimizing energy efficiency, supporting renewable-powered infrastructure, and driving sustainable digital transformation. In this region, the concept is closely associated with hyperscale cloud deployments, improving AI workload efficiency, and enhancing data center sustainability. These aspects align with government mandates for carbon neutrality, accelerated enterprise cloud adoption, and the demand for scalable, environmentally sustainable tech systems.
The Asia-Pacific Green IT Software Market Report is Segmented by Offering (Software, and Services), Deployment (Cloud-Based, On-Premise, and Hybrid), Enterprise Size (Large Enterprises, and Small and Medium Enterprises), Solution Type (Carbon Management and Accounting Software, ESG Reporting and Compliance Software, Sustainability Data Management Platforms, Decarbonization Planning Software, and Energy and Resource Optimization Software), End-User Industry (Information Technology and Telecommunications, Banking, Financial Services, and Insurance (BFSI), Manufacturing, Energy and Utilities, Retail and E-Commerce, Government, Healthcare, Construction and Infrastructure, and Other End-User Industries), By Country (China, Japan, India, South Korea, Australia, Singapore, and Rest of Asia-Pacific). The Market Forecasts are Provided in Terms of Value (USD).
Segmentation Overview
| Software |
| Services |
| Cloud-Based |
| On-Premise |
| Hybrid |
| Large Enterprises |
| Small and Medium Enterprises |
| Carbon Management and Accounting Software |
| ESG Reporting and Compliance Software |
| Sustainability Data Management Platforms |
| Decarbonization Planning Software |
| Energy and Resource Optimization Software |
| Information Technology and Telecommunications |
| Banking, Financial Services, and Insurance (BFSI) |
| Manufacturing |
| Energy and Utilities |
| Retail and E-Commerce |
| Government |
| Healthcare |
| Construction and Infrastructure |
| Other End-User Industries |
| China |
| Japan |
| India |
| South Korea |
| Australia |
| Singapore |
| Rest of Asia-Pacific |
| By offering | Software |
| Services | |
| By Deployment | Cloud-Based |
| On-Premise | |
| Hybrid | |
| By Enterprise Size | Large Enterprises |
| Small and Medium Enterprises | |
| By Solution Type | Carbon Management and Accounting Software |
| ESG Reporting and Compliance Software | |
| Sustainability Data Management Platforms | |
| Decarbonization Planning Software | |
| Energy and Resource Optimization Software | |
| By End-User Industry | Information Technology and Telecommunications |
| Banking, Financial Services, and Insurance (BFSI) | |
| Manufacturing | |
| Energy and Utilities | |
| Retail and E-Commerce | |
| Government | |
| Healthcare | |
| Construction and Infrastructure | |
| Other End-User Industries | |
| By Country | China |
| Japan | |
| India | |
| South Korea | |
| Australia | |
| Singapore | |
| Rest of Asia-Pacific |
Key Questions Answered in the Report
What is the current and forecast size of the Asia-Pacific green IT software space?
The market size stood at USD 4.55 billion in 2025, reaches USD 5.35 billion in 2026, and is forecast to reach USD 13.31 billion by 2031 at a 20.00% CAGR.
Which country leads regional revenue?
China led regional revenue with a 32.43% share in 2025, supported by the first mandatory reporting cycle for a large A-share listed company base.
Which country is growing the fastest through 2031?
India is the fastest-growing country, with a projected CAGR of 23.87% from 2026 to 2031 as disclosure requirements widen across listed companies.
Which solution category holds the largest revenue base?
Carbon management and accounting software led solution revenue with a 31.42% share in 2025 because emissions measurement remains the starting point for many reporting programs.
Why are services growing faster than software in the near term?
Services are projected to grow at a 22.96% CAGR because first-time filers need support with readiness reviews, framework interpretation, and early disclosure setup.
Which end-user group matters most in this space?
Manufacturing is the most important end-user group because it held 22.34% revenue share in 2025 and is also projected to grow at a 21.11% CAGR through 2031.