Graphene Electronics Market Size and Share
Market Overview
| Study Period | 2019 - 2030 |
|---|---|
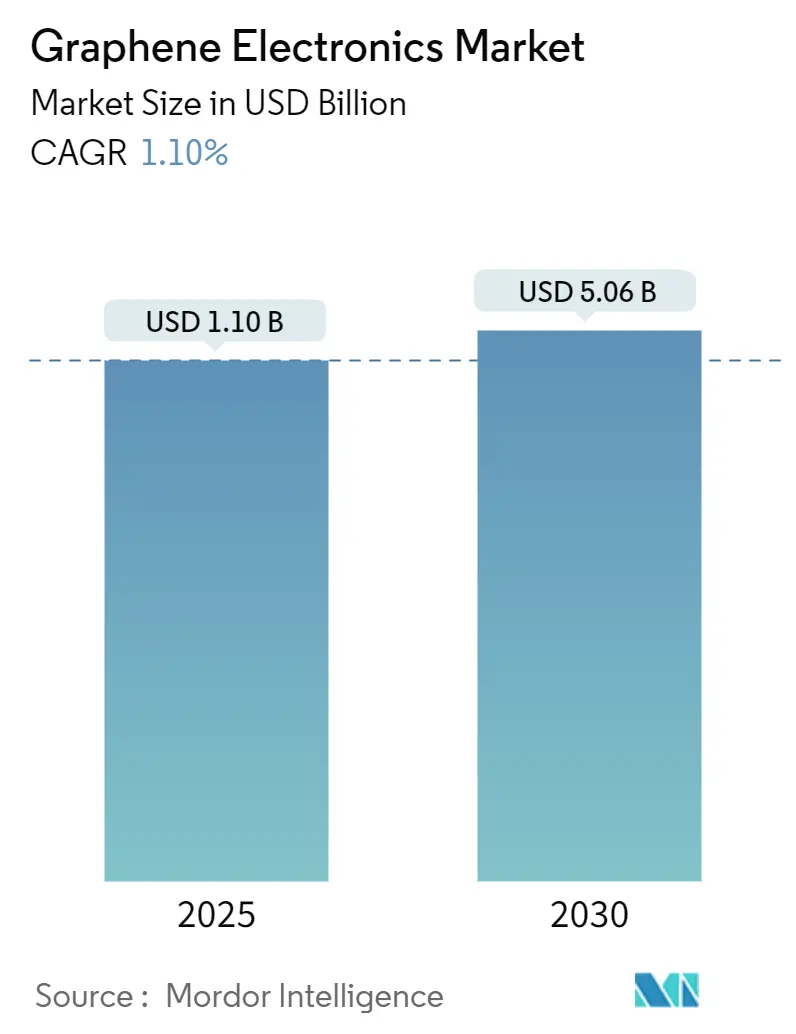
| Market Size (2025) | USD 1.10 Billion |
| Market Size (2030) | USD 5.06 Billion |
| Growth Rate (2025 - 2030) | 1.10% CAGR |
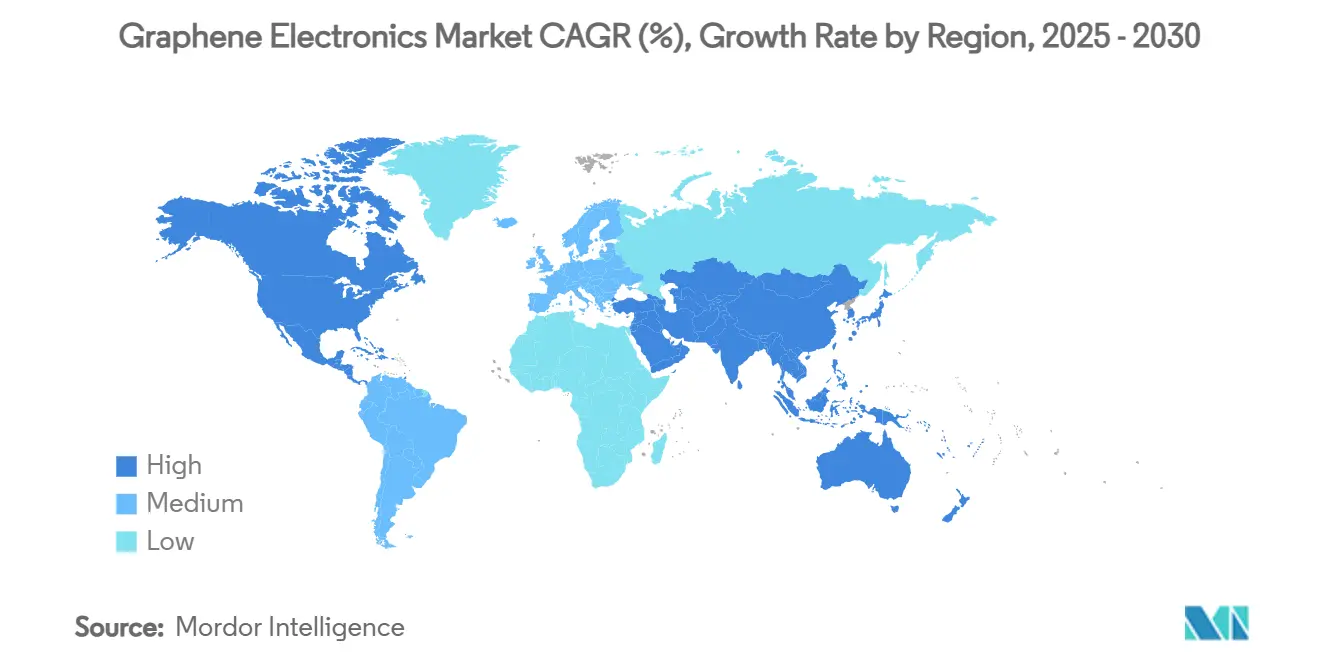
| Fastest Growing Market | Asia Pacific |
| Largest Market | Asia Pacific |
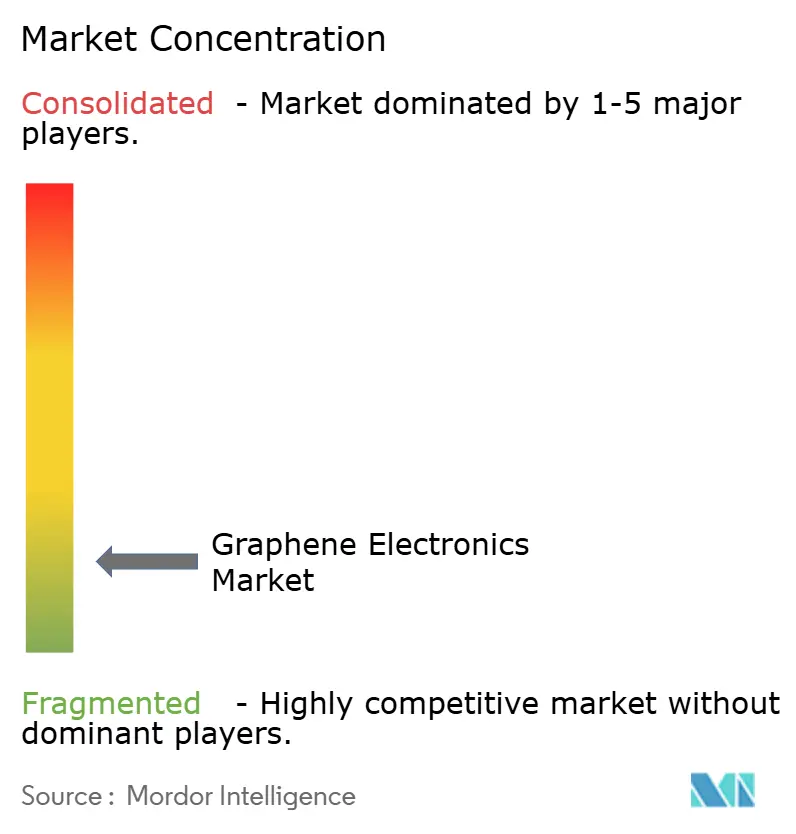
| Market Concentration | Low |
Major Players *Disclaimer: Major Players sorted in no particular order Image © Mordor Intelligence. Reuse requires attribution under CC BY 4.0. | |
Graphene Electronics Market Analysis by Mordor Intelligence
The graphene electronics market size reached USD 1.1 billion in 2025 and is projected to expand to USD 5.06 billion by 2030, reflecting a 35.50% CAGR during the forecast period. Breakthrough manufacturing techniques, the rise of 6G terahertz devices and the automotive push for advanced heat spreaders collectively propel demand, while government semiconductor-sovereignty programs secure long-term funding flows. Rapid cost declines from oxygen-free CVD processes, together with Joule-heating batch production, are lowering entry barriers for consumer devices and power-dense energy storage. The resulting shift toward flexible, body-integrated electronics drives fresh revenue pools in wearables and medical sensors. Yet quality-standards gaps, large-scale fab costs and graphite-feedstock volatility temper the market’s near-term trajectory.
Key Report Takeaways
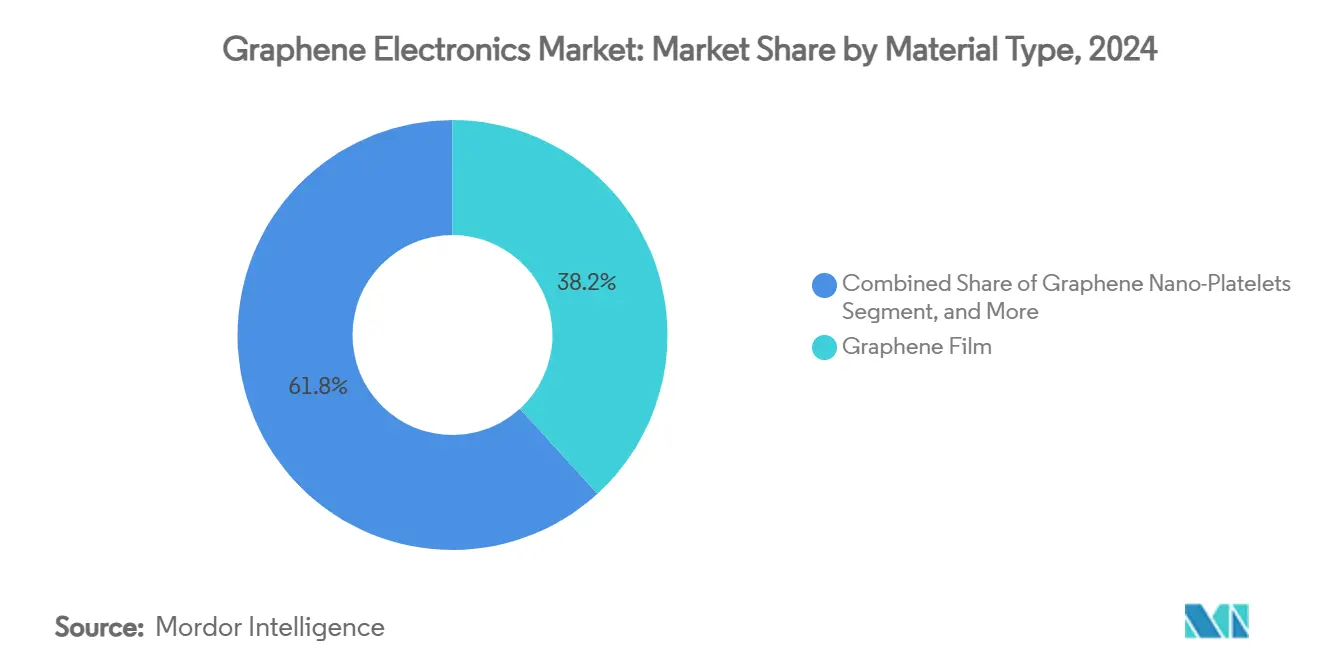
- By material type, graphene film captured 38.21% of the graphene electronics market share in 2024, while graphene oxide commands the highest forecast CAGR at 35.53% through 2030.
- By device type, batteries and ultracapacitors held 34.58% share of the graphene electronics market size in 2024; sensors are projected to advance at 35.61% CAGR between 2025-2030.
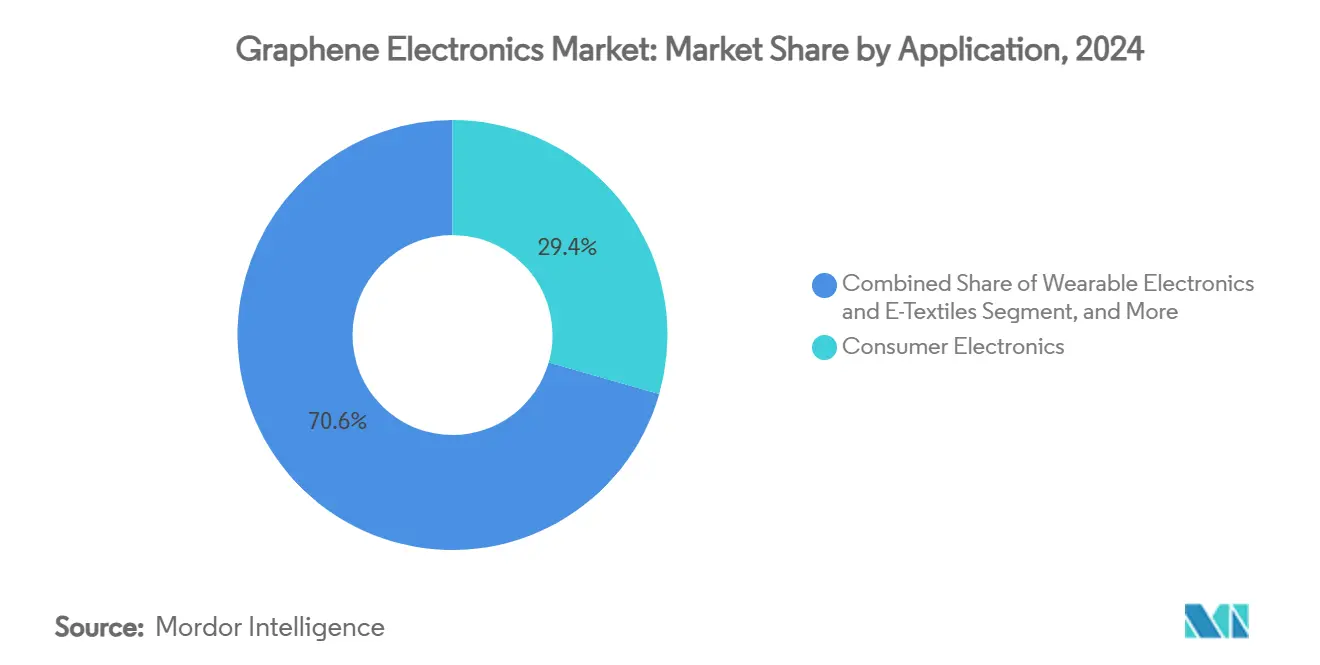
- By application, consumer electronics accounted for 29.43% share in 2024, but wearable electronics are expanding at a 35.95% CAGR to 2030.
- By manufacturing technology, chemical vapor deposition (CVD) dominated with 46.51% share in 2024 and is forecast to maintain 35.77% CAGR through 2030.
- By geography, Asia-Pacific led with 41.98% revenue share in 2024; North America follows, but Asia-Pacific is also forecast to grow the fastest at 35.89% CAGR through 2030.
Global Graphene Electronics Market Trends and Insights
Drivers Impact Analysis*
| Driver | (~) % Impact on CAGR Forecast | Geographic Relevance | Impact Timeline |
|---|---|---|---|
| Breakthrough in large-area CVD graphene film production | +8.2% | Global, with concentration in Asia-Pacific and Europe | Medium term (2-4 years) |
| Rapid adoption of graphene supercapacitors in consumer wearables | +6.8% | North America and EU, expanding to Asia-Pacific | Short term (≤ 2 years) |
| 6G terahertz device R&D funding spikes post-2025 | +7.1% | Global, led by US, EU, China, South Korea | Long term (≥ 4 years) |
| Automotive OEM shift to graphene heat-spreader electronics | +5.9% | Asia-Pacific core, spill-over to North America and EU | Medium term (2-4 years) |
| Commercialization of graphene photonics for AI accelerators | +9.3% | Global, concentrated in semiconductor hubs | Medium term (2-4 years) |
| Government-backed semiconductor sovereignty programs prioritizing graphene | +4.7% | US, EU, Japan, South Korea | Long term (≥ 4 years) |
| Source: Mordor Intelligence | |||
Breakthrough in Large-Area CVD Graphene Film Production
Oxygen-free CVD processes demonstrated at Columbia University deliver wafer-scale films with defect density comparable to exfoliated sheets, allowing repeatable 300 mm runs that align with incumbent semiconductor lines.[1]Philip Kim, “Engineers Link Oxygen to Graphene Quality,” Phys.org, phys.orgComplementary liquid-layer enhancement at Oxford University slashes cycle time to 15 minutes, trimming unit costs by 75%. Rapid Joule-heating reactors then push batch throughput to 100 g at USD 0.50 kg, meeting price points needed for mid-range consumer devices. Together these advances neutralize historical quality-cost trade-offs and unlock high-volume supply agreements with display and battery OEMs. Market participants now redirect R&D budgets from process feasibility toward device architecture optimization, accelerating commercialization.
6G Terahertz Device R&D Funding Spikes Post-2025
DARPA, Horizon Europe and Korea’s ICT-2026 programs collectively earmark multibillion-dollar grants for >1 THz components where silicon falters.[2]DARPA, “THz Electronics Program Overview,” darpa.mil University of Ottawa’s graphene mixers show 30-fold signal gain, validating the material’s hot-carrier superiority for broadband conversion. Rohde & Schwarz’s photonics-based comb generator integrates graphene absorbers to stabilize THz output, demonstrating industrial readiness. These milestones prove mutual dependence: 6G demands graphene while graphene commercial value scales with 6G rollouts. Vendors able to certify radio-grade quality are now fast-tracked into supply chains for antenna modules, creating fresh licensing revenue streams.
Commercialization of Graphene Photonics for AI Accelerators
Black Semiconductor’s EUR 254.4 million raise funds the first dedicated graphene-photonics fab, targeting pilot output by 2027. Its hybrid electronic-photonic chips cut interconnect energy by eliminating copper wire routing, essential for multitrillion-parameter AI models. Akhetonics secured EUR 6 million to develop all-optical logic blocks that withstand radar and aviation EMI environments. The convergence of data-center heat constraints and AI workload growth positions graphene as a cost-effective photonic platform. Capital markets now reward startups that bundle material IP with system-level integration know-how, spurring M&A interest from hyperscale compute providers.
Automotive OEM Shift to Graphene Heat-Spreader Electronics
Ford embedded graphene into foam parts, delivering 30% heat endurance gains across 10 vehicle components, proving stable performance under vibration and temperature cycling. Apple’s migration to graphene vapor-chamber cooling in iPhone 16 Pro sets a consumer-electronics baseline that automotive tier-ones quickly emulate for EV power modules. Graphene Manufacturing Group’s THERMAL-XR coating shrinks heat-sink footprints, enabling tighter under-hood packaging and extending battery life in high-ambient markets. As EV drivetrain power densities climb, OEMs view graphene as the only scalable path to control junction temperatures without bulky liquid loops, driving multi-year sourcing contracts.
Restraints Impact Analysis*
| Restraint | (~) % Impact on CAGR Forecast | Geographic Relevance | Impact Timeline |
|---|---|---|---|
| Lack of harmonized quality standards for electronic-grade graphene | -4.3% | Global, particularly affecting cross-border trade | Short term (≤ 2 years) |
| High capex for 300mm graphene-on-silicon fabs | -6.1% | Global, concentrated in semiconductor manufacturing regions | Medium term (2-4 years) |
| Supply-chain volatility of high-purity graphite feedstock | -3.8% | Global, with highest impact in regions dependent on Chinese supply | Short term (≤ 2 years) |
| Toxicological uncertainty delaying consumer-facing approvals | -2.9% | North America and EU regulatory jurisdictions | Long term (≥ 4 years) |
| Source: Mordor Intelligence | |||
Lack of Harmonized Quality Standards for Electronic-Grade Graphene
ANSI, ISO and IEC have yet to agree on oxygen content, layer-count and defect-density metrics, forcing device makers to run costly incoming-lot testing.[3]Graphene Council, “Setting Graphene Standards,” thegraphenecouncil.org LayerOne’s oxygen-ratio framework illustrates supplier variance that can double sheet resistance, undermining display yields. The EU 2D-Experimental Pilot Line shows resist residues from lithography degrade mobility by 40%, highlighting the need for process-integrated benchmarks. In the near term, bespoke vendor specs slow qualification cycles and limit multi-source procurement, curbing unit-cost reductions and stalling mass deployment.
High Capex for 300 mm Graphene-on-Silicon Fabs
A leading-edge 3 nm fab already tops USD 15 billion, with graphene modules adding custom CVD chambers and contamination controls; EUV scanners alone cost USD 350 million each. Black Semiconductor’s Aachen site required EUR 254.4 million for pilot scale, underscoring head-start capital needs even before yield ramp. Multi-project wafer runs show that graphene electrical contacts demand tighter process windows than copper, raising rework rates and lengthening payback periods. Consequently, only governments or conglomerates with deep pockets can bankroll full-scale lines, limiting geographic diversity and elevating supply-disruption risk.
*Our forecasts treat driver/restraint impacts as directional, not additive. The impact forecasts reflect baseline growth, mix effects, and variable interactions.
Segment Analysis
By Material Type: Commercial Traction Favors Films While Oxides Surge
Graphene film accounted for 38.21% of the graphene electronics market size in 2024, reflecting mature CVD supply chains for transparent conductors in touch panels and OLED displays. Films deliver sub-300 Ω/□ sheet resistance with ≥90% transmittance, meeting OEM specs without indium tin oxide fragility. Graphene oxide’s 35.53% forecast CAGR stems from its solution processability, enabling inkjet-printed antennas, EMI coatings and polymer composites that sidestep high-vacuum tools. Few-layer and monolayer sheets address quantum sensing and high-frequency transistors where ballistic transport is critical, while nanoplatelets drive bulk composite markets in automotive plastics. Foam and aerogels extend into battery separators and phase-change heat sinks, illustrating widening material diversity.
Commercial buyers emphasize cost-performance ratios: films now sell at USD 12 m², down from USD 45 m² in 2023, while oxide inks dip below USD 50 kg, edging toward silver-nanowire parity. Suppliers differentiate by doping level, defect control and roll-to-roll scalability. Multiple bidders to supply oxide dispersions for European display fabs signal impending oversupply, yet supply stability hinges on grade-control certification. Forward-integration by film producers into patterned electrodes positions them to capture more downstream value and hedge commoditization risk.


By Device Type: Energy Storage Dominates, Sensors Accelerate
Batteries and ultracapacitors captured 34.58% of the graphene electronics market share in 2024, driven by cell makers exploiting graphene’s high surface area to boost ion adsorption and extend cycle life. Aluminum-ion prototypes hit 1,000 mAh capacities, closing the gap with lithium-ion without flammable electrolytes. Supercapacitors for wearables now reach 10 Wh kg⁻¹, satisfying 24-hour fitness-band duty cycles. Sensors, however, outrun all categories at 35.61% CAGR to 2030, as monolayer sheets deliver ppm-level gas detection and biopotential acquisition for neuro-interfaces.
Transistors and integrated circuits progress slowly; contact resistance and band-gap engineering remain hurdles, confining uptake to RF mixers and photodetectors. Flexible transparent displays see steady demand as smartphone OEMs pilot rollable screens using graphene electrodes that withstand 100,000 bends at 2 mm radius. Memory devices such as PoX flash leapfrog NAND latency, but fab builds still limit volume. Photovoltaics gain from graphene electrodes replacing volatile silver, easing supply chain pressure. Vendor roadmaps indicate steady diversification beyond energy storage toward full electronic subsystems.
By Application: Wearables Lead the Next Adoption Wave
Consumer electronics maintained 29.43% share in 2024, mainly smartphones and tablets seeking higher battery gravimetric energy and improved thermal paths. Wearable electronics head the growth league at 35.95% CAGR, leveraging graphene’s flexibility and skin-compatibility for continuous health tracking. Laser lift-off techniques cut carbon residues by 92.8%, allowing 10 µm flexible OLED stacks viable for smart patches. Energy storage and power electronics claim rising budgets as EV manufacturers adopt graphene-coated busbars and thermal pads.
Automotive electronics integrate heat-spreader foams and high-rate supercapacitors for regenerative braking systems, aligning with vehicle lightweighting targets. Aerospace and defense pursue EMI-shielding composites and radiation-hard sensors. Medical devices transition from clinical trials to commercialization, with neuro-implants entering first-in-human evaluation in 2025. Industrial IoT leverages graphene gas sensors for methane and ammonia detection, preventing asset downtime. Cross-segment synergies multiply demand, as common material specs underpin multiple end uses.
By Manufacturing Technology: CVD Retains Primacy Amid Diversification
Chemical vapor deposition retained 46.51% share in 2024, with graphene electronics market size for CVD-derived products forecast to rise at 35.77% CAGR to 2030. Oxygen-free chambers boost monolayer yields above 90%, enabling device-grade uniformity over 200 mm wafers. Liquid-phase exfoliation remains favored for conductive inks and coatings, offering kilogram-scale throughput without high capital cost. Epitaxial growth on silicon carbide secures aerospace and quantum computing niches that prize ultra-high mobility and radiation hardness.
Reduction of graphene oxide appeals to cost-sensitive conductive paints, although conductivity stays one order of magnitude below pristine sheets. Mechanical and electrochemical exfoliation cater to research and specialty markets, supplying defect-free flakes for biosensing. Additive manufacturing progresses with composite filaments reaching 45 W m⁻¹ K thermal conductivity, enabling custom heat-sink geometries. Each process targets distinct price-performance points, ensuring multi-path supply resilience as demand scales.
Geography Analysis
Asia-Pacific held 41.98% revenue share in 2024 thanks to combined material supply, device assembly and massive consumer bases. China anchors capacity, converting domestic graphite into high-purity graphene with state incentives that subsidize CVD reactor purchases. Fudan University’s PoX memory breakthrough underpins next-generation compute chips aimed at national AI datacenters. South Korea secures transparent electrode leadership through government-backed display consortiums, while Japan channels expertise into diamond-graphene heterostructures for extreme-temperature power devices.
Europe leverages research depth and sustainability mandates to secure high-value niches. Germany hosts the world’s first graphene-photonics pilot line, funded under the EU Chips Act and anchored by Black Semiconductor. The Graphene Flagship’s 2D-Pilot Line coordinates metrology standards and wafer-level testing, giving regional suppliers a trusted-quality reputation. The United Kingdom scales graphene-reinforced carbon fiber through a GCC-backed USD 250 million plant, extending market reach into aerospace. European programs pair innovation grants with procurement commitments, creating stable demand signals.
North America concentrates on defense, 6G and sustainable fuel applications. DARPA projects create early-stage anchor customers for THz mixers and ultra-wideband antennas built on graphene. Ford’s multi-part vehicle rollout validates automotive volume, and US battery startups retrofit former lithium-metal lines to produce lithium-sulfur packs incorporating graphene hosts, shortening go-to-market timelines. However, reliance on overseas graphite drives federal initiatives to fund domestic mine-to-fab value chains. Canada’s abundant graphite reserves position it as a future supplier pivot.
South America, the Middle East and Africa currently trail in revenue but gain momentum through resource-based strategies. ADNOC Gas’ methane-to-graphene LOOP plant illustrates how hydrocarbon economies re-position toward low-carbon materials, producing both graphene and clean hydrogen. Brazil’s mineral investments target vertical integration into battery anodes, while South Africa explores vanadium-graphene hybrid flow batteries for grid storage. These regions could bypass legacy silicon and enter directly into next-generation manufacturing ecosystems.

Competitive Landscape
Over 250 companies contest the graphene electronics market, preventing any single participant from exceeding 5% revenue share. Producers cluster into upstream materials firms, midstream compounders and downstream device integrators. NanoXplore’s decade-long supply pact with a heavy-vehicle OEM highlights scale economies available to first movers. CAP-XX’s joint venture with Ionic Industries blends IP portfolios to accelerate supercapacitor commercialization, illustrating horizontal consolidation of complementary know-how.
Strategic focus shifts toward proprietary formulations and turnkey subsystem delivery. Film suppliers integrate patterning and encapsulation to capture higher margins, while oxide-ink vendors bundle printers and sintering modules. Patent analytics record 150,000 active filings; yet filings by consumer-electronics brands doubled between 2023 and 2025, indicating downstream pull. Quality certification and supply guarantees become differentiators as OEMs enforce multisourcing to hedge geopolitical risk. Investors reward firms offering cradle-to-gate ESG traceability, aligning with stricter environmental-disclosure regimes.
Looking ahead, M&A activity is expected to intensify. Tier-1 semiconductor houses eye acquisition of mid-tier CVD facilities to de-risk material supply, while chemical majors scout oxide dispersion startups for integration into specialty-coatings lines. Collaborative consortia around 6G, EV and quantum computing projects will further blur traditional industry boundaries, creating hybrid ecosystems melding materials science, photonics and system design.
Graphene Electronics Industry Leaders
Graphenea S.A.
NanoXplore Inc.
Haydale Graphene Industries plc
First Graphene Limited
Directa Plus S.p.A.
- *Disclaimer: Major Players sorted in no particular order

Recent Industry Developments
- June 2025: TU Delft researchers demonstrated quantum spin currents in graphene without magnetic fields, paving the way for spintronic on-chip memory.
- April 2025: Fudan University unveiled PoX memory with 400 ps write speeds—10,000 times faster than conventional flash.
- March 2025: New graphene electrode proposes silver replacement in photovoltaic lines, cutting costs while preserving efficiency.
- February 2025: Black Semiconductor opened FabONE in Aachen to pilot graphene-optical chips for AI workloads.


Global Graphene Electronics Market Report Scope
| Graphene Film |
| Graphene Oxide |
| Graphene Nano-Platelets |
| Few-Layer Graphene (FLG) |
| Monolayer and Bilayer Graphene |
| Graphene Foam and Aerogel |
| Transistors and Integrated Circuits |
| Sensors (Bio, Gas, Pressure, etc.) |
| Batteries and Ultracapacitors |
| Flexible and Transparent Displays |
| Photovoltaic and Optoelectronic Devices |
| Memory and Data-storage Devices |
| Consumer Electronics |
| Wearable Electronics and E-Textiles |
| Energy Storage and Power Electronics |
| Automotive and Transportation Electronics |
| Aerospace and Defense Systems |
| Healthcare and Medical Devices |
| Industrial and IoT Infrastructure |
| Chemical Vapour Deposition (CVD) |
| Liquid-Phase Exfoliation |
| Epitaxial Growth on SiC |
| Reduction of Graphene Oxide |
| Mechanical and Electrochemical Exfoliation |
| 3-D Printing / Additive Manufacturing |
| North America | United States | |
| Canada | ||
| Mexico | ||
| South America | Brazil | |
| Argentina | ||
| Rest of South America | ||
| Europe | Germany | |
| United Kingdom | ||
| France | ||
| Russia | ||
| Rest of Europe | ||
| Asia-Pacific | China | |
| Japan | ||
| India | ||
| South Korea | ||
| Australia | ||
| Rest of Asia-Pacific | ||
| Middle East and Africa | Middle East | Saudi Arabia |
| United Arab Emirates | ||
| Rest of Middle East | ||
| Africa | South Africa | |
| Egypt | ||
| Rest of Africa | ||
| By Material Type | Graphene Film | ||
| Graphene Oxide | |||
| Graphene Nano-Platelets | |||
| Few-Layer Graphene (FLG) | |||
| Monolayer and Bilayer Graphene | |||
| Graphene Foam and Aerogel | |||
| By Device Type | Transistors and Integrated Circuits | ||
| Sensors (Bio, Gas, Pressure, etc.) | |||
| Batteries and Ultracapacitors | |||
| Flexible and Transparent Displays | |||
| Photovoltaic and Optoelectronic Devices | |||
| Memory and Data-storage Devices | |||
| By Application | Consumer Electronics | ||
| Wearable Electronics and E-Textiles | |||
| Energy Storage and Power Electronics | |||
| Automotive and Transportation Electronics | |||
| Aerospace and Defense Systems | |||
| Healthcare and Medical Devices | |||
| Industrial and IoT Infrastructure | |||
| By Manufacturing Technology | Chemical Vapour Deposition (CVD) | ||
| Liquid-Phase Exfoliation | |||
| Epitaxial Growth on SiC | |||
| Reduction of Graphene Oxide | |||
| Mechanical and Electrochemical Exfoliation | |||
| 3-D Printing / Additive Manufacturing | |||
| By Geography | North America | United States | |
| Canada | |||
| Mexico | |||
| South America | Brazil | ||
| Argentina | |||
| Rest of South America | |||
| Europe | Germany | ||
| United Kingdom | |||
| France | |||
| Russia | |||
| Rest of Europe | |||
| Asia-Pacific | China | ||
| Japan | |||
| India | |||
| South Korea | |||
| Australia | |||
| Rest of Asia-Pacific | |||
| Middle East and Africa | Middle East | Saudi Arabia | |
| United Arab Emirates | |||
| Rest of Middle East | |||
| Africa | South Africa | ||
| Egypt | |||
| Rest of Africa | |||


Key Questions Answered in the Report
How fast is revenue growing for graphene electronics by 2030?
Market value is projected to rise from USD 1.1 billion in 2025 to USD 5.06 billion in 2030, equating to a 35.50% CAGR.
Which region currently leads in commercial output?
Asia-Pacific commands 41.98% share thanks to vertically integrated supply chains and strong policy support.
What device category uses the most graphene today?
Batteries and ultracapacitors represent 34.58% of 2024 revenue, reflecting immediate energy-storage gains.
Why are wearables considered a breakout segment?
Flexible, skin-safe graphene electrodes deliver reliable sensing and power storage, driving a 35.95% CAGR through 2030.
What is the main barrier to wider adoption in semiconductors?
The lack of harmonized electronic-grade quality standards forces costly lot qualification and slows scaling.
How concentrated is supplier power in this field?
The market is fragmented; no firm holds more than 5% revenue, giving buyers multiple sourcing options.
Page last updated on:


