Flexible Electronics Market Size and Share
Market Overview
| Study Period | 2020 - 2031 |
|---|---|
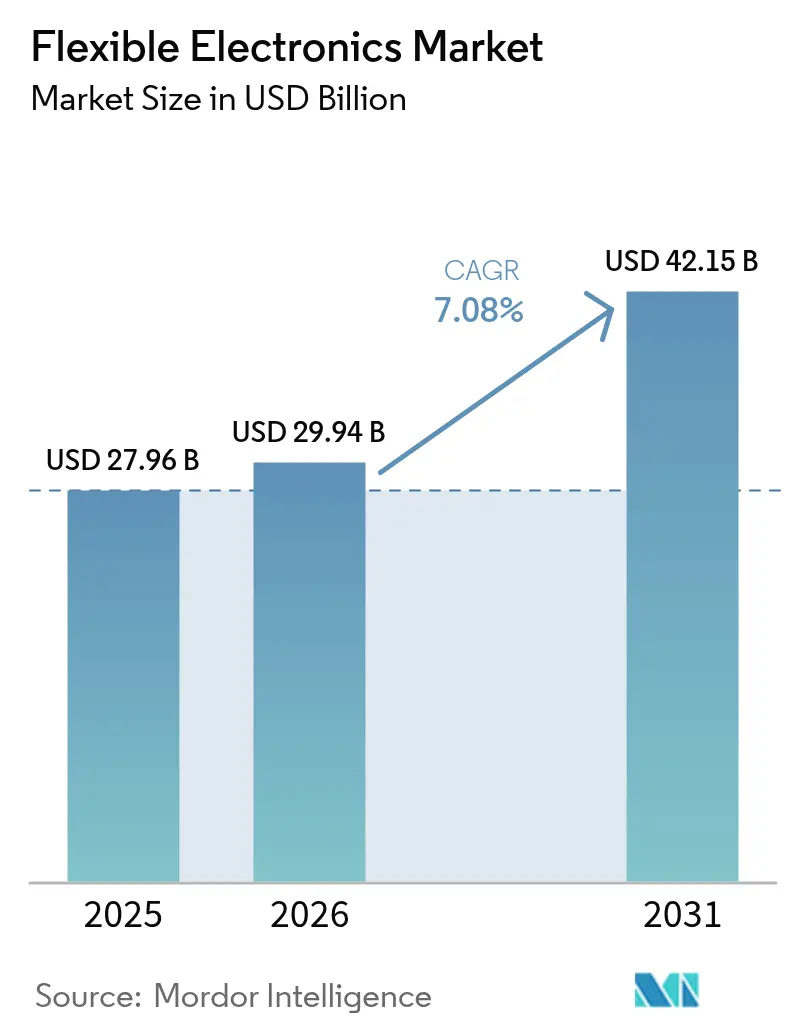
| Market Size (2026) | USD 29.94 Billion |
| Market Size (2031) | USD 42.15 Billion |
| Growth Rate (2026 - 2031) | 7.08% CAGR |
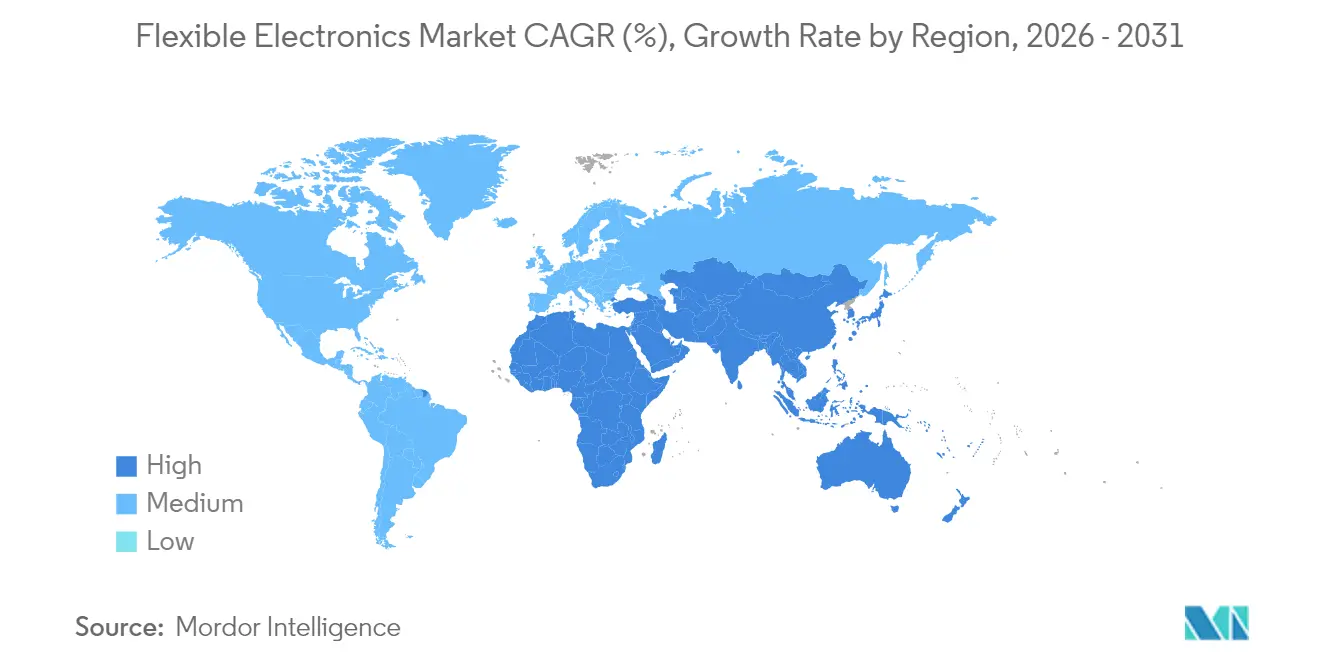
| Fastest Growing Market | Middle East and Africa |
| Largest Market | Asia Pacific |
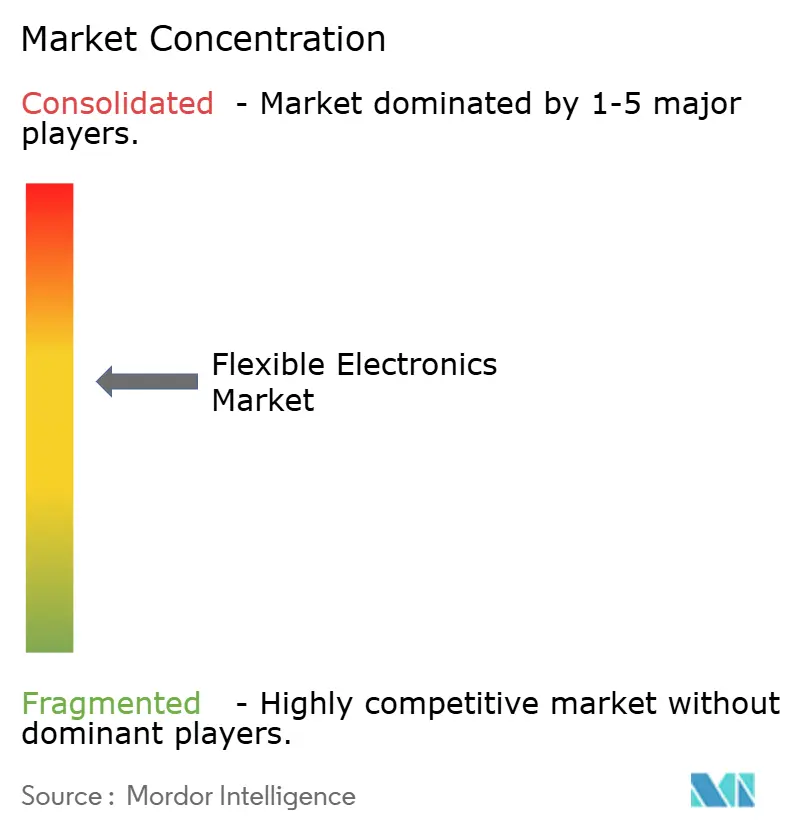
| Market Concentration | Medium |
Major Players *Disclaimer: Major Players sorted in no particular order Image © Mordor Intelligence. Reuse requires attribution under CC BY 4.0. | |
Flexible Electronics Market Analysis by Mordor Intelligence
The flexible electronics market size in 2026 is estimated at USD 29.94 billion, growing from 2025 value of USD 27.96 billion with 2031 projections showing USD 42.15 billion, growing at 7.08% CAGR over 2026-2031. The expansion stems from a shift away from niche prototypes toward mainstream deployments in smartphones, automobiles, and healthcare wearables, supported by ultra-thin OLED stacks, conformal sensor breakthroughs, and roll-to-roll production economics that lower entry costs. Demand accelerates as curved automotive head-up displays (HUDs) reshape cockpit design, while North American healthcare systems validate continuous monitoring patches that rely on stretchable biosensors. Investments from BOE and Samsung in Gen-8.6 AMOLED and ultra-thin OLED lines, coupled with Middle East defense programs prioritizing lightweight conformal antennas, further elevate the flexible electronics market’s momentum. At the same time, supply-chain concentration in high-barrier encapsulation films and the absence of universal reliability standards for stretchable interconnects temper growth prospects by raising qualification hurdles and cost uncertainty.
Key Report Takeaways
- By component, flexible displays led with 54.12% of flexible electronics market share in 2025; flexible sensors post the fastest CAGR at 8.78% through 2031.
- By material, plastic substrates accounted for 61.10% share of the flexible electronics market size in 2025, whereas metal foils are projected to expand at an 8.11% CAGR between 2026-2031.
- By technology, printed electronics held 59.25% share of the flexible electronics market size in 2025, while organic electronics shows the highest 10.12% CAGR forecast to 2031.
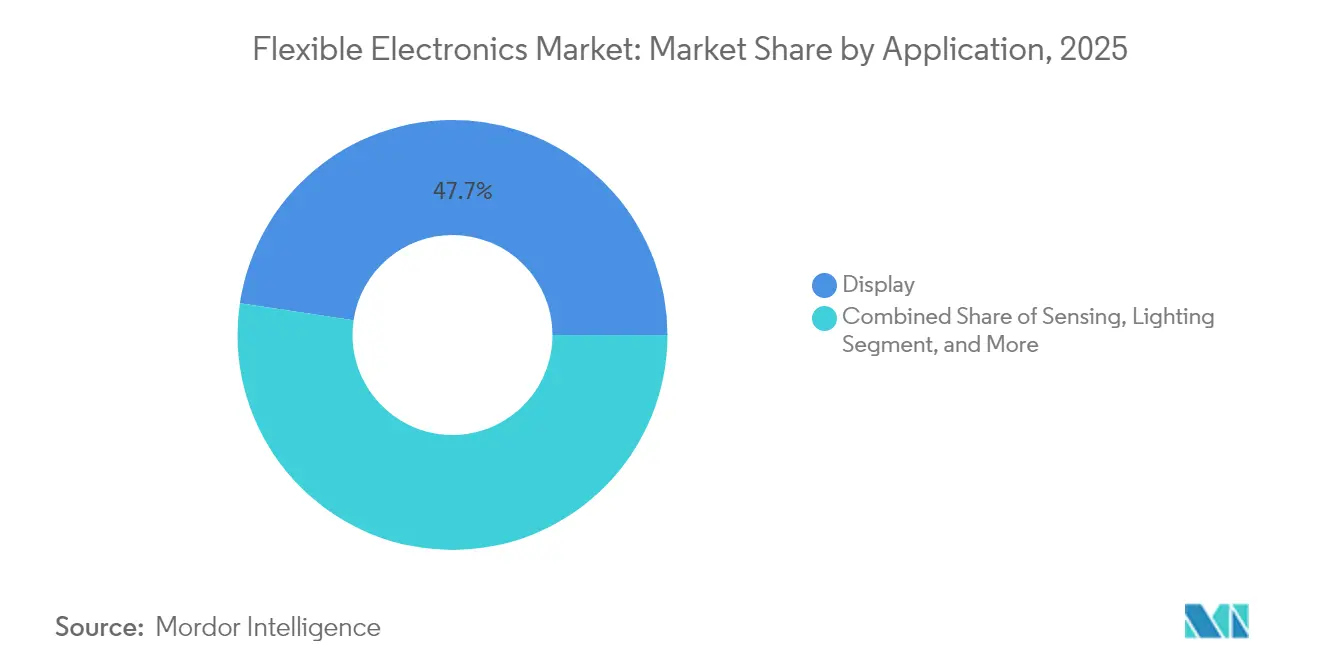
- By application, display solutions captured 47.65% share of the flexible electronics market size in 2025; sensing applications advance at a 7.22% CAGR to 2031.
- By end-user industry, consumer electronics led with 64.20% revenue share in 2025, yet healthcare devices are poised for a 13.18% CAGR through 2031 as regulatory approvals widen clinical use.
- by geography, Asia-Pacific dominated with 45.30% regional share in 2025; Middle East & Africa exhibits the fastest 11.05% CAGR outlook for 2026-2031.
Note: Market size and forecast figures in this report are generated using Mordor Intelligence’s proprietary estimation framework, updated with the latest available data and insights as of 2026.
Global Flexible Electronics Market Trends and Insights
Drivers Impact Analysis*
| Driver | (~) % Impact on CAGR Forecast | Geographic Relevance | Impact Timeline |
|---|---|---|---|
| Improved durability of ultra-thin OLED stacks | +1.80% | Global, led by Asia-Pacific | Medium term (2-4 years) |
| Demand for conformal sensors in medical patches | +1.20% | North America, expanding to EU | Long term (≥ 4 years) |
| Automotive cockpit digitization with curved HUDs | +0.90% | Europe, spill-over to North America | Medium term (2-4 years) |
| Roll-to-roll cost reduction for printed ICs | +1.40% | Asia-Pacific core, global impact | Long term (≥ 4 years) |
| Defense need for lightweight conformal antennas | +0.70% | Middle East, global defense | Short term (≤ 2 years) |
| ESG push for flexible PV skins on buildings | +0.60% | Global, early EU/NA adoption | Long term (≥ 4 years) |
| Source: Mordor Intelligence | |||
Improved durability of ultra-thin OLED stacks enabling foldable smartphones
Samsung Display’s Flex Magic Pixel demonstrator passed military-grade durability tests, eliminating visible creases and meeting user expectations for robust folding screens. Apple’s 2026 foldable iPhone order for 9-15 million 7.8-inch panels validates commercial readiness and signals mass adoption. Weight reductions of 30% and power savings of 30% in 2026 laptop panels widen the addressable device pool beyond phones. These advances resonate across the flexible electronics market as OEMs migrate tablets and laptops toward bendable formats, reinforcing supply-chain demand for high-barrier encapsulation and ultra-thin glass.
Demand for conformal sensors in wearable medical patches across North America
FDA clearance for X-trodes’ Smart Skin and UC San Diego’s 1,024-channel brain sensor array legitimizes flexible biosensors for continuous monitoring. Health-system reimbursement models pivot toward outcome-based care, favoring devices that capture longitudinal patient data. Flexible substrates reduce motion artifacts, maintaining signal integrity during everyday activities. Device makers tap organic electrochemical transistors for in-sensor computing, minimizing latency and protecting patient privacy. As reimbursement codes codify remote monitoring, the flexible electronics market benefits from recurrent sensor and patch replacements.
Automotive cockpit digitization driving curved HUD adoption in Europe
Zeiss and Hyundai Mobis target 2027 mass production of holographic windshield HUDs, integrating navigation overlays without obstructing driver vision. [1]Optics.org, “Zeiss, Hyundai Mobis hook up on holographic windshield displays,” optics.org AUO’s Smart Cockpit illustrates micro-LED surfaces across dashboards and sunroofs, merging ambient lighting with driver alerts. Infineon and Marelli’s MEMS laser beam scanning eliminates traditional display backplanes, shrinking package depth for curved instruments. European regulations emphasizing driver distraction mitigation push OEMs to adopt intuitive visual cues, boosting demand for bendable displays and integrated sensor layers.
Roll-to-roll manufacturing cost reduction in Asia for printed ICs
VTT’s Printocent Pilot Factory demonstrates continuous printing of fully recyclable ECG patches, merging biomaterials with silver nanowire inks. Scaling from lab to industrial lines extends calibration cycles yet drops unit cost once stabilized. China’s share of global OLED panel output rose to 53.4% in 2024 as local fabs ramped Gen-8.6 capacity, capturing orders from global smartphone brands. These economics anchor Asia-Pacific’s leadership in the flexible electronics market, enabling downstream device makers to launch lower-price foldable gadgets.
Restraints Impact Analysis*
| Restraint | (~) % Impact on CAGR Forecast | Geographic Relevance | Impact Timeline |
|---|---|---|---|
| Yield Losses in Large-area Printing of Metallic Inks | -1.2% | Global, acute in Asia-Pacific manufacturing hubs | Medium term (2-4 years) |
| Limited Standardization of Stretchable Interconnect Reliability Tests | -0.8% | Global, acute in North America and EU | Medium term (2-4 years) |
| Supply-chain Concentration of High-barrier Encapsulation Films | -0.5% | Global, critical for Asia-Pacific manufacturing | Short term (≤ 2 years) |
| Disposal and Recycling Complexities of Poly-imide Substrates | -0.3% | EU and North America regulatory focus | Long term (≥ 4 years) |
| Source: Mordor Intelligence | |||
Limited standardization of stretchable interconnect reliability tests
Rigid-electronics standards fail to capture simultaneous bending, twisting, and temperature cycling seen in wearable use. IEEE’s draft bladder-inflation method measures multi-axis stretch but remains voluntary, deterring automotive and medical OEMs that require certified lifetime data. Researchers propose polymer interlayer designs to curb substrate cracking under strain, yet without consensus metrics investors hesitate to fund high-volume tooling. The flexible electronics market thus faces slower design-win cycles until unified protocols emerge.
Yield Losses in Large-area Printing of Metallic Inks
Defects in metallic ink printing hinder flexible electronics by causing yield losses, especially in cost-sensitive applications like RFID tags and smart packaging. Achieving consistent ink properties at scale is challenging, as particle size and distribution affect conductivity. Transitioning to industrial-scale printing extends timelines due to recalibrations. While CuMOD inks reduce performance variations, ensuring uniform results across large areas remains difficult. A -1.2% CAGR reflects manufacturers' reluctance to scale production, limiting market growth until process reliability improves.
*Our forecasts treat driver/restraint impacts as directional, not additive. The impact forecasts reflect baseline growth, mix effects, and variable interactions.
Segment Analysis
By Component: Displays Dominate While Sensors Accelerate
Flexible displays accounted for 54.12% of flexible electronics market share in 2025, powered by relentless foldable smartphone launches and curved automotive dashboards. Samsung’s 18.1-inch foldable prototype proves scalability into laptops, while LG’s stretchable micro-LED panel unlocks 3D surfaces in fashion and in-vehicle lighting. Complementing displays, the sensor category yields a 8.78% CAGR over 2026-2031 as hospitals adopt epidermal ECG and EEG patches for chronic care. Quantum-dot display-sensor hybrids that tolerate 1.5× stretching herald multifunctional surfaces that both show and sense data, positioning sensors as the next growth catalyst. Despite progress, flexible batteries and memory lag due to safety and yield hurdles, limiting fully integrated flexible systems today.
The flexible electronics market benefits from panel makers leveraging transparent OLED stacks to embed fingerprint and SpO₂ reading directly under the screen, condensing component count and thinning device profiles. Integrated biosensing displays open new monetization avenues for smartphone vendors seeking differentiation. Energy-harvesting films that convert vibration into micro-watts reduce battery load in wearables and industrial tags, though commercialization awaits stable supply of high-performance piezoelectric polymers. As cross-component synergies mature, device architects can design seamless form factors that merge visual, haptic, and sensing capabilities.


By Material: Plastic Substrates Lead Despite Metal Foil Innovation
Plastic substrates represented 61.10% of flexible electronics market size in 2025, driven by mature polyimide supply chains aligned with display fabs. Their thermal stability up to 400 °C pairs well with copper traces, minimizing delamination in automotive dashboards exposed to wide temperature swings. Metal foils, chiefly copper and stainless steel, post an 8.11% CAGR thanks to innate conductivity and EMI shielding valued in defense radios and high-speed data cables. Graphene-coated copper nanowires offer lower sheet resistance than indium-tin-oxide while retaining flexibility, attracting interest for roll-to-roll touch sensors.
Ultra-thin glass gains traction in premium foldable devices requiring pristine optics and scratch resistance. At just 30 µm, Corning’s latest glass can bend to 5 mm radius without fracture, albeit at a higher price point than polymer. Silver-nanowire ink advances, accelerated by DuPont’s 2024 C3Nano asset purchase, improve transparency and mechanical resilience for smart windows. Carbon-based conductive inks address ESG mandates by eliminating scarce indium and toxic solvents, appealing to builders of flexible photovoltaics integrated into façades. Material selection now balances cost, performance, and recyclability as regulators scrutinize electronic waste.
By Technology: Printed Electronics Foundation Enables Organic Innovation
Printed electronics held 59.25% of flexible electronics market size in 2025, the result of leveraging existing gravure and screen-printing equipment to mass-produce antennas, RFID tags, and basic sensor circuits. Inks formulated with silver flake or carbon nanotubes enable feature sizes adequate for NFC coils and moisture sensors. Organic electronics registers the highest 10.12% CAGR, propelled by breakthroughs in stretchable organic solar cells achieving 19% efficiency with tenfold elongation. Organic semiconductors’ low-temperature processing allows direct deposition onto textiles, expanding design freedom for apparel and medical garments.
Thin-film inorganic electronics defend niches requiring sub-10 nm channel lengths and extreme temperature resilience, such as aerospace radar phased-arrays. Hybrid stacks that co-print organic logic atop oxide TFT backplanes combine the drive current of inorganic layers with the flexibility of organics. Research into self-healing dielectric layers promises longer device lifetimes, addressing a key adoption hurdle. As printer line-width shrinks and registration accuracy improves, printed electronics will transition from simple identifiers to moderately complex logic, trimming BOM costs for disposable health sensors.
By Application: Display Applications Mature While Sensing Accelerates
Display applications captured 47.65% of flexible electronics market size in 2025, underscored by Samsung’s Sensor OLED prototype integrating biometric capture under the panel. Foldable phones and tablets employ hinge geometries previously impossible with rigid glass, while automotive interiors adopt pillar-to-pillar curved screens that merge cluster, infotainment, and passenger displays. Sensing applications grow at 7.22% CAGR as hospitals embrace wearable ultrasound and e-skin patches enabling at-home diagnostics previously bound to clinics. Continuous glucose monitoring moves from invasive probes to optical patches leveraging micro-LED emitters on pliable substrates
Lighting solutions leverage flexible OLED strips for uniform ambient glow along architectural contours, though adoption is limited by lifetime concerns. Energy harvesting films lining building façades generate supplemental power, advancing net-zero objectives in Europe’s retrofit market. RFID and smart labels remain stable, serving retail and logistics where unit cost trumps performance. The application mix indicates a pivot toward functionality as markets look beyond spectacle displays to problem-solving sensors and power skins.
By End-User Industry: Consumer Electronics Dominance Faces Healthcare Disruption
Consumer electronics retained 64.20% revenue share in 2025, fueled by record foldable smartphone shipments and tablet refreshes incorporating bendable hinges. Brands differentiate through screen continuity with minimal crease visibility, capturing premium price points. Yet healthcare devices outpace overall growth, posting a 13.18% CAGR by exploiting FDA pathways for remote diagnostics. Hospitals shift to outcome-based reimbursements that favor continuous patient data, encouraging adoption of disposable EEG caps and wound-healing sensors.
Automotive OEMs embed flexible displays in dashboards and headliners, pairing them with MEMS lidar modules conforming to vehicle curves. Defense contractors adopt antenna arrays printed on aerogel to cut weight in UAV airframes, while industrial IoT players use peel-and-stick vibration sensors for predictive maintenance. The University of Hong Kong’s in-sensor computing array shows how flexible devices can process data locally, shrinking latency and bandwidth needs. Cross-industry diffusion underscores the flexible electronics market’s maturation into a platform technology serving divergent requirements.
Geography Analysis
Asia-Pacific commanded 45.30% of flexible electronics market share in 2025, anchored by China’s manufacturing scale and Korea’s OLED innovation pipeline. BOE’s USD 9 billion Gen-8.6 AMOLED fab in Chengdu-the city’s largest single industrial investment-expands panel capacity for tablets and automotive cockpits. Korean institutes pushed piezoelectric harvester output 280×, underscoring regional leadership across displays, sensors, and energy devices. Japan contributes precision deposition tools and ultra-thin glass that support foldable handset reliability.
North America focuses on high-value healthcare and defense niches, leveraging FDA clearances for flexible biosensors and Pentagon funding for battlefield antenna arrays. Samsung’s USD 240 million Yokohama packaging R&D hub highlights cross-border collaboration, as Asian suppliers co-locate near U.S. system integrators. Silicon Valley startups pioneer flexible IC design automation, shortening tape-out cycles for printed logic that feeds disposable diagnostics.
Europe prioritizes automotive digitization and sustainability. German OEMs mandate holographic HUD integration by 2028, driving demand for bendable displays meeting stringent glare and impact standards. EU directives on building-integrated photovoltaics spur trials of façade-embedded flexible PV skins. Simultaneously, strict e-waste rules push recyclability, accelerating research into biodegradable substrates.
Middle East and Africa posts the highest 11.05% CAGR as defense modernization and smart-city programs embrace conformal electronics for weight-sensitive drones and harsh-climate sensors. Governments fast-track 5G and edge networks, creating pull for flexible antennas resistant to sand and heat. Regional universities partner with European labs on organic PV to power off-grid IoT nodes, broadening application diversity.

Competitive Landscape
The flexible electronics market exhibits moderate concentration. Samsung Display, LG Display, and BOE Technology collectively deliver the majority of high-volume OLED panels, yet their combined share leaves room for nimble entrants. Samsung’s Dolby tie-up for automotive HDR displays exemplifies incumbents’ strategy to move up the value chain. BOE’s Apple LTPS OLED win demonstrates China’s closing technology gap, intensifying price competition.
Outside displays, the field fragments across components. PragmatIC Semiconductor secured USD 231 million to scale ultra-low-cost flexible ICs, threatening silicon for mass RFID. DuPont’s electronics spin-off and C3Nano nanowire asset purchase signal vertical integration among material suppliers. GE Aerospace’s Sensiworm aircraft-inspection device winning a FLEXI Award shows aerospace incumbents harnessing flexible hybrid electronics for maintenance automation.
Strategic moves include Infineon-Marelli MEMS scanning partnership to unlock curved cockpit architectures, and Flex’s Crown Technical Systems acquisition to bolster power distribution modules in data centers. Energy-harvesting breakthroughs from Korean labs foreshadow start-ups commercializing wearable power sources. Overall, alliances, acquisitions, and government-funded pilots shape competitive dynamics as players jostle for design wins across diverging verticals.
Flexible Electronics Industry Leaders
Samsung Display Co. Ltd
LG Display Co. Ltd
BOE Technology Group Co. Ltd
AU Optronics Corp.
E Ink Holdings Inc.
- *Disclaimer: Major Players sorted in no particular order

Recent Industry Developments
- May 2025: Samsung Display began producing ultra-thin OLED panels at a new USD 3.1 billion line, targeting 30% lighter laptops slated for 2026 launches.
- April 2025: DuPont announced plans to spin off its USD 5.9 billion electronics division, reshaping supply options for conductive inks.
- April 2025: Infineon Technologies and Marelli partnered on MEMS laser beam scanning displays for automotive cockpits.
- February 2025: BOE Technology secured a 15 million-panel LTPS OLED order for Apple’s iPhone 16e, surpassing Samsung Display and LG Display.


Research Methodology Framework and Report Scope
Market Definitions and Key Coverage
Our study treats the flexible electronics market as every circuit, sensor, battery, or display produced on bendable or ultra-thin substrates, typically polyimide films, metal foils, or flexible glass, that can curve, roll, or stretch without losing electrical integrity. Devices made on rigid FR-4 boards or standard glass are outside this remit.
Scope Exclusion: Conventional rigid printed-circuit boards and crystalline-silicon photovoltaic panels are not counted.
Segmentation Overview
- By Component
- Flexible Displays
- OLED
- E-Paper
- Others
- Flexible Sensors
- Biosensors
- Pressure Sensors
- Temperature Sensors
- Others
- Flexible Batteries
- Flexible Memory
- Flexible Photovoltaics
- Others
- Flexible Displays
- By Material
- Plastic Substrate
- Glass (Ultra-thin)
- Metal Foils
- Conductive Inks
- Dielectrics/Encapsulation
- By Technology
- Printed Electronics
- Organic Electronics
- Thin-Film Inorganic Electronics
- Hybrid Systems
- By Application
- Sensing
- Lighting
- Display
- Energy Harvesting
- RFID and Smart Labels
- Others
- By End-User Industry
- Consumer Electronics
- Automotive and Transportation
- Healthcare and Medical Devices
- Military and Defense
- Industrial and IoT
- Others
- By Geography
- North America
- United States
- Canada
- Mexico
- Europe
- Germany
- United Kingdom
- France
- Nordics
- Rest of Europe
- South America
- Brazil
- Rest of South America
- Asia-Pacific
- China
- Japan
- India
- South-East Asia
- Rest of Asia-Pacific
- Middle East and Africa
- Middle East
- Gulf Cooperation Council Countries
- Turkey
- Rest of Middle East
- Africa
- South Africa
- Rest of Africa
- Middle East
- North America
Detailed Research Methodology and Data Validation
Primary Research
To ground secondary patterns, we interviewed material chemists, printed-sensor start-ups, Asian roll-to-roll integrators, and procurement leads at wearable-device brands across North America, Europe, and APAC. Insights on yield losses, substrate price moves, and emerging medical-patch demand helped us refine assumptions and stress-test early outputs.
Desk Research
We began with public datasets such as UN Comtrade roll-to-roll equipment exports, IPC world PCB production statistics, United States Patent Office grants on stretchable interconnects, and OECD trade-weighted average OLED panel prices, which together frame volume and value baselines. Trade association white papers from SEMI, FlexTech Alliance, and the Japan Electronics and Information Technology Industries Association provided trend signposts, while 10-K filings from leading panel makers revealed segment revenue splits. Mordor analysts then tapped paid resources, D&B Hoovers for supplier financials and Dow Jones Factiva for deal flow, to cross-check competitive footprints. The sources cited above are illustrative; many additional references informed data validation.
Market-Sizing & Forecasting
We apply a blended top-down and bottom-up model. Top-down starts with global shipments of foldable smartphones, automotive curved-display area, and printed sensor square meterage; these demand pools are converted to revenue using region-specific average selling prices. Selective bottom-up checks, supplier roll-ups and channel ASP, volume samples align the totals. Key variables include conductive-ink price trends, roll-to-roll manufacturing yield improvements, and regulatory incentives for in-car head-up displays. Multivariate regression, complemented by ARIMA smoothing for cyclical components, projects each driver through 2030; scenario analysis adjusts for material cost shocks. Where granular shipment data are missing, we gap-fill with weighted averages derived from verified expert ranges.
Data Validation & Update Cycle
Outputs undergo variance checks against external shipment tallies, internal peer review, and a senior analyst sign-off. The model is refreshed annually, with interim updates triggered by material events such as breakthrough substrate pricing shifts before any client delivery.
Why Our Flexible Electronics Baseline Earns Decision-Makers' Trust
Published market values often diverge because firms select different product scopes, price ladders, and refresh cadences.
Key gap drivers include: some publishers fold in rigid-flex boards or thin-film PV, others extrapolate vendor press releases without reconciling to trade data, and a few adopt single-scenario forecasts that over-accentuate optimistic R&D ramps. Mordor's disciplined scope, dual-path modeling, and yearly refresh narrow these gaps, giving users a balanced, transparent starting point for strategy.
Benchmark comparison
| Market Size | Anonymized source | Primary gap driver |
|---|---|---|
| USD 27.96 Bn (2025) | Mordor Intelligence | - |
| USD 29.40 Bn (2024) | Global Consultancy A | Includes rigid-flex boards and thin-film PV; older currency baseline |
| USD 26.94 Bn (2023) | Trade Journal B | Relies on press releases; conservative ASP progression, limited cross-checks |
| USD 34.77 Bn (2024) | Research Publisher C | Adds stretchable packaging films; single growth scenario |
In sum, the comparison shows how scope breadth and assumption rigor sway numbers; Mordor's methodology, anchored to verifiable variables and iterative validation, delivers the most dependable baseline for investors, suppliers, and policymakers alike.


Key Questions Answered in the Report
What is the current size of the flexible electronics market?
The flexible electronics market size stands at USD 29.94 billion in 2026, with projections reaching USD 42.15 billion by 2031.
Which component segment leads the market?
Flexible displays lead, holding 54.12% of flexible electronics market share in 2025 due to strong demand in foldable smartphones and automotive dashboards.
Which region is growing the fastest?
Middle East and Africa shows the fastest growth with an 11.05% CAGR forecast for 2026-2031, driven by defense modernization and smart-city projects.
Why are ultra-thin OLED stacks important?
Improved durability and reduced crease visibility from ultra-thin OLED stacks enable mainstream adoption of foldable phones and laptops, adding about 1.8 percentage points to the market’s CAGR.
How are healthcare applications impacting market growth?
FDA approvals for flexible biosensors support a 13.18% CAGR in healthcare devices, shifting monitoring from clinics to continuous wearable platforms and boosting sensor demand.
What challenges hinder wider adoption?
Lack of standardized reliability tests for stretchable interconnects and supply-chain concentration in high-barrier encapsulation films create cautious adoption cycles and cost volatility.
Page last updated on:


