
Technology, Media and Telecom
5th MayPricing Strategy for Semiconductor Components
3 Min Read
The Nanotechnology Market Report is Segmented by Type (Nanomaterials, Nanocomposites, and More), Manufacturing Process (Top-Down, and Bottom-Up), Material Category (Carbon-Based Nanomaterials, and More), Application (Electronics and Computing, and More), End-User Industry (Pharmaceuticals and Biotechnology, and More), and Geography (North America, Europe, and More). The Market Forecasts are Provided in Terms of Value (USD).
Market Overview
| Study Period | 2020 - 2031 |
|---|---|
| Market Size (2026) | USD 118.73 Billion |
| Market Size (2031) | USD 220.8 Billion |
| Growth Rate (2026 - 2031) | 13.21 % CAGR |
| Fastest Growing Market | Middle East and Africa |
| Largest Market | Asia Pacific |
| Market Concentration | Medium |
Major Players *Disclaimer: Major Players sorted in no particular order. Image © Mordor Intelligence. Reuse requires attribution under CC BY 4.0. |
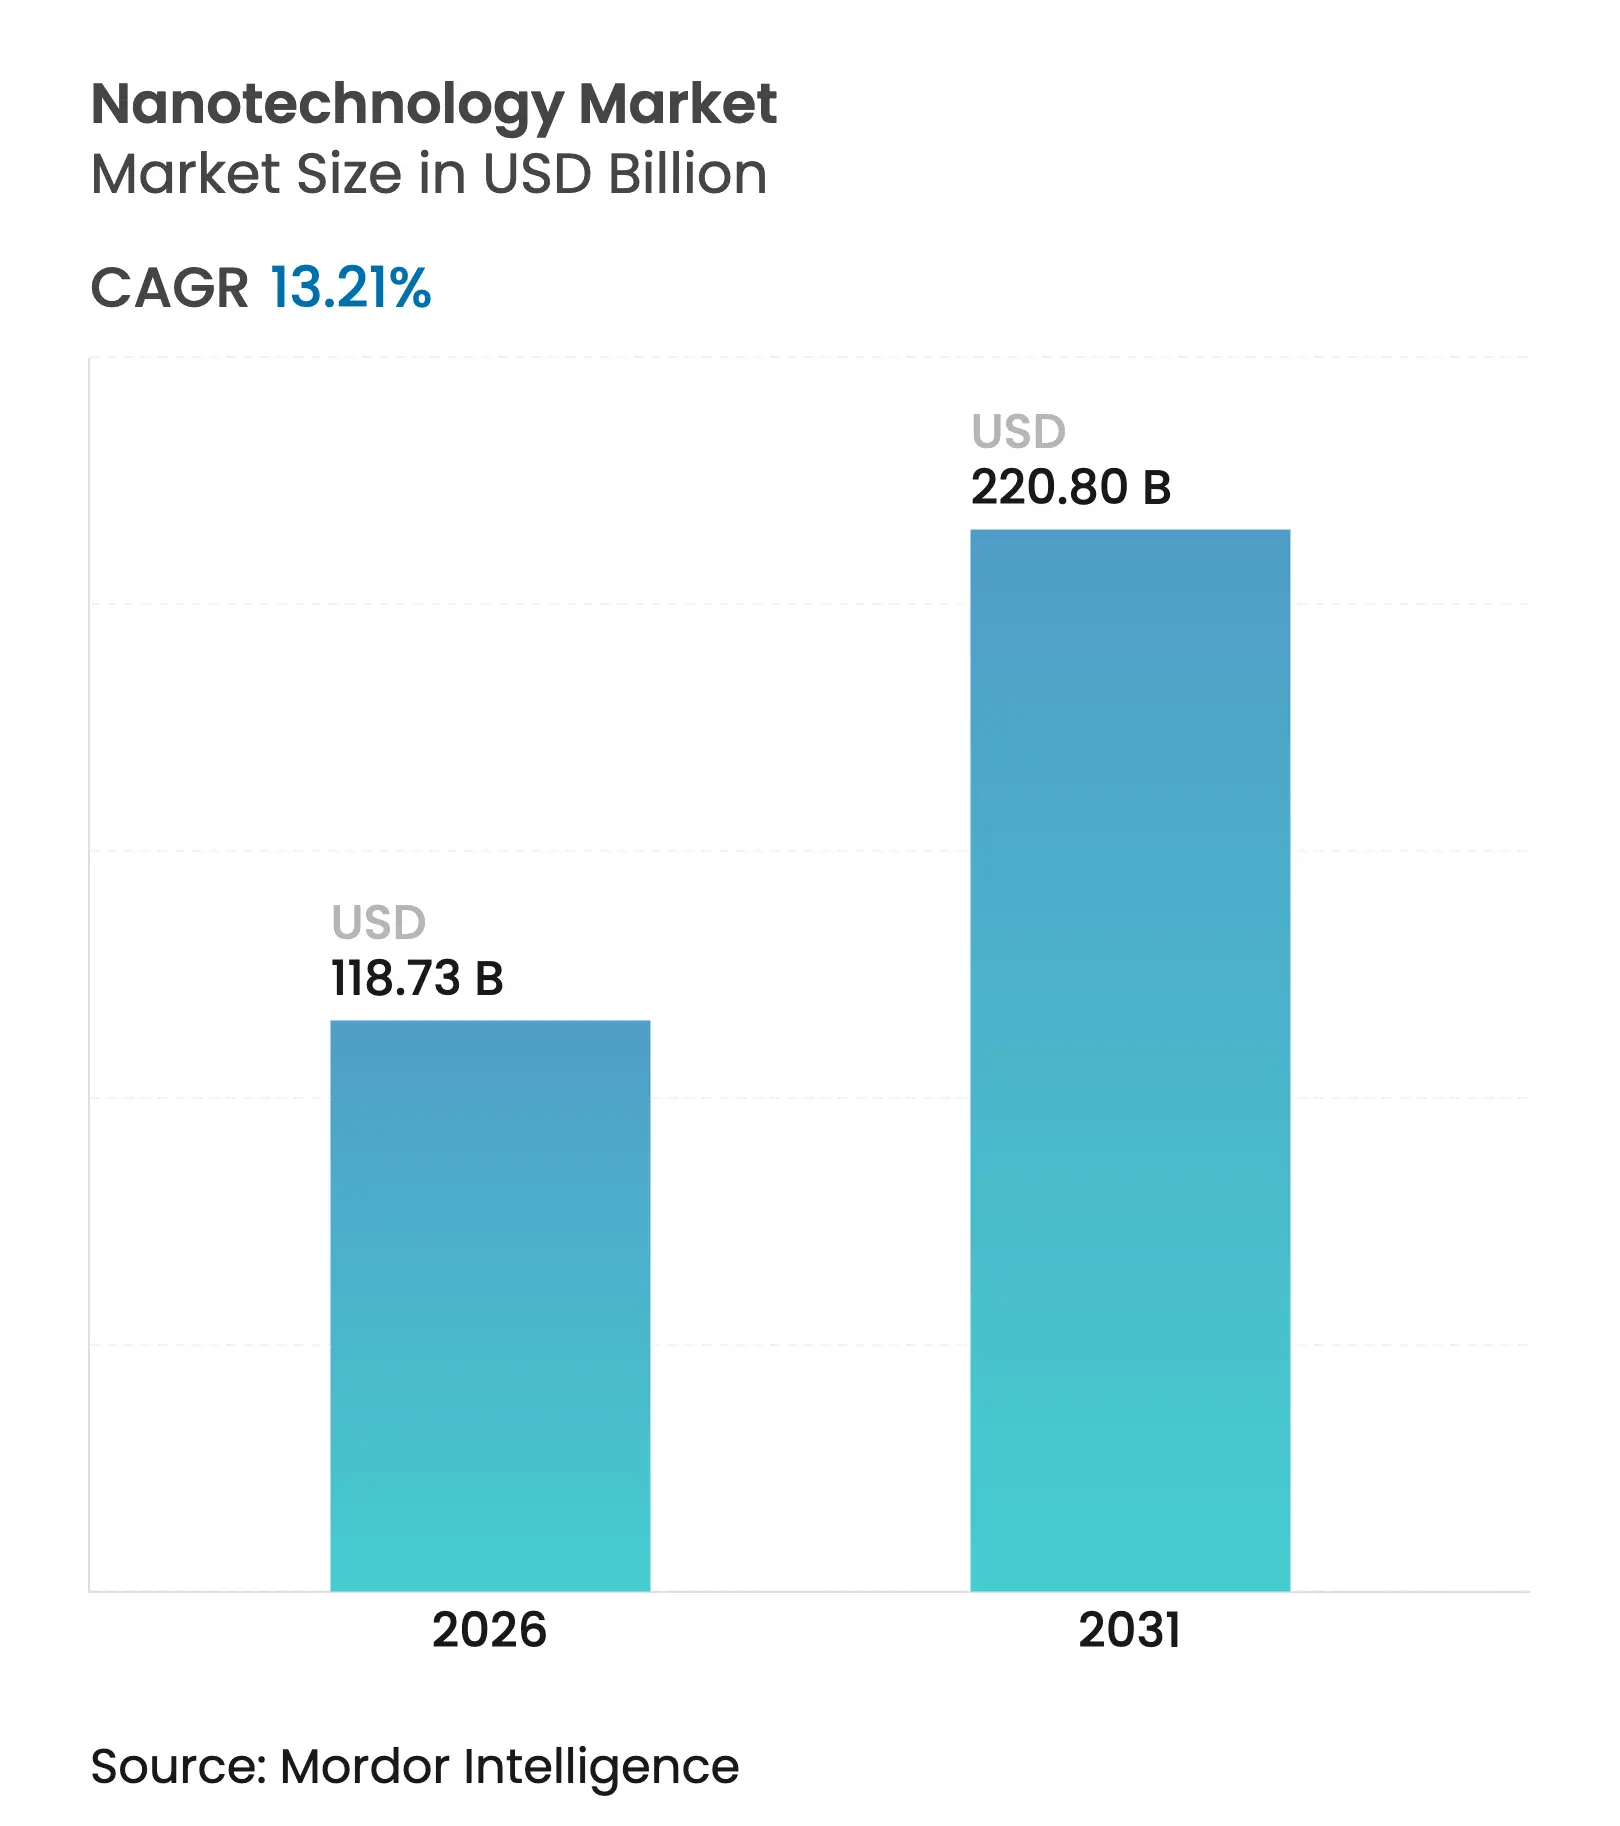
The nanotechnology market size is expected to grow from USD 104.88 billion in 2025 to USD 118.73 billion in 2026 and is forecast to reach USD 220.8 billion by 2031 at 13.21% CAGR over 2026-2031. The sharp rise mirrors sovereign technology policies, post-pandemic healthcare priorities, and clean-energy mandates that are resetting industrial demand patterns. Growth is reinforced by the use of lipid nanoparticles in mRNA vaccines, silicon nanowire anodes that can triple electric-vehicle range, and quantum-dot displays that raise color performance without line overhauls. Asia-Pacific remains the production powerhouse, while the Middle East and Africa accelerate on the back of state-funded research hubs. Bottom-up manufacturing keeps the cost edge, yet top-down lithography grows fastest as semiconductor makers chase smaller nodes. Regulatory actions are a double-edged sword: the US CHIPS Act pours capital into domestic fabs, whereas stricter REACH reviews delay certain metal-oxide nanoparticle launches.
Key Report Takeaways
Note: Market size and forecast figures in this report are generated using Mordor Intelligence's proprietary estimation framework, updated with the latest available data and insights as of 2026.
Drivers Impact Analysis
| Driver | (~) % Impact on CAGR Forecast | Geographic Relevance | Impact Timeline | |||
|---|---|---|---|---|---|---|
Surge in mRNA-lipid nanoparticle demand for next-gen vaccines Surge in mRNA-lipid nanoparticle demand for next-gen vaccines | +2.1% | Global, concentrated in North America and EU | Medium term (2-4 years) | (~) % Impact on CAGR Forecast: +2.1% | Geographic Relevance: Global, concentrated in North America and EU | Impact Timeline: Medium term (2-4 years) |
EU Green Deal funding for nano-enabled energy-efficient buildings EU Green Deal funding for nano-enabled energy-efficient buildings | +1.8% | Europe, spill-over to North America | Long term (≥ 4 years) | |||
Rapid adoption of quantum-dot displays by Asian TV OEMs Rapid adoption of quantum-dot displays by Asian TV OEMs | +1.6% | APAC core, global spill-over | Short term (≤ 2 years) | |||
United States CHIPS Act support for domestic nanosensor fabs United States CHIPS Act support for domestic nanosensor fabs | +1.4% | North America, global partnerships | Medium term (2-4 years) | |||
Rise of nano-enabled antimicrobial coatings in hospitals Rise of nano-enabled antimicrobial coatings in hospitals | +1.2% | Developed markets worldwide | Short term (≤ 2 years) | |||
Battery anode breakthroughs using silicon nanowires for EV range Battery anode breakthroughs using silicon nanowires for EV range | +2.3% | China and North America lead | Medium term (2-4 years) | |||
| Source: Mordor Intelligence | ||||||
Surge in mRNA-lipid nanoparticle demand for next-gen vaccines
Lipid nanoparticles have shifted from a pandemic solution to a backbone for precision medicine. Ionizable cationic lipids such as ALC0315 and SM102 now secure > 95% delivery efficiency, while FDA guidance issued in 2024 clarifies characterization rules for nanomaterial drugs.[1]U.S. Food and Drug Administration, “Considerations for Drug Products that Contain Nanomaterials,” fda.gov Academic groups continue to refine formulations; DOPE-Cx lipids from Hokkaido University lift expression levels and cut cytotoxicity. Momentum is therefore structural, not cyclical, and underpins steady capacity additions by contract drug manufacturers.
EU Green Deal-led funding of nanotech for energy-efficient buildings
The EU anchors building-efficiency targets in law, creating predictable demand for nano-enhanced insulation and smart glazing. Projects such as EXMOLS use synthetic DNA to self-assemble photoactive semiconductors for next-generation panels.[2]European Commission, “Nanotechnology,” ec.europa.eu Commercial roll-outs include BASF’s trademark product Slentite aerogel panels that meet tougher thermal codes while cutting wall thickness. The long asset life of buildings elongates revenue streams for suppliers of compliant nanomaterials.
Rapid adoption of quantum-dot displays by Asian TV OEMs
Sony and Samsung anchor premium line-ups on quantum-dot films that push LCD panels toward Rec. 2020 color. Perovskite dots ease stability worries and integrate with micro-LED backplanes for higher resolution.[3]Jae-Hyeung Park, “Advances in Display Technology,” Journal of Information Display, tandfonline.com Asian supply-chain clustering lowers unit cost, bolsters margins, and widens the technology gap with rivals in other regions. The pull-through effect boosts upstream demand for cadmium-free quantum-dot inks and patterning tools.
United States CHIPS Act boosting domestic nanosensor fabrication
USD 52.7 billion of incentives include USD 11 billion for research programmes run by NIST, with nanosensors flagged as critical nodes. Defense users add USD 2 billion via the Microelectronics Commons program, aiming to shorten prototyping cycles for security-sensitive components.[4]Center for Strategic and International Studies, “Tracking CHIPS Act Incentives,” csis.org Cluster investments in Arizona, Ohio, and New York tie university labs to new fabs, quickening tech transfer and lowering import dependence.
Restraints Impact Analysis
| Restraint | (~) % Impact on CAGR Forecast | Geographic Relevance | Impact Timeline | |||
|---|---|---|---|---|---|---|
Toxicology gaps delaying REACH approvals for metal-oxide nanoparticles Toxicology gaps delaying REACH approvals for metal-oxide nanoparticles | -1.9% | Europe, global spill-over | Medium term (2-4 years) | (~) % Impact on CAGR Forecast: -1.9% | Geographic Relevance: Europe, global spill-over | Impact Timeline: Medium term (2-4 years) |
High CAPEX of atomic-layer deposition production lines High CAPEX of atomic-layer deposition production lines | -1.6% | Semiconductor hubs worldwide | Long term (≥ 4 years) | |||
Supply bottlenecks for high-purity rare-earths in nanocatalysts Supply bottlenecks for high-purity rare-earths in nanocatalysts | -1.4% | Most acute in APAC | Short term (≤ 2 years) | |||
Public perception risk from “forever-nano” environmental persistence Public perception risk from “forever-nano” environmental persistence | -1.1% | Developed markets | Long term (≥ 4 years) | |||
| Source: Mordor Intelligence | ||||||
Toxicology gaps delaying REACH approvals for metal-oxide nanoparticles
Extended dossier reviews for titanium dioxide and zinc oxide delay cosmetics launches, because ECHA seeks fuller hazard data. The 2024 ban on 12 nano-forms of gold, silver, and copper magnifies uncertainty. Firms with legacy safety files gain an edge, while smaller entrants face multiyear, high-cost studies that sap capital and slow time-to-market.
High CAPEX of atomic-layer deposition (ALD) production lines
State-of-the-art ALD tools can cost USD 80 million each and demand ultra-clean rooms, limiting entrants to well-capitalized chipmakers. Though annual ALD equipment sales top USD 1.8 billion, capacity expansions trail demand for advanced packaging and micro-LED backplanes. Smaller innovators must either license capacity or forge joint ventures, constraining output and slowing adoption in emerging fields such as flexible electronics.
By Type: Nanodevices Capture Revenue Momentum
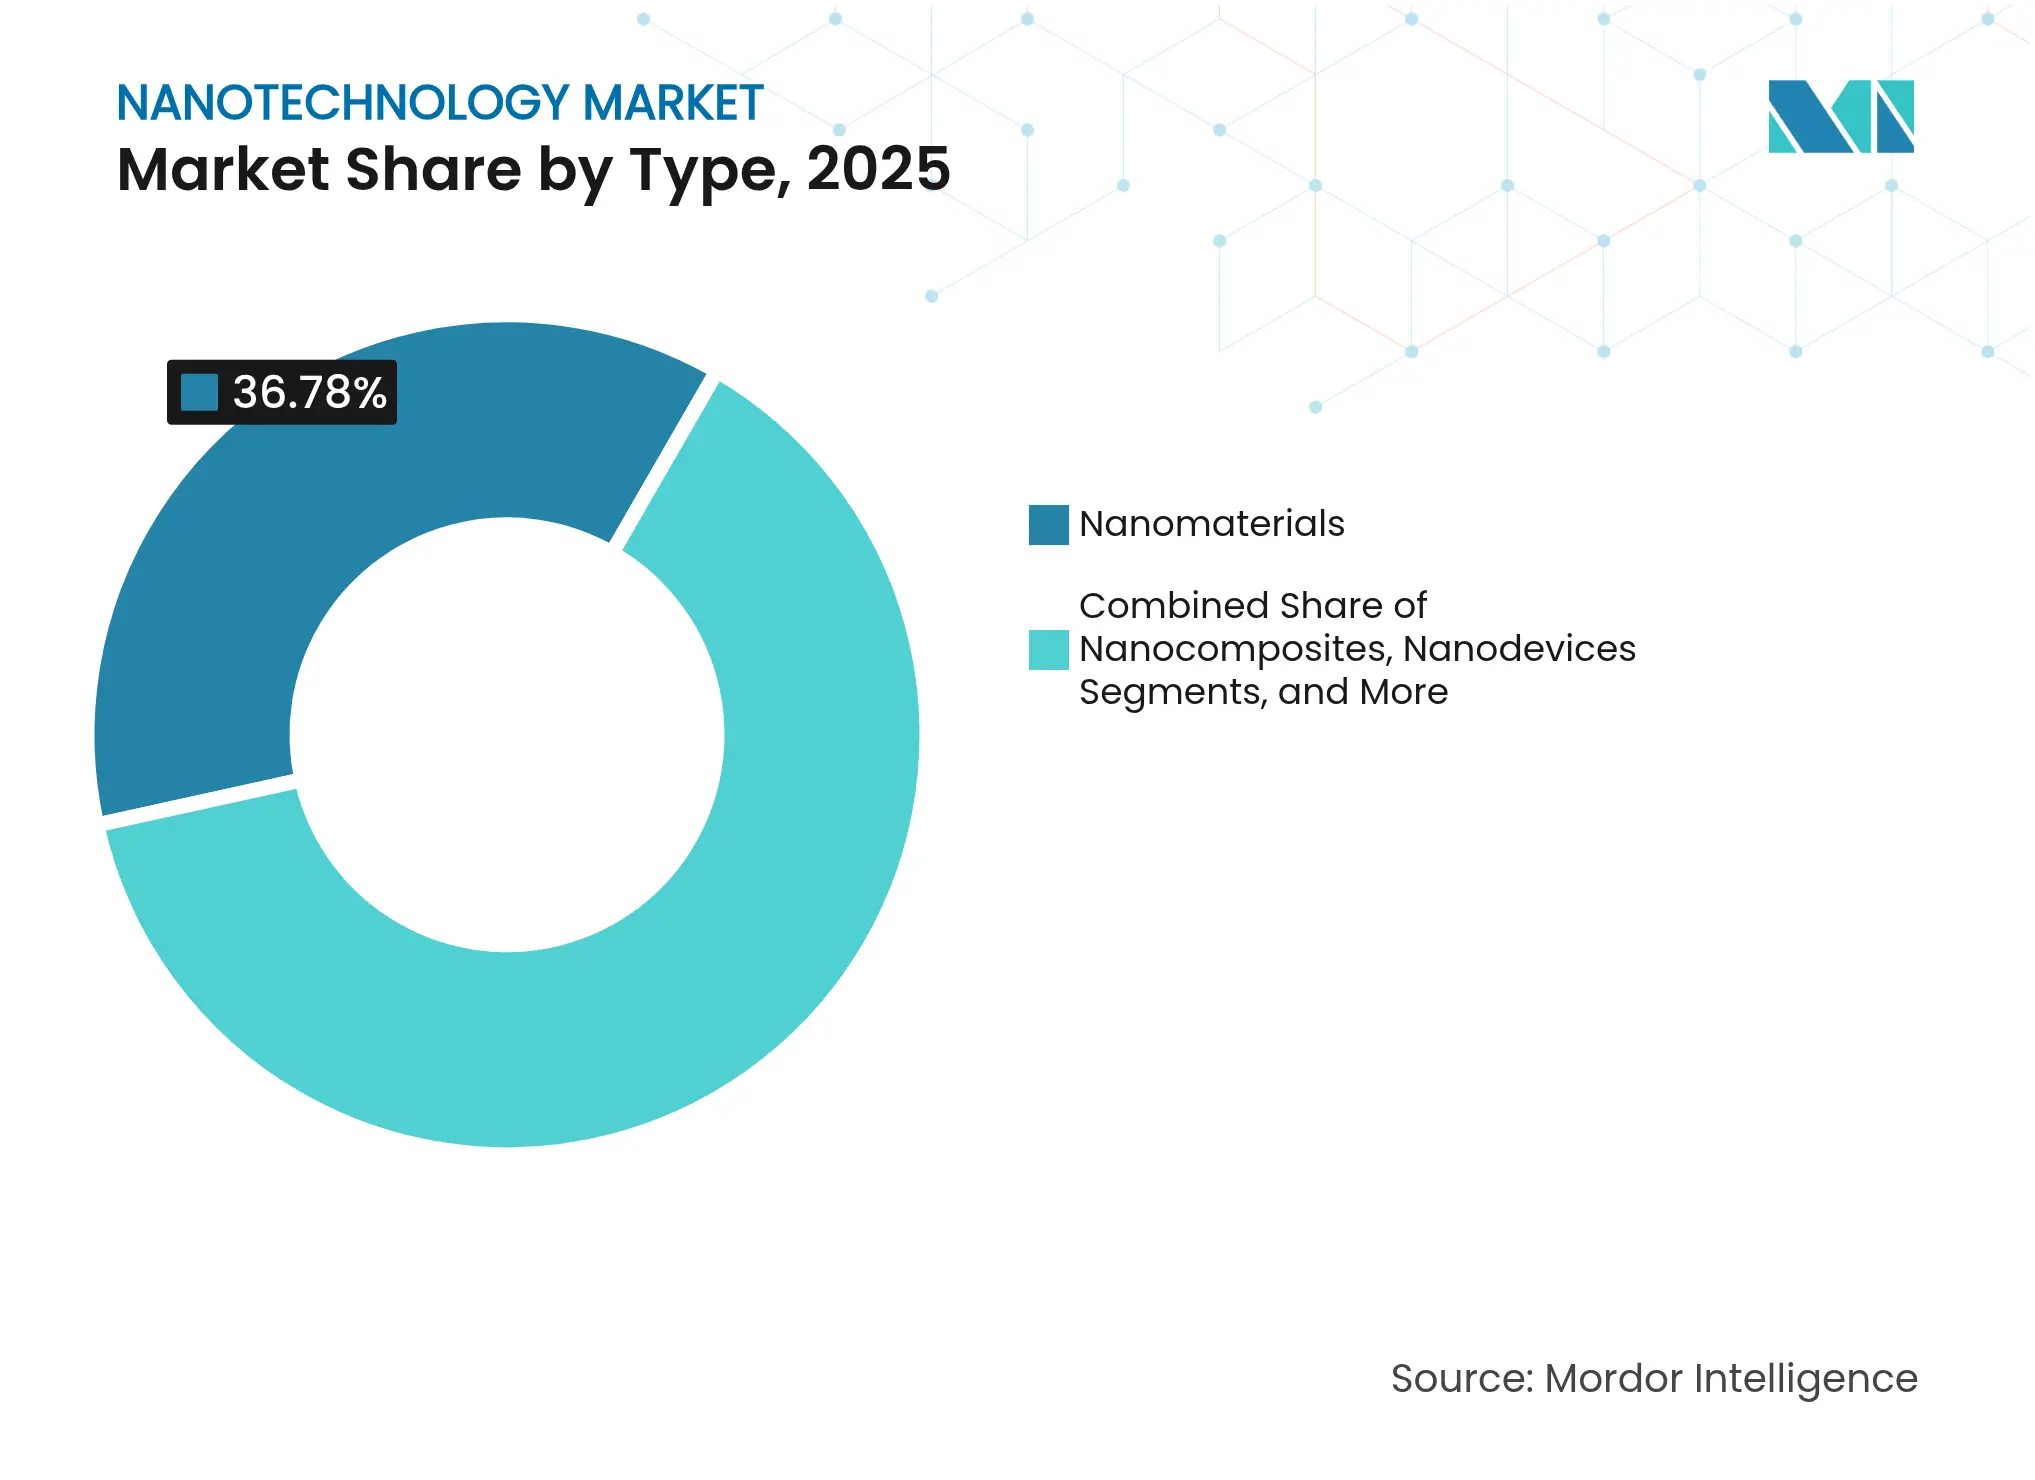
Nanodevices grew at 16.7% CAGR through 2031, outperforming nanomaterials, which held 36.78% revenue in 2025. Commercial roll-outs of nanosensors and quantum-dot devices validate the transition from materials to integrated functions, supporting premium pricing. The nanotechnology market size attributed to nanodevices is projected to climb steadily as smart diagnostic tools and display upgrades proliferate. Nanocomposites rank between the two, gaining from aerospace adoption of responsive systems, whereas nanotools stay niche but high-value.
The revenue mix reflects commoditization of bulk nanomaterials and differentiation of device-level offerings. Pre-clinical nanorobotics that shrink tumors by 70% signal wider health applications. Quantum-dot chips benefit from color-gamut gains and relatively low line-conversion costs. Cross-fertilization with artificial intelligence broadens addressable use cases into real-time analytics and autonomous platforms, entrenching nanodevices as the key value lever in the nanotechnology market.
Note: Segment shares of all individual segments available upon report purchase
By Manufacturing Process: Bottom-Up Approaches Retain Lead
Bottom-up synthesis maintained 59.85% share in 2025, sustained by CVD, sol-gel, and self-assembly methods suited to drug-delivery and catalyst applications. Top-down photolithography and ALD, however, register a brisk 15.1% CAGR alongside semiconductor road-maps toward 3 nm and 2 nm nodes. Consequently, the nanotechnology market share for bottom-up routes stays dominant in volume terms, while revenue growth tilts toward capital-intensive top-down fabs.
Process choice follows functional needs: pharma favors molecular-level precision from bottom-up chemistry, while chipmakers rely on tight tolerances from lithography. TSMC’s Arizona expansion showcases the capital scale: three fabs covering 4 nm to 2 nm nodes require USD 165 billion. Regional supply-chain depth in Asia-Pacific supports both paradigms, anchoring the nanotechnology market in the region.
By Material Category: Quantum Dots Surge Ahead
Carbon-based materials still hold 42.12% share in 2025, spanning graphene to CNTs. Yet quantum dots record an 18.1% CAGR as cadmium-free and perovskite variants solve toxicity and stability barriers. Regulatory headwinds stall metal-oxide adoption in Europe, but dendrimers remain a precision option in targeted drugs. The nanotechnology market size contribution from quantum dots will therefore widen, especially as display volumes unlock supply-chain scale.
Silicon quantum dots enter medical imaging, while graphene nanotubes ramp to 40 MT/y in Europe for battery electrodes. The bifurcation is clear: carbon structures satisfy structural roles; quantum dots address optical and electronic niches.

Recognized by Experts. Trusted by Leaders.
A trusted intelligence partner to global decision-makers across 90+ countries.


By Application: Energy Storage Outpaces Healthcare
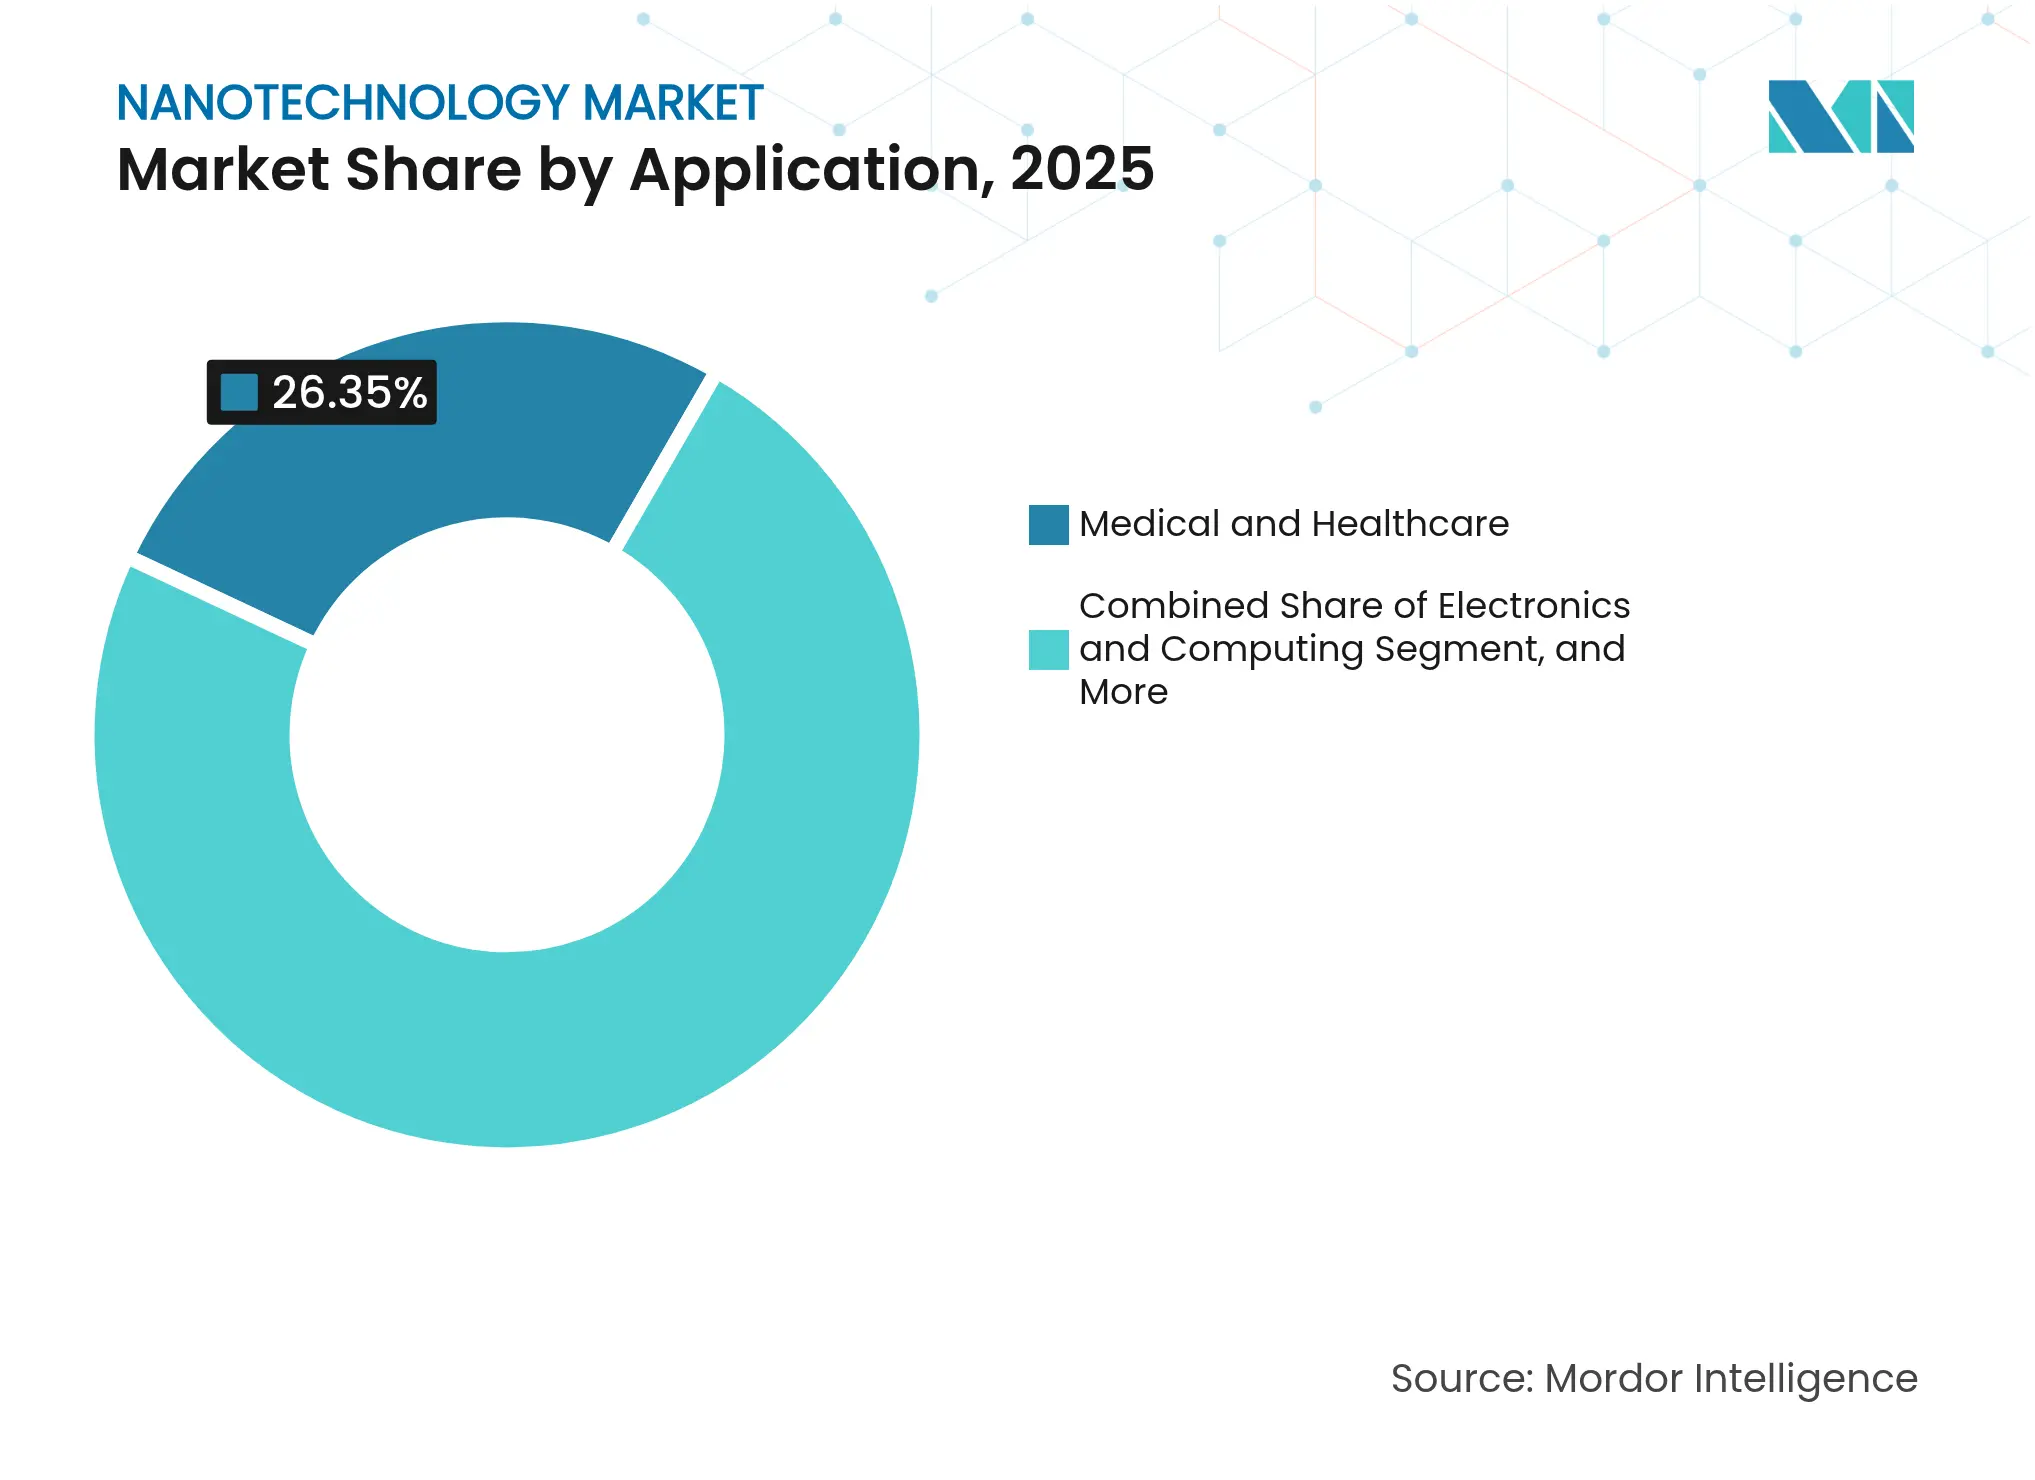
Healthcare kept a 26.35% slice of 2025 revenue, yet batteries and renewables now escalate at 15.6% CAGR. Silicon nanowire packs promise 10-fold capacity gains, shifting the demand mix. Electronics stay solid as logic IC scaling and quantum-dot backlighting mature. Environmental systems-water treatment, air filters-draw growth from regulatory pressure on pollution. Therefore, the nanotechnology market will see energy storage eclipse healthcare in incremental value over the forecast horizon.
Within healthcare, nanorobotics and theranostics open deeper value pools, though they face longer development cycles. Food and textiles remain early-stage but benefit from nano-encapsulation that lifts nutrient uptake and smart fabrics that sense biometrics.
Note: Segment shares of all individual segments available upon report purchase
By End-User Industry: Semiconductors Gain Speed
Pharmaceuticals claimed 36.05% share in 2025, yet semiconductor and display OEM demand races at 18.5% CAGR on quantum-dot migration and advanced packaging. The energy sector follows via battery and solar materials. Automotive and aerospace leverage nanocomposites for lightweighting. The nanotechnology market increasingly relies on electronics volumes, and policy impetus like the CHIPS Act cements that trend.
OEMs integrate vertically: BASF builds semiconductor-grade sulfuric acid lines, while display groups secure quantum-dot ink supply. Mature pharma applications pivot to personalized medicine, leveraging nanoparticle delivery and in-line diagnostics.
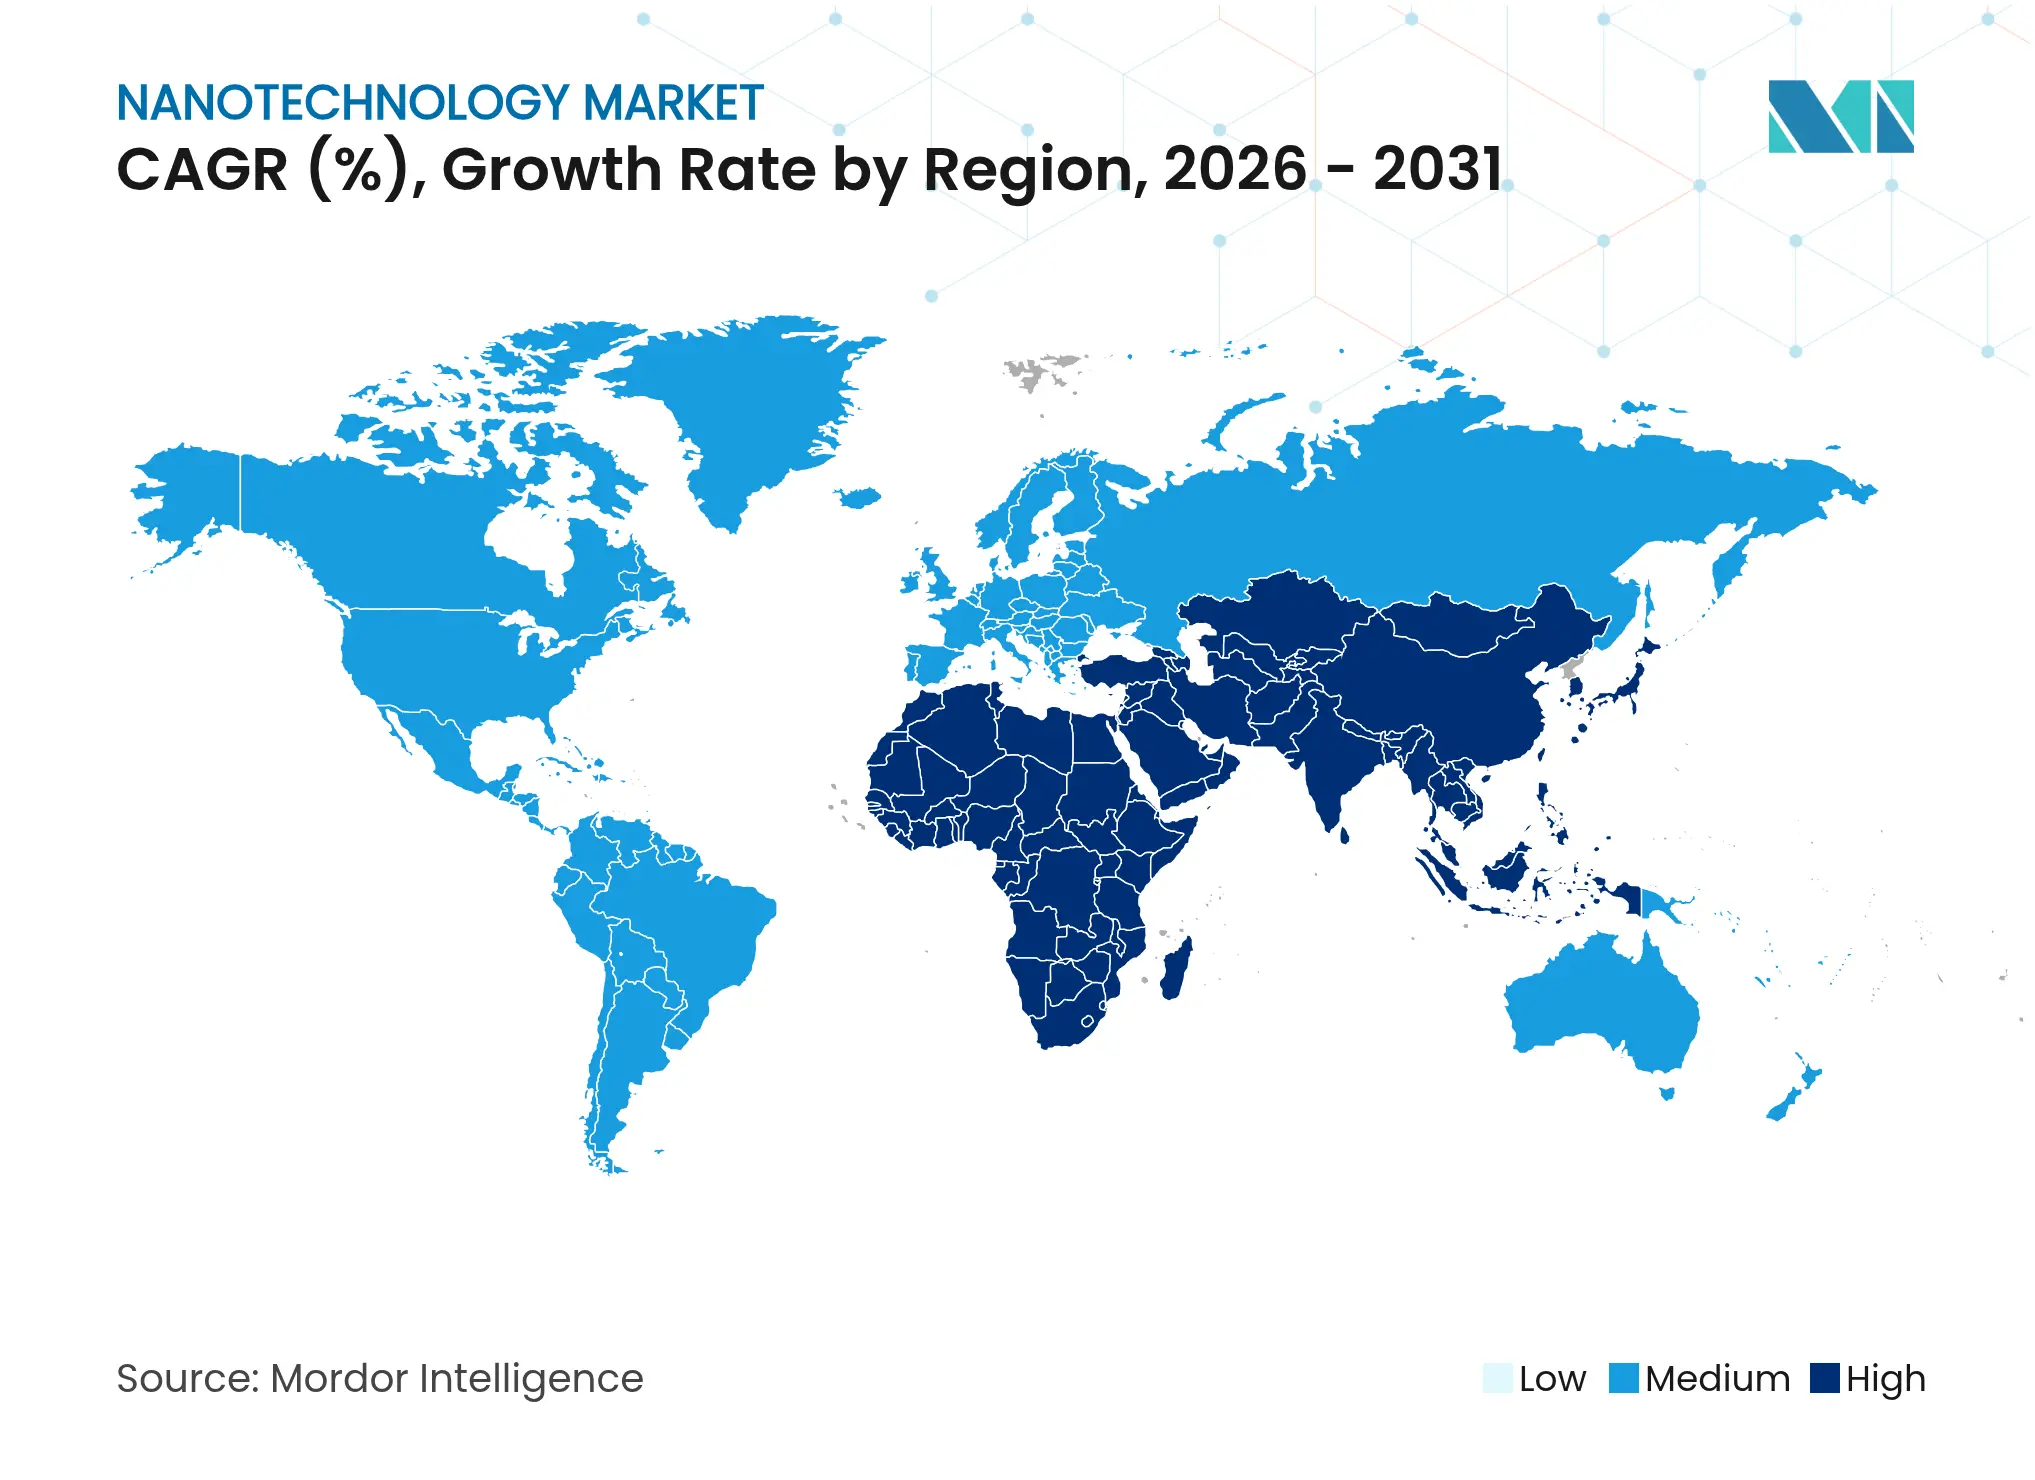
Asia-Pacific held 38.45% of market revenue in 2025, leveraging China’s rare-earth dominance and Japan’s quantum-dot prowess. Integrated supply chains from mine to fab give a cost edge, while South Korea and Taiwan add top-tier lithography. India rises as a pharma-nanotech hub, supplying global vaccine markets. The region’s nanotechnology market will keep its lead due to scale economies and domestic electronics demand.
North America benefits from CHIPS Act funding that restores nanosensor and packaging capacity. Research universities such as Stanford push silicon-nanowire batteries toward commercialization. Canada contributes quantum-dot research, and Mexico offers assembly footholds. Europe faces slower approvals under REACH, yet spearheads sustainable nanotech. Green Deal programs back nano-insulation, while German tool-makers export precision ALD gear. Consistent safety standards allow premium pricing for compliant suppliers.
The Middle East and Africa post the fastest CAGR at 13.8%, fueled by Vision 2030 initiatives and new research centers in Saudi Arabia and Egypt. Water scarcity and solar abundance drive uptake of nano-enabled desalination and PV solutions. South America remains nascent; Brazil leads agri-nanotech R&D and sees early wins in nano-fertilizer encapsulation. Regional growth hinges on infrastructure upgrades and technology transfer partnerships.
Market Concentration
The nanotechnology market remains fragmented. Chemical majors such as BASF and DuPont dominate bulk nanomaterials. Nanosys and Nanoco lead quantum-dot supply, while fab toolmakers like ASML lock in top-down lithography. No firm exceeds a double-digit global share, so rivalry centers on patent depth and application breadth. Recent patent analysis shows firms that align public promises with technical filings secure stronger positions.
Players seek vertical integration: Nano Dimension’s acquisitions of Desktop Metal and Markforged merge additive manufacturing with nano-ink expertise. Start-ups like Black Semiconductor raise USD 275 million to develop graphene chips for optical interconnects. White-space lies in theranostic systems, advanced nano-catalysts, and quantum-dot formulations for low-cost lighting.

*Disclaimer: Major Players sorted in no particular order
1. INTRODUCTION
2. RESEARCH METHODOLOGY
3. EXECUTIVE SUMMARY
4. MARKET LANDSCAPE
5. MARKET SIZE AND GROWTH FORECASTS (VALUES)
6. COMPETITIVE LANDSCAPE
7. MARKET OPPORTUNITIES AND FUTURE OUTLOOK
Nanotechnology encompasses the science and engineering disciplines focused on designing, producing, and utilizing structures, devices, and systems by manipulating atoms and molecules at the nanoscale—specifically, at 100 nanometers (100 millionths of a millimeter) or smaller dimensions. Nanotechnology has found its way into several domains, with industrial sectors leading the charge, especially information and communications.
The study comprehensively analyzes the trends and dynamics of nanotechnology adoption across different verticals. It also monitors the revenue generated from various types of nanotechnology utilized in several applications.
The nanotechnology market is segmented by type (nanomaterials, nanocomposites, nanodevices, and other types), application (medical and healthcare, material science, energy storage and production, environmental, electronics and computing, cosmetics and personal care products, food science, and textile), and geography (North America, Europe, Asia, Australia and New Zealand, Latin America, and Middle East and Africa). The report offers market forecasts and size in value (USD) for all the above segments.
Pricing Strategy for Semiconductor Components
3 Min Read
Accelerating Additive Manufacturing Adoption in India
3 Min Read
When decisions matter, industry leaders turn to our analysts. Let’s talk.