GPU Virtualization Market Size and Share
Market Overview
| Study Period | 2020 - 2031 |
|---|---|
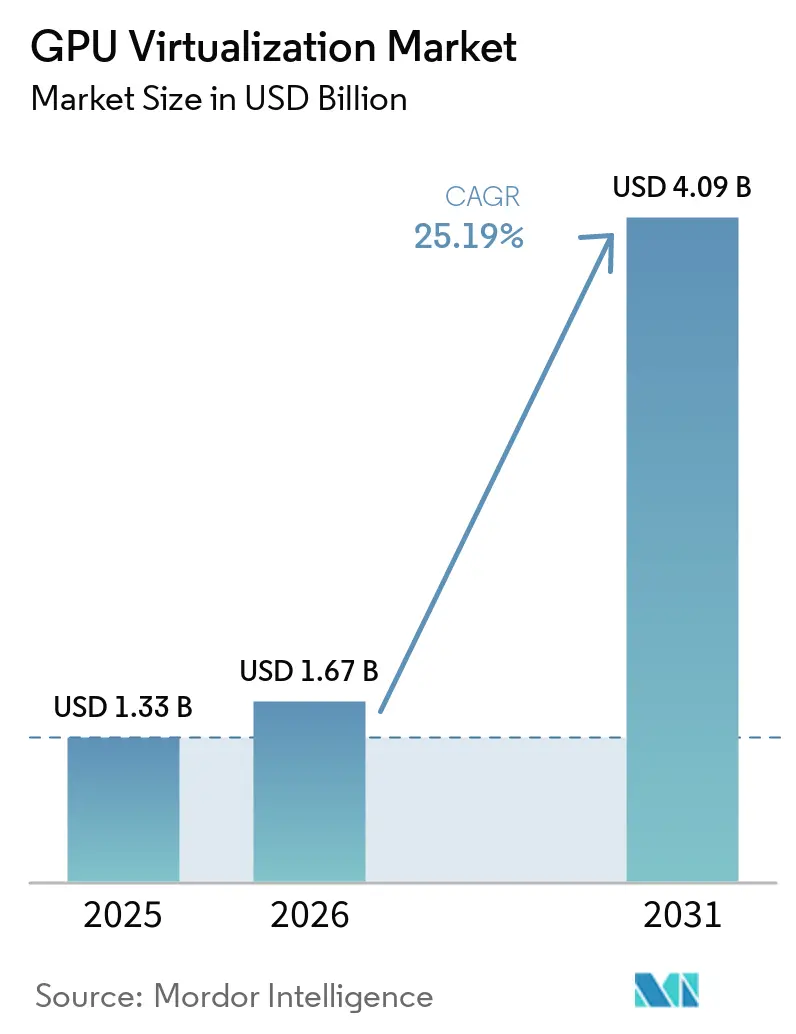
| Market Size (2026) | USD 1.67 Billion |
| Market Size (2031) | USD 4.09 Billion |
| Growth Rate (2026 - 2031) | 25.19% CAGR |
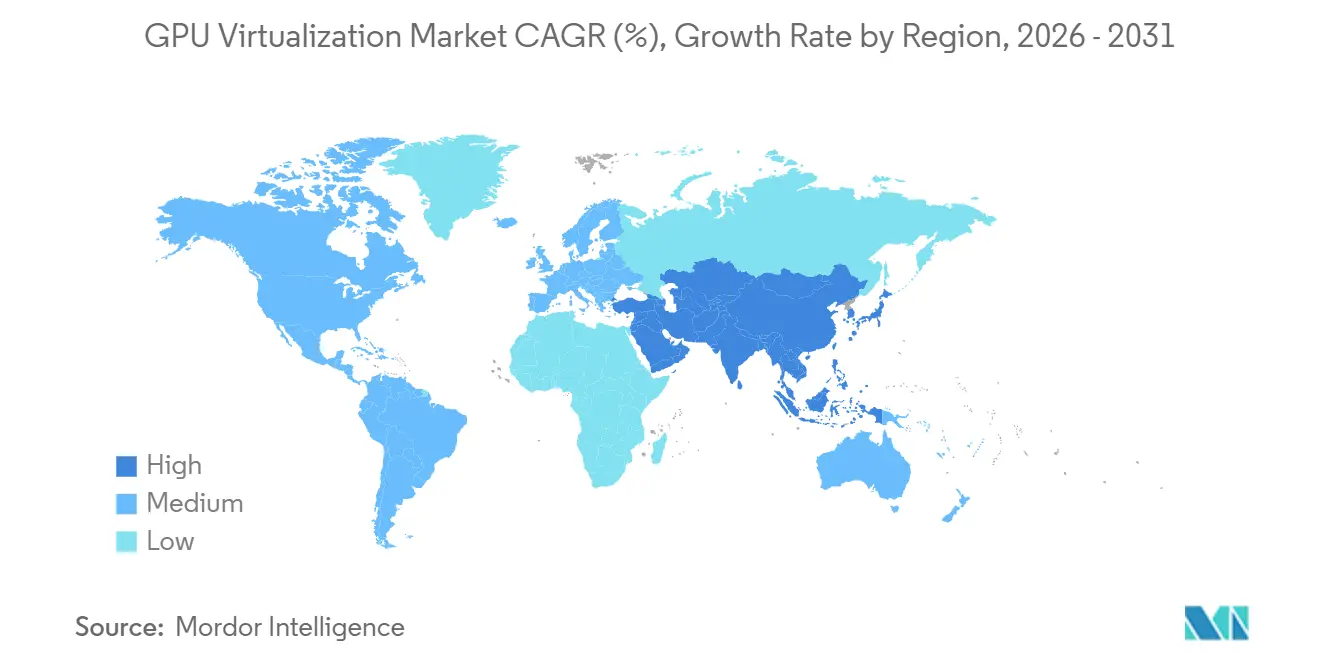
| Fastest Growing Market | Asia-Pacific |
| Largest Market | North America |
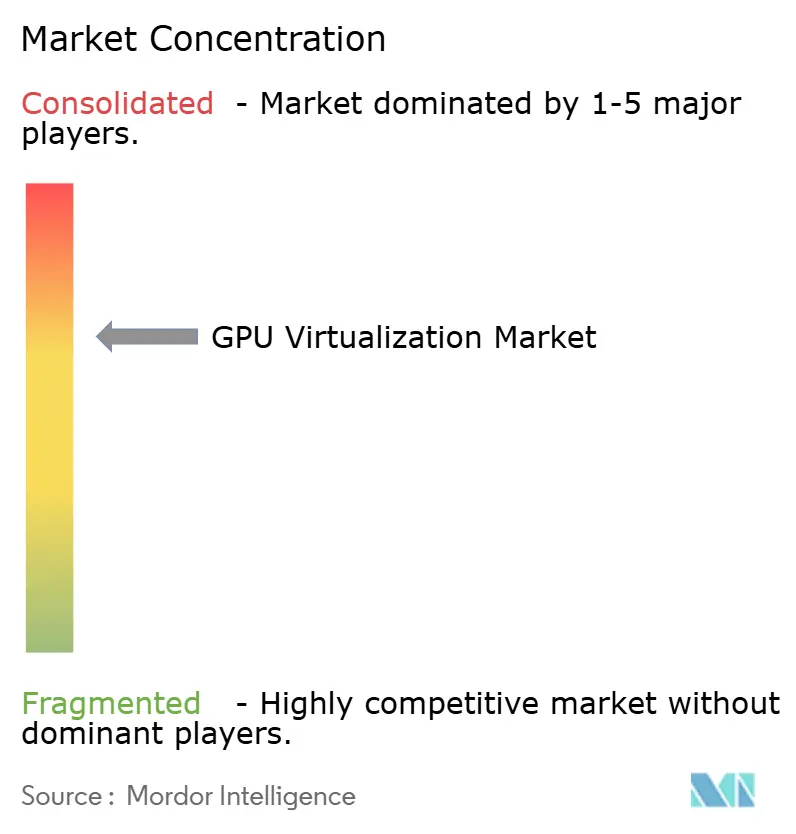
| Market Concentration | Medium |
Major Players *Disclaimer: Major Players sorted in no particular order Image © Mordor Intelligence. Reuse requires attribution under CC BY 4.0. | |
GPU Virtualization Market Analysis by Mordor Intelligence
The GPU virtualization market size is expected to increase from USD 1.33 billion in 2025 to USD 1.67 billion in 2026 and reach USD 4.09 billion by 2031, growing at a CAGR of 25.19% over 2026-2031. Enterprises are moving AI inference from dedicated servers to shared accelerator pools, turning export-control frictions into catalysts for virtualized time-slicing and hardware partitioning. Cloud providers rent fractional GPU slices in sub-hour units, a model that lowers entry costs for startups and requires robust isolation to meter usage precisely. Hardware-embedded partitioning such as Multi-Instance GPU is shifting profit pools from hypervisor vendors toward silicon suppliers, while sovereign-AI policies in Asia-Pacific are motivating parallel software stacks that increase switching costs. Europe’s energy-efficiency directive is accelerating data-center consolidation projects that replace single-purpose inference nodes with virtualized GPU clusters to improve utilization and reduce power-usage effectiveness.
Key Report Takeaways
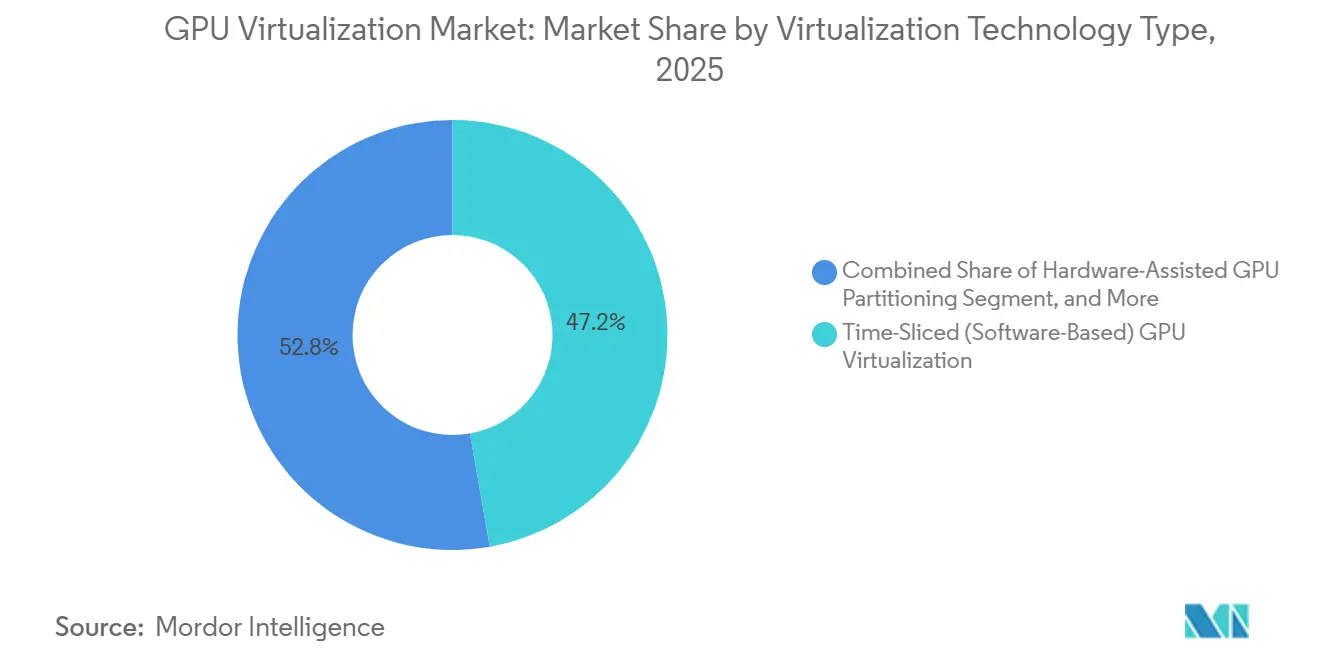
- By virtualization technology type, time-sliced software held 47.22% of the GPU virtualization market share in 2025, while hardware-assisted partitioning is advancing at the highest CAGR of 25.44% through 2031.
- By deployment model, public cloud captured 50.15% of 2025 revenue, yet hybrid and multi-cloud strategies record the fastest CAGR of 25.34% through 2031.
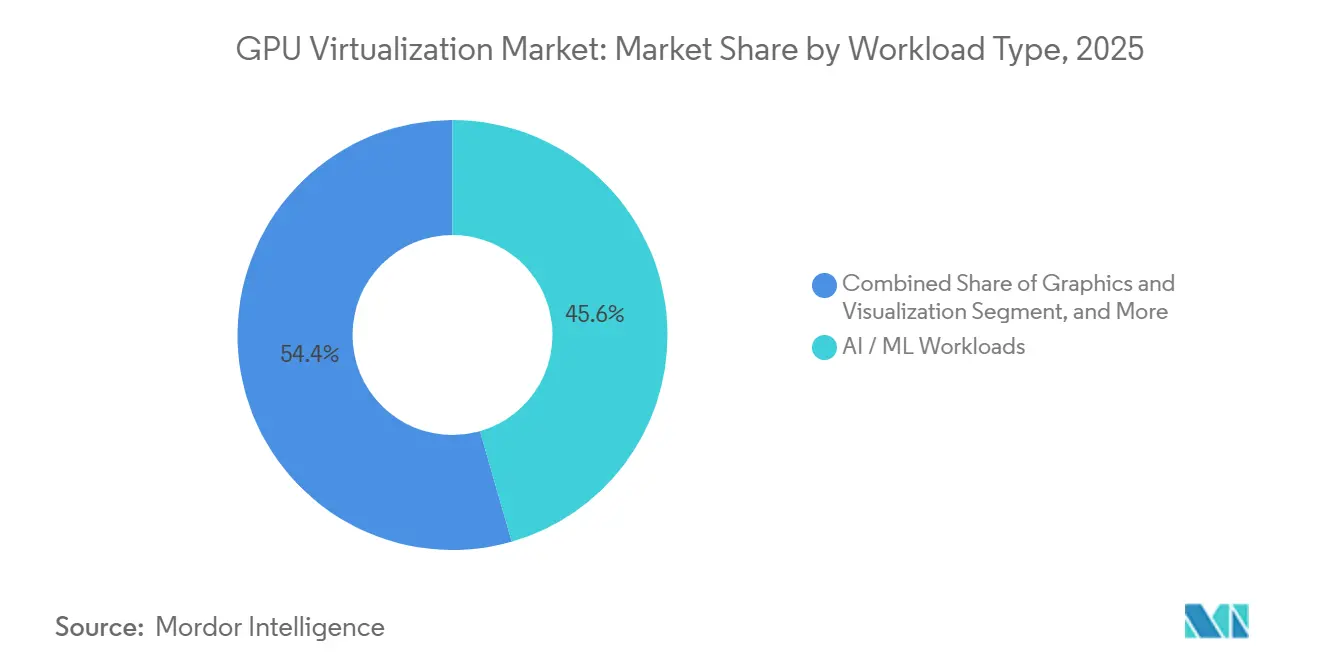
- By workload type, AI and ML workloads accounted for 45.56% of 2025 demand and remain the quickest-expanding with a CAGR of 26.11% use case to 2031.
- By end-user type, cloud service providers generated 43.45% of the 2025 value, but enterprises are posting the most rapid CAGR of 26.67% as internal AI factories scale.
- By geography, North America led with 46.67% of 2025 revenue, Asia-Pacific is projected to post the highest CAGR of 26.21% to 2031.
Note: Market size and forecast figures in this report are generated using Mordor Intelligence’s proprietary estimation framework, updated with the latest available data and insights as of January 2026.
Global GPU Virtualization Market Trends and Insights
Drivers Impact Analysis*
| Driver | (~) % Impact on CAGR Forecast | Geographic Relevance | Impact Timeline |
|---|---|---|---|
| Rising Adoption of AI Acceleration in Enterprise Workloads | +6.8% | Global, especially North America and Asia-Pacific | Medium term (2-4 years) |
| Surge in Cloud Gaming and Immersive Media Consumption | +4.2% | North America, Europe, South Korea, Japan | Short term (≤2 years) |
| Data-Center Refresh Cycles Toward GPU-Accelerated Hardware | +5.1% | Global, led by North America and Europe | Medium term (2-4 years) |
| Growing Demand for Secure Multi-Tenant GPU Sharing | +3.9% | Regulated industries in North America and Europe | Long term (≥4 years) |
| Energy-Efficiency Mandates Driving Consolidated GPU Resources | +3.4% | Europe, California, Singapore | Long term (≥4 years) |
| Edge Computing Rollouts Requiring Low-Latency GPU Pools | +2.8% | Asia-Pacific core, expanding to North America and Europe | Medium term (2-4 years) |
| Source: Mordor Intelligence | |||
Rising Adoption of AI Acceleration in Enterprise Workloads
Enterprises now embed generative-AI inference into customer-facing applications that require sub-50-millisecond responses. Time-sliced virtualization lets a single data-center GPU serve 8-16 concurrent inference streams, cutting per-query cost by nearly two-thirds. Financial institutions deploy virtualized RTX 6000 Ada cards for fraud detection, and hospitals run diagnostic models on shared accelerators without procuring dedicated systems.[1]NVIDIA Q4 FY2025 Earnings Call Transcript, investor.nvidia.com Lightweight stacks optimized for ARM-based edge GPUs extend these efficiencies outside the cloud, yet dependence on CUDA locks many organizations into NVIDIA’s roadmap despite price-performance gains from rival silicon.
Data-Center Refresh Cycles Toward GPU-Accelerated Hardware
Hyperscalers shorten refresh cycles to three years by replacing CPU-centric servers with GPU nodes that deliver 10-20× greater throughput on transformer models. New cloud instances sporting H200 and Blackwell GPUs arrive with terabytes of HBM3e and multi-terabit interconnects, configurations that only pay off when virtualization allocates fractional slices to smaller tenants. The practice creates a secondary market in which mid-tier providers acquire previous-generation accelerators and run virtualization platforms that squeeze fresh value from aging hardware.
Surge in Cloud Gaming and Immersive Media Consumption
Global cloud-gaming subscribers exceeded 50 million in 2025, and providers now offer RTX 5080-class performance through virtualized servers that flex capacity according to game complexity. Adoption of AV1 streaming cuts bandwidth by 30%, yet its heavier compute load pushes operators toward shared GPU pools that amortize encoding costs across dozens of streams. Industrial training apps use cloud-rendered AR where one data-center GPU drives 20-30 remote headsets, a setup impossible without low-latency virtualization.
Growing Demand for Secure Multi-Tenant GPU Sharing
Regulated sectors such as banking require cryptographic isolation that software scheduling alone cannot guarantee. New accelerators encrypt data in high-bandwidth memory and expose hardware trust boundaries so that multiple tenants share a die without risking data leakage. National security standards finalized in 2025 further mandate either physical separation or attestation of virtual slices, favoring hardware partitioning over pure time-slicing for sensitive workloads.
Restraints Impact Analysis*
| Restraint | (~)% Impact on CAGR Forecast | Geographic Relevance | Impact Timeline |
|---|---|---|---|
| High Total Cost of Ownership for GPU Hardware | -4.3% | Global, particularly small-to-medium enterprises | Short term (≤2 years) |
| Software Stack Fragmentation Across Hypervisors | -3.1% | Global, especially hybrid and multi-cloud environments | Medium term (2-4 years) |
| Limited Workload Portability Between Cloud Platforms | -2.6% | North America, Europe, Asia-Pacific | Medium term (2-4 years) |
| Supply-Chain Constraints for High-End GPUs | -2.2% | Global, with shortages in Asia-Pacific and Europe | Short term (≤2 years) |
| Source: Mordor Intelligence | |||
High Total Cost of Ownership for GPU Hardware
Flagship 8-GPU servers list at USD 250,000-300,000 and depreciate within three years, eroding ROI even before silicon failure. Annual license fees for virtualization add USD 1,000-2,000 per GPU independent of utilization, while electricity bills for a single rack run up to USD 15,000. Long supply-chain lead times force buyers to pre-pay a year ahead, an obstacle that mid-tier providers struggle to finance.
Software Stack Fragmentation Across Hypervisors
CUDA’s dominance leaves enterprises that adopt AMD or Intel accelerators facing recompilation overheads and incompatible device plugins. Mixed fleets cannot live-migrate workloads across heterogeneous pools, fragmenting resources and raising operational complexity. The resulting silos undermine multi-cloud strategies and dilute the utilization gains that the GPU virtualization market promises.
*Our forecasts treat driver/restraint impacts as directional, not additive. The impact forecasts reflect baseline growth, mix effects, and variable interactions.
Segment Analysis
By Virtualization Technology Type: Hardware Partitioning Meets Real-Time Demands
The Time-sliced software segment held 47.22% of the GPU virtualization market share in 2025, while hardware-assisted partitioning is advancing at the highest CAGR of 25.44% through 2031. Hardware-assisted partitioning now captures rising attention because deterministic latency matters for autonomous systems and medical imaging. The GPU (Graphics Processing Unit) virtualization market size for time-sliced software remained larger in 2025, yet hardware partitioning posts the strongest CAGR as enterprises accept the trade-off of fixed instance sizes in exchange for guaranteed response times. Meanwhile, API-level schemes stay niche due to protocol overhead that caps graphics frame rates.
Enterprises that run fraud detection and voice AI continue to favor time-slicing for batch inference where micro-jitters are tolerable. Still, confidential-computing features baked into next-generation silicon attach premiums of up to 50%, tilting investments toward hardware partitioning. Driver-level virtualization regains relevance at the edge where thin clients stream over 5G, an area likely to expand as telecom operators package GPUs with radio-access functions.


By Deployment Model: Hybrid Strategies Balance Cost and Sovereignty
The public cloud segment captured 50.15% of 2025 revenue, yet hybrid and multi-cloud strategies posted the fastest CAGR of 25.34% through 2031. Public-cloud Graphics Processing Units remain dominant thanks to pay-as-you-go pricing, but enterprises now calculate that workloads exceeding 2,000 hours yearly cost less on owned clusters. The Graphics Processing Unit virtualization market size attributed to hybrid deployments therefore expands fastest to 2031. Data-sovereignty mandates across Europe and Asia-Pacific push regulated AI training onto in-country infrastructure, encouraging hybrid topologies that burst into the cloud during spikes.
However, orchestration grows complex when schedulers juggle on-premise vSphere pools, AWS accounts, and spot capacity from brokers. Commercial bundles that unify management across these domains carry price premiums, nudging cost-sensitive users toward open-source stacks even as vendor-specific interconnects limit true portability. The emerging spot market favors organizations that architect for minimal lock-in.
By Workload Type: AI and ML Extend Their Lead
The AI and ML workloads segment accounted for 45.56% of 2025 demand and remains the quickest-expanding with a CAGR of 26.11% use case to 2031. Inference dominates production, and virtualization allows accelerators to batch thousands of queries each second, driving a growing share of Graphics Processing Unit cycles toward AI. Graphics rendering stabilizes in the mid-teens, while media encoding resurges because AV1 consumes triple the compute per frame. The Graphics Processing Unit virtualization market share for AI and ML is set to widen further as open-source small language models proliferate.
High-performance computing workloads migrate to specialized CPU-GPU hybrids, slimming their contribution. Media providers virtualize encoding across pools so that one H100 handles up to 50 concurrent 4K streams, underlining how diverse workloads coexist on the same silicon. Graphics tasks split between latency-sensitive real-time rendering and batch movie production, requiring virtualization platforms to balance low-jitter scheduling with high aggregate throughput.
By End-User Type: Enterprises Gain Ground on Cloud Providers
The Cloud Service Providers (CSPs) accounted for 43.45% of the 2025 value, but enterprises are posting the highest CAGR of 26.67% as internal AI factories scale. Cloud service providers launched the GPU virtualization market, yet enterprises are now catching up by building internal AI factories and edge inference nodes. The GPU virtualization market size generated by enterprises is expanding faster than any other end-user group, while research institutions rely on open-source stacks to stretch grant budgets. Telecom operators emerge as a fresh segment by pooling GPUs at cell towers to support AR and vehicle coordination.
Virtualization’s operational convenience outweighs its 15-20% performance tax for most inference tasks. Bundled software suites that include management tools and pre-trained models lower adoption barriers for companies without specialized GPU teams. Edge deployments introduce greenfield demand, but regulatory uncertainty around latency guarantees slows full-scale rollouts.
Geography Analysis
North America led the GPU virtualization market in 2025, accounting for 46.67% of value as hyperscalers deployed more than 500,000 GPUs. Export controls kept high-end accelerators domestic, inflating secondary-market prices and encouraging deeper virtualization to maximize every silicon hour. A mature enterprise-software ecosystem further stimulated adoption among finance and healthcare users that must isolate sensitive data.
Asia-Pacific is the fastest-growing region with a CAGR of 26.21% to 2031, thanks to sovereign-AI investments in China, India, and Japan. Domestic accelerators such as Ascend 910C have spurred alternative virtualization layers that fragment the software ecosystem. India’s USD 1.2 billion national AI infrastructure initiative funds shared GPU clusters accessible via virtual slices, while Japanese telcos deploy edge pools to serve latency-critical tourism apps. South Korea’s memory giants scale HBM3e output, strengthening regional supply resilience.
Europe’s energy-efficiency directive accelerates consolidation of GPU resources, pushing operators to virtualize dedicated inference servers into shared clusters and reduce power-usage effectiveness below 1.3. Germany’s sovereign-cloud rules and the United Kingdom’s AI Safety Institute both require on-premise or domestically owned infrastructure, making virtualization key to cost control. Markets in the Middle East, South America, and Africa remain small but grow at double-digit rates as regional providers launch localized GPU services under strict data-sovereignty statutes.[2]European Commission, “EU Energy Efficiency Directive 2023/1791,” ec.europa.eu

Competitive Landscape
NVIDIA holds a commanding 70-75% share of GPU shipments designed for virtualization, a position strengthened by its well-established CUDA developer ecosystem.[3]NVIDIA MIG Documentation, docs.nvidia.com Despite this dominance, the GPU virtualization market remains only moderately concentrated due to the competitive pressures introduced by cloud providers and emerging brokers. Silicon vendors are increasingly integrating partitioning capabilities directly into their chip designs, which compresses profit margins for independent hypervisors. At the same time, hyperscalers are developing proprietary schedulers that bypass third-party platforms, enabling them to capture value that was previously enjoyed by established players like VMware and Citrix.
In this evolving market, GPU-as-a-service brokers are leveraging opportunities by aggregating surplus GPU capacity from secondary markets. These brokers offer pricing that is up to 40% lower than hyperscalers, making their services particularly appealing to cost-sensitive AI startups looking to optimize their budgets. Confidential computing features have emerged as a key differentiator for leading chips, offering enhanced security and isolation. Regulators, recognizing the importance of hardware-enforced isolation, are willing to pay a premium for such features, which in turn raises the barriers to entry for new competitors.
The competitive landscape is further highlighted by an increase in patent filings, reflecting an intensifying R&D race aimed at reducing virtualization overheads. However, open-source orchestration solutions continue to face challenges, managing fewer than 20% of live deployments. This limited adoption is primarily due to the difficulties in standardizing across heterogeneous device plugins, which remain a significant obstacle to broader implementation.
GPU Virtualization Industry Leaders
NVIDIA Corporation
Advanced Micro Devices, Inc.
Intel Corporation
VMware, Inc.
Microsoft Corporation
- *Disclaimer: Major Players sorted in no particular order

Recent Industry Developments
- April 2026: NVIDIA launched the RTX PRO 6000 Blackwell Ada, a workstation GPU with 48 GB of GDDR6X and support for 48 virtual machines via Multi-Instance GPU, targeting AI-assisted design on shared hardware.
- March 2026: Google Cloud introduced A3 Mega instances powered by H200 GPUs, enabling cross-region scheduling while keeping latency under 10 milliseconds.
- January 2026: NVIDIA invested USD 2 billion in CoreWeave to build more than 5 GW of AI-optimized data-center capacity by 2030, securing long-term GPU allocation.
- December 2025: NVIDIA acquired Groq for USD 20 billion, adding ultra-low-latency LP30 processors to its portfolio.


Global GPU Virtualization Market Report Scope
The GPU Virtualization Market pertains to the industry segment dedicated to technologies and solutions that facilitate the sharing of a single Graphics Processing Unit's (GPU) processing power among multiple users, applications, or virtual machines.
The GPU Virtualization Market Report is Segmented by Virtualization Technology Type (Time-Sliced (Software-Based) GPU Virtualization, Hardware-Assisted GPU Partitioning, API / Driver-Level Virtualization), Deployment Model (On-Premise Data Centers, Public Cloud, and Hybrid / Multi-Cloud), Workload Type (AI / ML Workloads, Graphics and Visualization, High-Performance Computing (HPC), Media and Streaming), End-User Type (Enterprises, Cloud Service Providers (CSPs), Research and Academia, Telecom and Edge Operators), and Geography (North America, Europe, Asia-Pacific, Rest of World). The Market Forecasts are Provided in Terms of Value (USD).
| Time-Sliced (Software-Based) GPU Virtualization |
| Hardware-Assisted GPU Partitioning |
| API / Driver-Level Virtualization |
| On-Premise Data Centers |
| Public Cloud |
| Hybrid / Multi-Cloud |
| AI / ML Workloads |
| Graphics and Visualization |
| High-Performance Computing (HPC) |
| Media and Streaming |
| Enterprises |
| Cloud Service Providers (CSPs) |
| Research and Academia |
| Telecom and Edge Operators |
| North America | United States |
| Canada | |
| Mexico | |
| Europe | Germany |
| United Kingdom | |
| Rest of Europe | |
| Asia-Pacific | China |
| Japan | |
| South Korea | |
| India | |
| Rest of Asia-Pacific | |
| Rest of the World |
| By Virtualization Technology Type | Time-Sliced (Software-Based) GPU Virtualization | |
| Hardware-Assisted GPU Partitioning | ||
| API / Driver-Level Virtualization | ||
| By Deployment Model | On-Premise Data Centers | |
| Public Cloud | ||
| Hybrid / Multi-Cloud | ||
| By Workload Type | AI / ML Workloads | |
| Graphics and Visualization | ||
| High-Performance Computing (HPC) | ||
| Media and Streaming | ||
| By End-User Type | Enterprises | |
| Cloud Service Providers (CSPs) | ||
| Research and Academia | ||
| Telecom and Edge Operators | ||
| By Geography | North America | United States |
| Canada | ||
| Mexico | ||
| Europe | Germany | |
| United Kingdom | ||
| Rest of Europe | ||
| Asia-Pacific | China | |
| Japan | ||
| South Korea | ||
| India | ||
| Rest of Asia-Pacific | ||
| Rest of the World | ||


Key Questions Answered in the Report
What is the current GPU virtualization market size?
The GPU virtualization market was valued at USD 1.33 billion in 2025 and is projected to reach USD 4.09 billion by 2031.
Which deployment model is growing fastest?
Hybrid and multi-cloud configurations are expected to register the highest CAGR through 2031 as enterprises balance cost optimization, data sovereignty, and vendor diversification.
Why are enterprises adopting hardware partitioning?
Hardware-assisted partitioning delivers deterministic latency and confidential-computing isolation, which are critical for real-time inference, autonomous systems, and regulated industries.
How do energy regulations influence adoption in Europe?
Europe's mandate to reduce data-center energy consumption by 11.7% by 2030 is accelerating the consolidation of dedicated GPU servers into virtualized pools, improving utilization and reducing PUE below 1.3.
Who are the leading vendors in the GPU virtualization landscape?
NVIDIA dominates with approximately 70-75% market share, followed by AMD and emerging cloud GPU brokers such as CoreWeave and Lambda Labs that aggregate capacity for spot markets.
What role does GPU virtualization play at the network edge?
Telecom operators deploy virtualized GPU pools at cell towers to support AR and vehicle-coordination workloads with sub-10 ms latency, creating new revenue streams beyond traditional connectivity services.
Page last updated on:


