GPU Power Supply Unit (PSU) Market Size and Share
Market Overview
| Study Period | 2020 - 2031 |
|---|---|
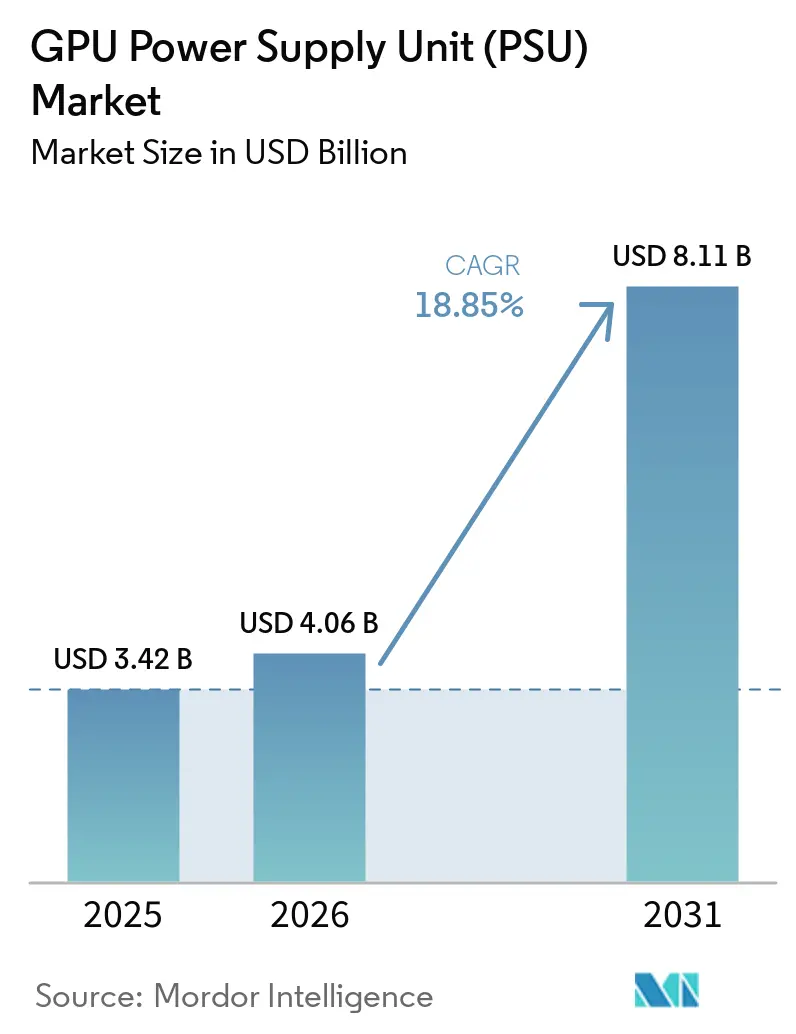
| Market Size (2026) | USD 4.06 Billion |
| Market Size (2031) | USD 8.11 Billion |
| Growth Rate (2026 - 2031) | 18.85% CAGR |
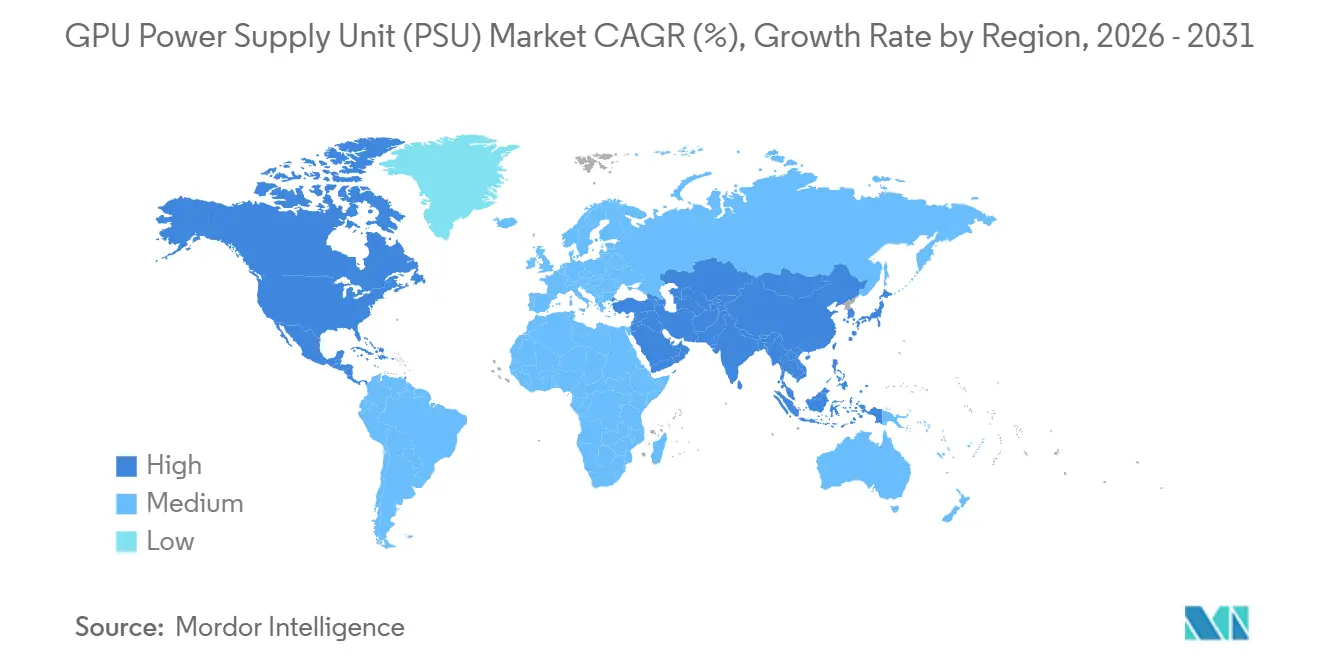
| Fastest Growing Market | Asia-Pacific |
| Largest Market | Middle East |
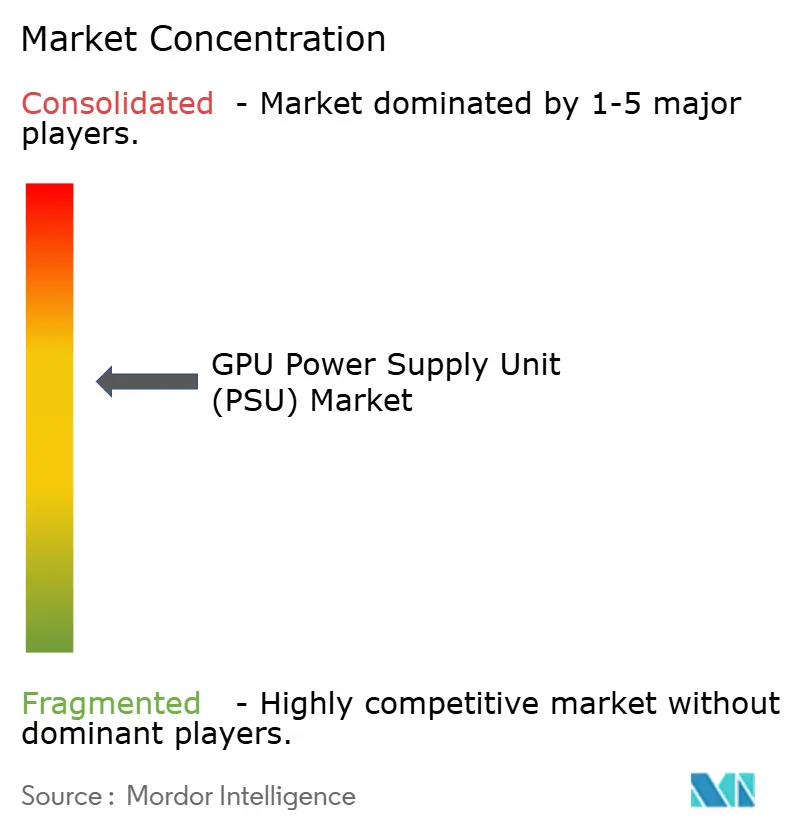
| Market Concentration | Medium |
Major Players *Disclaimer: Major Players sorted in no particular order Image © Mordor Intelligence. Reuse requires attribution under CC BY 4.0. | |
GPU Power Supply Unit (PSU) Market Analysis by Mordor Intelligence
The GPU power supply unit market size is expected to increase from USD 3.42 billion in 2025 to USD 4.06 billion in 2026 and reach USD 8.11 billion by 2031, growing at a CAGR of 18.85% over 2026-2031. Escalating rack-level power density in generative-AI data centers, utility-scale grid commitments that compress construction timelines, and the rapid move to liquid-cooled architectures are reshaping procurement cycles. Operators are abandoning 1-2 kilowatt common redundant power supply designs in favor of modular units that deliver 5-12 kilowatts while sustaining 97%-plus conversion efficiency. Output-power bifurcation is deepening, training clusters consume 4-5 kilowatts per server, yet inference systems draw 0.8-1.2 kilowatts, forcing vendors to maintain dual product lines optimized for divergent duty cycles. Supply-chain resilience around gallium nitride components, certification delays under 80 PLUS Titanium, and retrofit constraints in legacy facilities round out the competitive calculus.
Key Report Takeaways
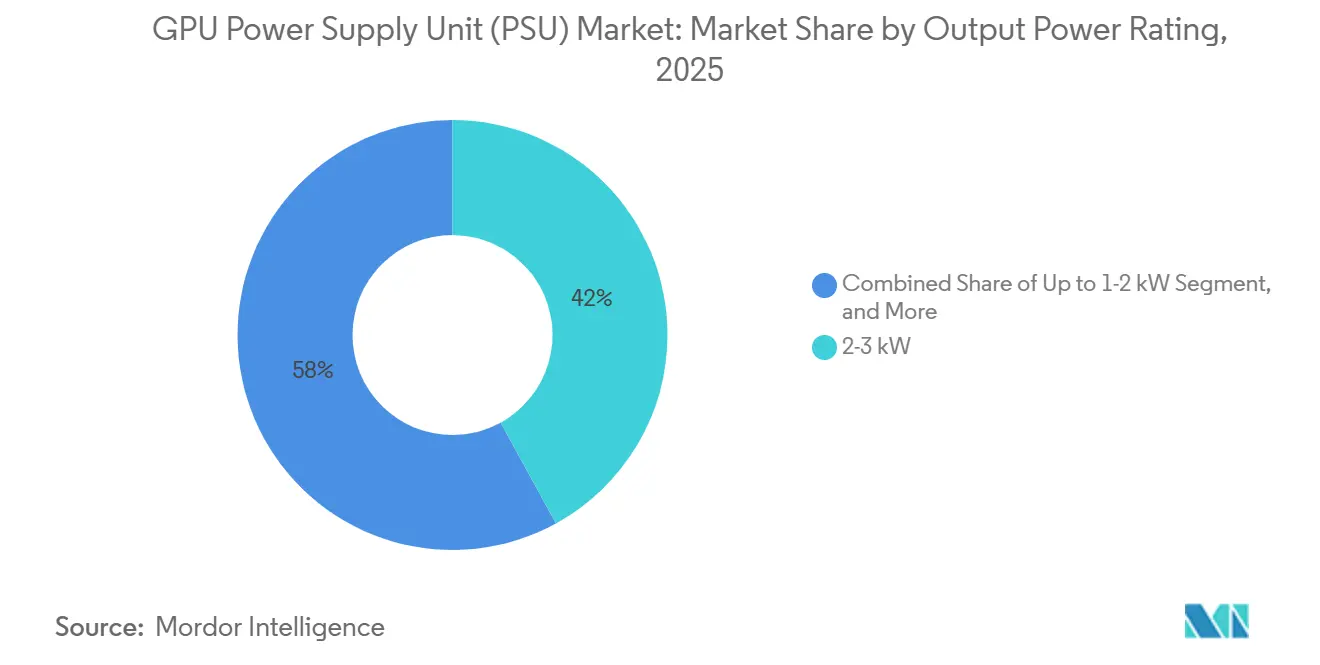
- By output power rating, the 2-3 kilowatt segment captured 42% of the GPU power supply unit market share in 2025, while units above 5 kilowatts are advancing at a 20.04% CAGR to 2031.
- By form factor, common redundant power supplies led with a 45% revenue share in 2025, whereas proprietary and hyperscaler-custom designs are projected to record a 19.46% CAGR through 2031.
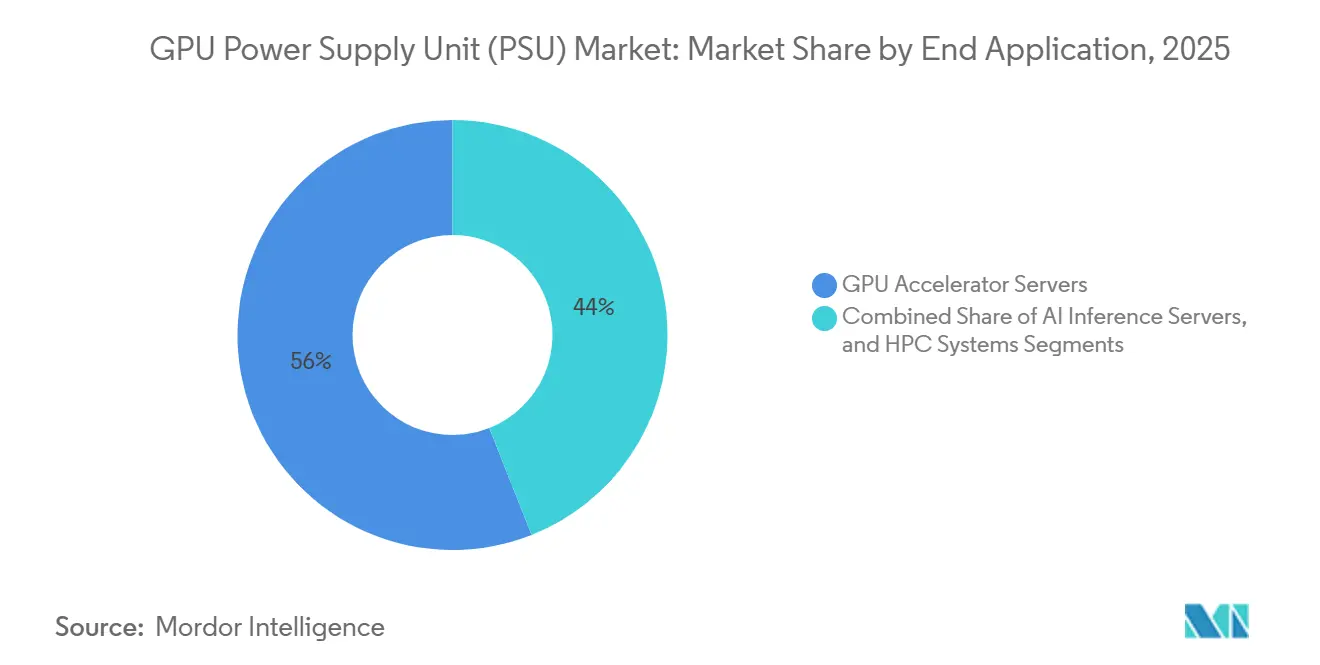
- By end application, GPU accelerator servers accounted for 56% of 2025 demand, and AI inference servers are forecast to expand at a 19.39% CAGR to 2031.
- By geography, Asia-Pacific commanded 63% of revenue in 2025, while North America is growing at a 19.96% CAGR through 2031.
Note: Market size and forecast figures in this report are generated using Mordor Intelligence’s proprietary estimation framework, updated with the latest available data and insights as of January 2026.
Global GPU Power Supply Unit (PSU) Market Trends and Insights
Drivers Impact Analysis*
| Driver | (~) % Impact on CAGR Forecast | Geographic Relevance | Impact Timeline |
|---|---|---|---|
| Surge in AI-Driven Data Centers | +4.2% | Global, concentration in North America and Asia-Pacific | Short term (≤ 2 years) |
| Rapid Adoption of GPU-Based High-Performance Computing | +3.8% | North America, Europe, Asia-Pacific | Medium term (2-4 years) |
| Growing Demand for Liquid-Cooled Rack Architectures | +3.1% | North America, Europe | Medium term (2-4 years) |
| Integration of Digital Twin-Enabled PSU Monitoring | +2.4% | North America, Europe, Asia-Pacific core | Medium term (2-4 years) |
| Increased Efficiency Mandates Under 80 PLUS Titanium | +2.0% | Global, regulatory emphasis in Europe and North America | Long term (≥ 4 years) |
| Expansion of Hyperscaler In-House PSU Design Capabilities | +1.9% | North America, spillover to Asia-Pacific manufacturing hubs | Short term (≤ 2 years) |
| Source: Mordor Intelligence | |||
Surge in AI-Driven Data Centers
Hyperscalers committed USD 103 billion in 2026 capital expenditures to support 4.5 gigawatts of contracted capacity and a further 9 gigawatts in pipeline projects, accelerating grid interconnection timelines from 36 months to 18 months.[1]Duke Energy, “Duke Energy Announces Major Expansion Plans to Meet Growing Energy Needs,” duke-energy.com NVIDIA GB200 NVL72 racks now draw 120-140 kilowatts per cabinet, compelling PSU vendors to move from 1-2 kilowatt designs to modular 5-10 kilowatt units that couple directly with liquid manifolds. Retrofit economics favor greenfield builds because upgrading a legacy 10-megawatt site to AI densities costs operators USD 3-4 million per facility, compared with USD 16 million for a new build that avoids thermal trade-offs. Vendors are staging inventory near hyperscaler construction clusters in Virginia, Texas, and Singapore to secure a first-mover advantage, and Delta Electronics disclosed that AI-related PSUs accounted for 50% of its server-PSU revenue in Q4 2025.
Rapid Adoption of GPU-Based High-Performance Computing
Enterprise HPC clusters are mirroring hyperscaler architectures as firms deploy on-premises inference servers to avoid cloud egress costs. Dell’s PowerEdge XE7745, launched in July 2025, integrates a 3,200-watt 80 PLUS Titanium PSU tailored for dual-GPU boards. Test-time compute scaling lifted per-query energy from 0.34 Wh to 4.32 Wh, forcing enterprises to double PSU capacity without increasing GPU count.[2]Scaling Test-Time Compute Team, “Scaling Test-Time Compute Optimally Can Be More Effective Than Scaling Model Parameters,” arxiv.org Flex Ltd backed the trend by adding 1.134 million ft² of capacity across Dallas, Colombia, and Poland in 2025, shortening lead times for custom orders. The convergence of cloud and enterprise specifications is compressing design cycles to 12 months, encouraging vendors to develop interoperable platforms that satisfy both Open Compute Project and proprietary racks.
Growing Demand for Liquid-Cooled Rack Architectures
Air-cooled PSUs top out near 5 kilowatts because heat flux beyond 200 W cm² drives MOSFET junctions above 85 °C, eroding reliability. Vertiv and CoolIT introduced cold-plate PSUs that deliver 10-12 kilowatts while keeping junction temperatures below 70 °C, doubling the mean time between failures to 100,000 hours. Lite-On Technology went further, unveiling 110-kilowatt liquid-cooled power shelves for Nvidia’s Vera Rubin Observatory in 2025. Hyperscalers now prefer integrated power-and-cooling shelves from a single vendor to simplify rack assembly and warranty scopes, creating white space for suppliers that master computational fluid-dynamics modeling alongside power electronics.
Integration of Digital Twin-Enabled PSU Monitoring
Fraunhofer ISIT’s thermal digital twin, released in 2025, predicts gallium nitride MOSFET degradation 72 hours before failure, enabling 5-year warranties. Hyperscalers quantify downtime risk at USD 100,000-500,000 per multi-hour outage, so predictive telemetry is migrating from optional feature to qualification prerequisite. Delta Electronics embedded the framework into its 800-V direct-current PSU line, commanding a 15-20% price premium. Procurement guidelines now mandate open APIs that plug PSU data into rack orchestration stacks, elevating software capability as a hard requirement when awarding design wins.
Restraints Impact Analysis*
| Restraint | (~) % Impact on CAGR Forecast | Geographic Relevance | Impact Timeline |
|---|---|---|---|
| Supply Chain Volatility in Gallium Nitride Components | -2.8% | Global, acute in North America and Europe | Short term (≤ 2 years) |
| Thermal Management Challenges Above 5 kW Output | -2.1% | Global, dense data-center markets | Medium term (2-4 years) |
| Limited Retrofit Viability in Legacy Server Racks | -1.6% | North America, Europe, mature Asia-Pacific | Medium term (2-4 years) |
| High Certification Costs for Redundant Topologies | -1.2% | Global, regulatory emphasis in Europe and North America | Long term (≥ 4 years) |
| Source: Mordor Intelligence | |||
Supply Chain Volatility in Gallium Nitride Components
China controls 98% of global gallium output, and 2024 export curbs doubled spot prices to USD 2,100 kg-¹, inflating BOM costs for high-power PSUs. Innoscience scaled wafer fabrication to 15,000 eight-inch units per month at 97% yields, locking in deals with Google but exposing non-Chinese vendors to sudden embargo risk. Western suppliers are co-funding gallium-nitride epi-lines in Europe and North America, but commercial scale remains two to three years away, maintaining price volatility through 2027.
Thermal Management Challenges Above 5 kW Output
Heat flux over 200 W cm² pushes gallium-nitride MOSFETs to 150 °C, trimming switching efficiency by 30% within 10,000 hours. Cold-plate integration adds USD 150-200 per PSU and extends design cycles to 18 months, restricting adoption to hyperscalers that can amortize the incremental cost across hundreds of racks. Navitas Semiconductor’s 12-kilowatt reference design achieves 97.8% efficiency but requires 48 V rack backplanes, which are incompatible with legacy 12 V infrastructure.
*Our forecasts treat driver/restraint impacts as directional, not additive. The impact forecasts reflect baseline growth, mix effects, and variable interactions.
Segment Analysis
By Output Power Rating: Gallium Nitride Enables Multi-Kilowatt Designs
The 2-3 kilowatt category accounted for 42% of GPU power supply unit market revenue in 2025, underscoring its fit with existing 208/240 V power distribution and air cooling. Units above 5 kilowatts, however, are forecast to grow at a 20.04% CAGR through 2031 as hyperscalers standardize on 48 V backplanes and liquid manifolds to handle higher thermal loads. Navitas Semiconductor’s 12-kilowatt blueprint validated 97.8% efficiency, establishing an aspirational ceiling for vendors still limited to 3.3-kilowatt silicon designs.[3]Navitas Semiconductor, “GaN Power ICs Enable 12 kW Server PSU,” navitassemi.com
Enterprises upgrading inference clusters gravitate toward 3-5 kilowatt PSUs because they align with dual-GPU servers like Dell’s PowerEdge XE7745. The GPU power supply unit market for the above-5-kilowatt tier is concentrated in North America, whereas Asia-Pacific data centers are retrofitting 2-3 kilowatt units to postpone capex. Certification costs under 80 PLUS Titanium, running USD 3,500-8,000 per SKU, delay launches in the highest-power bands, and disproportionately burden smaller vendors.


By Form Factor: Custom Designs Outpace CRPS
Common redundant power supply units (PSUs) maintained a significant 45% market share in 2025. This dominance is attributed to enterprise buyers' preference for vendor-agnostic spare parts, which offer flexibility and compatibility across various systems. However, proprietary and hyperscaler-specific PSU layouts are experiencing rapid growth, with a compound annual growth rate (CAGR) of 19.46%. Delta Electronics reported that customized boards accounted for 50% of its server-PSU revenue during the fourth quarter of 2025, highlighting the increasing demand for tailored solutions. Meanwhile, the GPU power supply unit market associated with Open Compute Project (OCP) specifications is witnessing a decline. This is due to the inability of OCP thermal envelopes to meet the rising demand for 120-140 kilowatt rack targets, which are becoming the industry standard.
Hyperscalers are now actively collaborating with manufacturers to co-design power shelves that incorporate advanced features such as digital twin telemetry, liquid-convergence plates, and 800-volt direct current inputs. These features are not present in standard common redundant power supplies (CRPS), making them a key differentiator in the market. For instance, Lite-On’s development of a 110-kilowatt power shelf for Nvidia exemplifies the level of customization that has become essential in meeting hyperscaler requirements. This trend underscores the need for vendors to adopt dual roadmaps. On one hand, they must continue to produce standardized units to cater to enterprise refresh cycles. On the other hand, they are required to develop bespoke stock-keeping units (SKUs) that are updated every 6-9 months to align with the frequent revisions and evolving demands of hyperscalers.
By End Application: Inference Servers Drive Distributed Demand
GPU accelerator servers accounted for 56% of 2025 shipments, maintaining their dominance in the market. However, inference appliances are experiencing faster growth, with a compound annual growth rate (CAGR) of 19.39%, as production workloads increasingly surpass training cycles. According to Microsoft Research, energy consumption per inference has increased twelvefold, driving the need for more frequent PSU refreshes. The GPU power supply unit market share associated with inference gear is concentrated around 2-3 kilowatts, which represents an optimal range that balances air cooling requirements with performance efficiency.
High-performance computing (HPC) allocations have reached a plateau as budgets are being redirected toward commercial AI applications. This shift has resulted in a reduction in incremental PSU orders from research laboratories. Meanwhile, edge deployments are driving greater diversity in volume requirements, creating opportunities for suppliers with extensive logistics capabilities rather than those focused solely on hyperscaler clients. FuriosaAI’s RNGD Server, launched in September 2025 with a 3-kilowatt chassis, exemplifies power envelopes optimized for inference workloads, highlighting the growing demand for such specialized solutions.
Geography Analysis
Asia-Pacific retained 63% revenue share in 2025, anchored by Taiwan’s vertically integrated supply chain, where Delta Electronics, Lite-On Technology, and FSP Group collectively exceed 40% global output. Delta’s Q4 2025 sales reached NTD 161.61 billion (USD 5.11 billion) with AI PSUs contributing 50% of server-power turnover. Innoscience’s gallium nitride wafer-scale production secures priority access to raw materials, enabling Taiwanese assemblers to quote shorter lead times than their Western peers. Yet margin pressure is mounting as hyperscalers move design work in-house, relegating OEMs to build-to-print roles.
North America is projected to grow at a compound annual growth rate (CAGR) of 19.96% due to significant investments and developments by hyperscalers. These companies currently have 35 gigawatts of capacity under construction and have entered into a 10.5-gigawatt clean-energy agreement with Brookfield, which will span from 2026 to 2030.[4]JLL, “Data Center Outlook 2026,” jll.com Additionally, Duke Energy has allocated USD 103 billion to grid upgrades to accommodate increasing energy demand driven by artificial intelligence (AI) applications. Flex Ltd expanded its U.S. operations in 2025 by adding 534,000 square feet of manufacturing space, addressing the growing preference for localized production to mitigate geopolitical risks and ensure supply chain resilience.
Europe and South America are experiencing slower growth than North America, primarily due to fewer hyperscale campuses and stricter environmental permitting regulations. However, Europe’s Ecodesign Directive is driving the adoption of 80 PLUS Titanium power supply units (PSUs), which are more energy-efficient and environmentally friendly. In contrast, the Middle East and Africa regions remain in the early stages of development, constrained by limited grid capacity and a heavy reliance on imported components. Despite these challenges, sovereign AI initiatives in countries like Saudi Arabia and the United Arab Emirates are fostering the establishment of first-wave data centers, signaling the beginning of growth in these regions.

Competitive Landscape
The GPU power supply unit market is moderately concentrated, with key players such as Delta Electronics, Lite-On Technology, Flex Ltd, Murata Manufacturing, and FSP Group collectively accounting for approximately 55% of the revenue in 2025. The market competition primarily revolves around advancements in gallium nitride efficiency and the integration of liquid-cooling technologies. Delta Electronics has positioned itself strongly with its 800 V direct-current platform, which achieves an impressive 97% efficiency and incorporates digital-twin telemetry, making it a preferred choice for premium hyperscaler applications. Flex Ltd, on the other hand, leverages its regional manufacturing facilities in Texas, South Carolina, and Poland to cater to clients seeking geopolitical diversification, albeit at a higher cost.
Emerging innovations in the market include bundled power-and-cooling shelves, 3-5 kilowatt liquid-cooled power supply units designed for enterprise upgrades, and partnerships with Western gallium nitride wafer manufacturers to reduce dependence on China. Innoscience, despite holding a modest share in the PSU assembly market, has gained significant leverage through its upstream wafer capacity, demonstrating how vertical semiconductor integration can challenge established market leaders. These developments highlight the dynamic nature of the market, where technological advancements and strategic partnerships are reshaping competitive dynamics.
Certification under standards such as 80 PLUS Titanium or UL continues to serve as a significant barrier to entry for new players. The associated program fees and the lengthy testing periods, which typically span 12-16 weeks, create structural challenges for potential entrants. This certification process not only ensures product quality and efficiency but also reinforces the dominance of established players who have already navigated these hurdles. As a result, the market remains competitive yet challenging for new participants, with innovation and compliance playing critical roles in determining success.
GPU Power Supply Unit (PSU) Industry Leaders
Delta Electronics Inc.
Lite-On Technology Corporation
Flex Ltd.
Murata Manufacturing Co. Ltd.
AcBel Polytech Inc.
- *Disclaimer: Major Players sorted in no particular order

Recent Industry Developments
- April 2026: FSP Group unveiled its MEGA GM MIT series in 850 W, 1,000 W, and 1,200 W SKUs with 80 PLUS Platinum certification and modular cables aimed at enterprise inference clusters.
- April 2026: ASUS released the TUF Gaming Platinum PSU line in 850 W-1,200 W models, featuring gallium-nitride MOSFETs to achieve 94% efficiency at 50% load.
- April 2026: CE-LINK introduced the AI-Hybrid Titanium PSU that toggles between air and liquid modes to manage 3-5 kilowatt loads.
- February 2026: Duke Energy allocated USD 103 billion to 4.5 gigawatts of committed capacity and a 9-gigawatt pipeline, thereby shrinking interconnection lead times.


Global GPU Power Supply Unit (PSU) Market Report Scope
The GPU Power Supply Unit (PSU) market refers to the global industry focused on the design, manufacturing, and deployment of specialized power supply systems that deliver stable, high-efficiency electrical power to GPU-intensive computing environments. These PSUs are engineered to meet the demanding performance, scalability, and energy efficiency requirements of modern workloads such as artificial intelligence (AI), machine learning (ML), high-performance computing (HPC), and large-scale data processing.
The GPU Power Supply Unit Report is Segmented by Output Power Rating (Up to 1 kW, 1-2 kW, 2-3 kW, 3-5 kW, and Above 5 kW), Form Factor (CRPS, OCP PSUs, and Proprietary and Hyperscaler Custom Designs), End Application (GPU Accelerator Servers, AI Inference Servers, and HPC Systems), and Geography (North America, South America, Europe, Asia-Pacific, and Rest of the World). Market Forecasts are Provided in Value (USD).
| Up to 1 kW |
| 1-2 kW |
| 2-3 kW |
| 3-5 kW |
| Above 5 kW |
| Common Redundant Power Supply (CRPS) |
| Open Compute Project (OCP) PSUs |
| Proprietary and Hyperscaler Custom Designs |
| GPU Accelerator Servers |
| AI Inference Servers |
| HPC Systems |
| North America | United States |
| Canada | |
| Mexico | |
| South America | Brazil |
| Argentina | |
| Rest of South America | |
| Europe | United Kingdom |
| Germany | |
| Rest of Europe | |
| Asia-Pacific | China |
| Japan | |
| India | |
| South Korea | |
| Rest of Asia-Pacific | |
| Rest of the World |
| By Output Power Rating | Up to 1 kW | |
| 1-2 kW | ||
| 2-3 kW | ||
| 3-5 kW | ||
| Above 5 kW | ||
| By Form Factor | Common Redundant Power Supply (CRPS) | |
| Open Compute Project (OCP) PSUs | ||
| Proprietary and Hyperscaler Custom Designs | ||
| By End Application | GPU Accelerator Servers | |
| AI Inference Servers | ||
| HPC Systems | ||
| By Geography | North America | United States |
| Canada | ||
| Mexico | ||
| South America | Brazil | |
| Argentina | ||
| Rest of South America | ||
| Europe | United Kingdom | |
| Germany | ||
| Rest of Europe | ||
| Asia-Pacific | China | |
| Japan | ||
| India | ||
| South Korea | ||
| Rest of Asia-Pacific | ||
| Rest of the World | ||


Key Questions Answered in the Report
What is the current GPU power supply unit market size and projected growth to 2031?
The GPU power supply unit market size is expected to rise from USD 4.06 billion in 2026 to USD 8.11 billion by 2031, reflecting an 18.85% CAGR.
Which output power segment leads revenue today?
PSUs rated 2-3 kilowatts commanded 42% of 2025 revenue, benefiting from compatibility with existing rack power distribution.
Which region is growing fastest through 2031?
North America shows the highest growth momentum at a 19.96% CAGR, pushed by more than 35 gigawatts of hyperscale capacity under construction.
Why are liquid-cooled PSUs gaining share?
Heat flux over 5 kilowatts per unit exceeds air-cooling limits, making cold-plate designs necessary to keep junction temperatures below reliability thresholds.
How are hyperscalers influencing PSU design?
Companies like Microsoft and Google now co-develop custom power shelves that integrate telemetry, liquid cooling, and 800 V direct-current inputs, reducing reliance on standardized CRPS units.
What is the main supply-chain risk for high-power PSUs?
Dependence on gallium nitride wafers sourced primarily from China exposes vendors to price spikes and export restrictions, which can add 2-3 percentage-points risk to forecast CAGR.
Page last updated on:


