AI In Medical Imaging Market Size and Share
Market Overview
| Study Period | 2020 - 2031 |
|---|---|
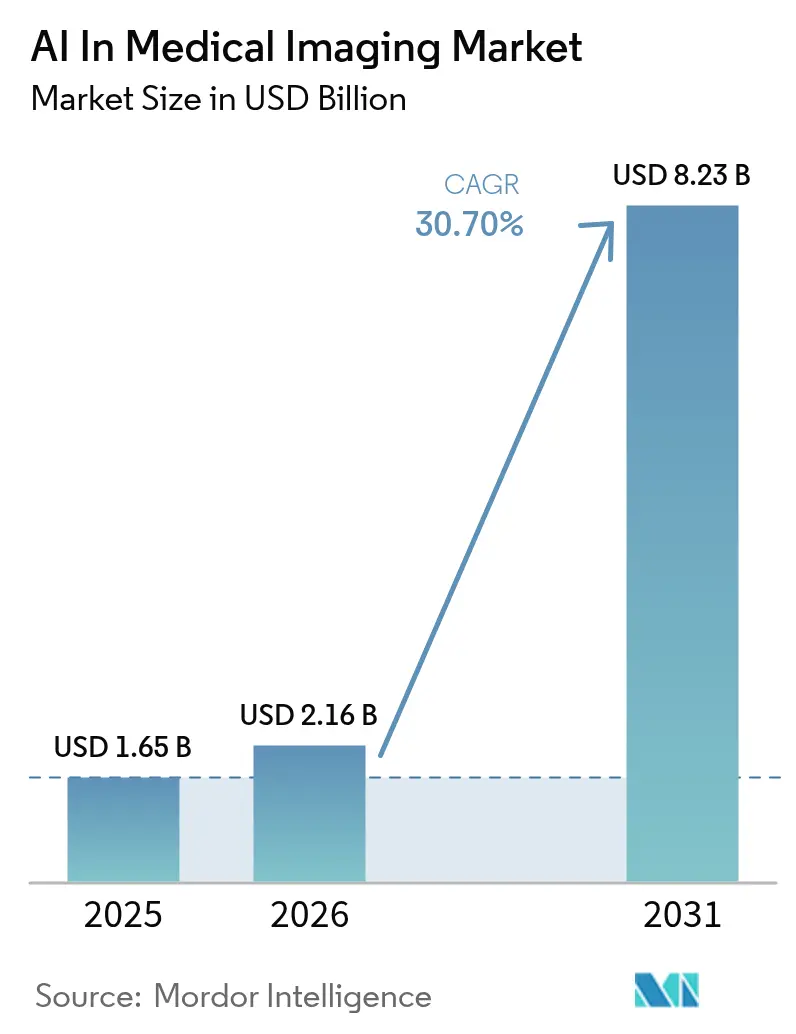
| Market Size (2026) | USD 2.16 Billion |
| Market Size (2031) | USD 8.23 Billion |
| Growth Rate (2026 - 2031) | 30.70% CAGR |
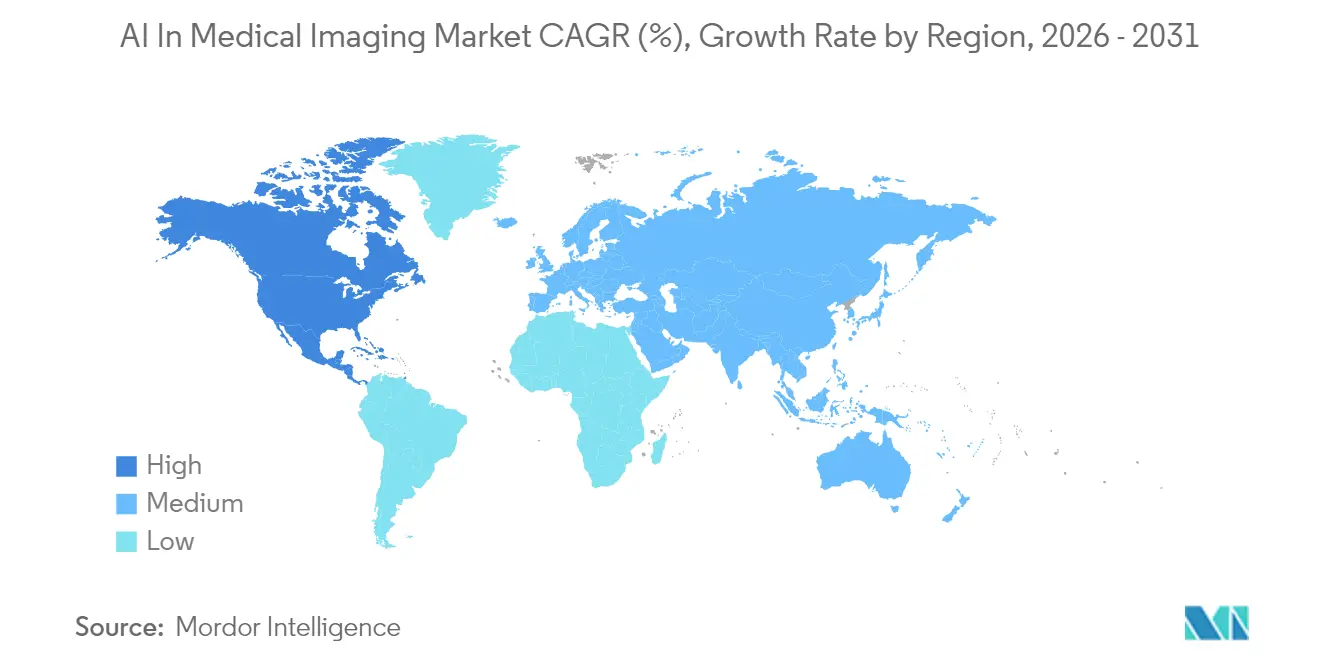
| Fastest Growing Market | Asia Pacific |
| Largest Market | North America |
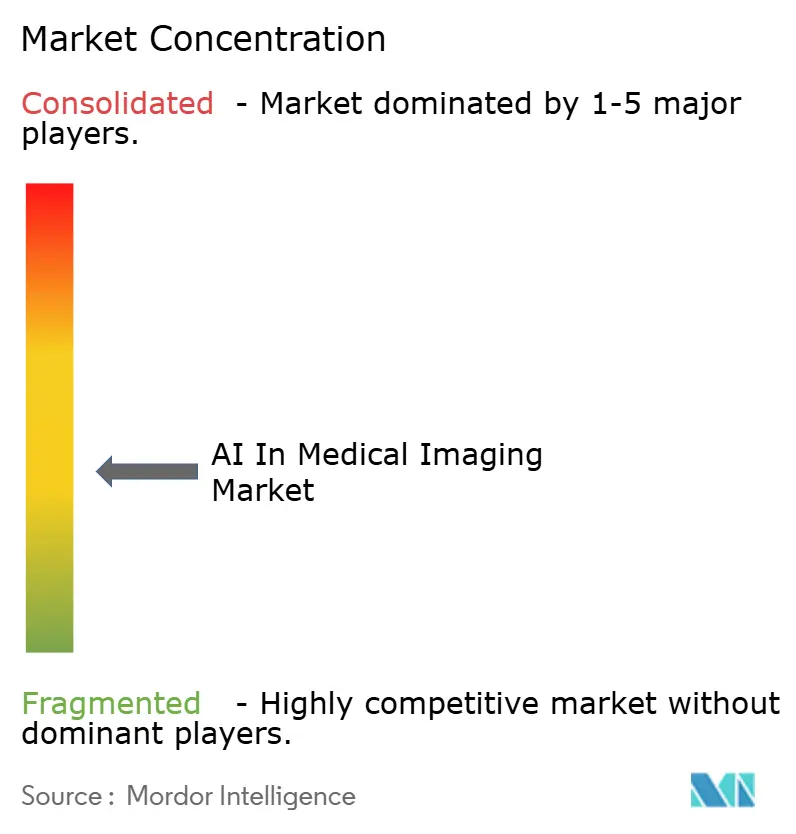
| Market Concentration | Medium |
Major Players *Disclaimer: Major Players sorted in no particular order Image © Mordor Intelligence. Reuse requires attribution under CC BY 4.0. | |
AI In Medical Imaging Market Analysis by Mordor Intelligence
The AI In Medical Imaging Market size market is expected to grow from USD 1.65 billion in 2025 to USD 2.16 billion in 2026 and is forecast to reach USD 8.23 billion by 2031 at 30.7% CAGR over 2026-2031.
This jump underscores a shift from pilot projects to routine use across radiology, oncology and emergency care. Faster FDA clearances, cloud-hosted imaging archives and pay-for-performance incentives are shortening purchasing cycles. Multi-vendor interoperability standards now let algorithms plug into existing Picture Archiving and Communication Systems (PACS), reducing integration costs. Providers also see AI as a practical response to rising scan volumes and the widening radiologist shortfall, which is forecast to reach 19,500 in the United States by 2034. Asia’s cancer-screening mandates, Europe’s cross-border image-sharing rules and national AI grants in the United States and United Kingdom are creating fresh demand pockets that vendors are racing to serve.
Key Report Takeaways
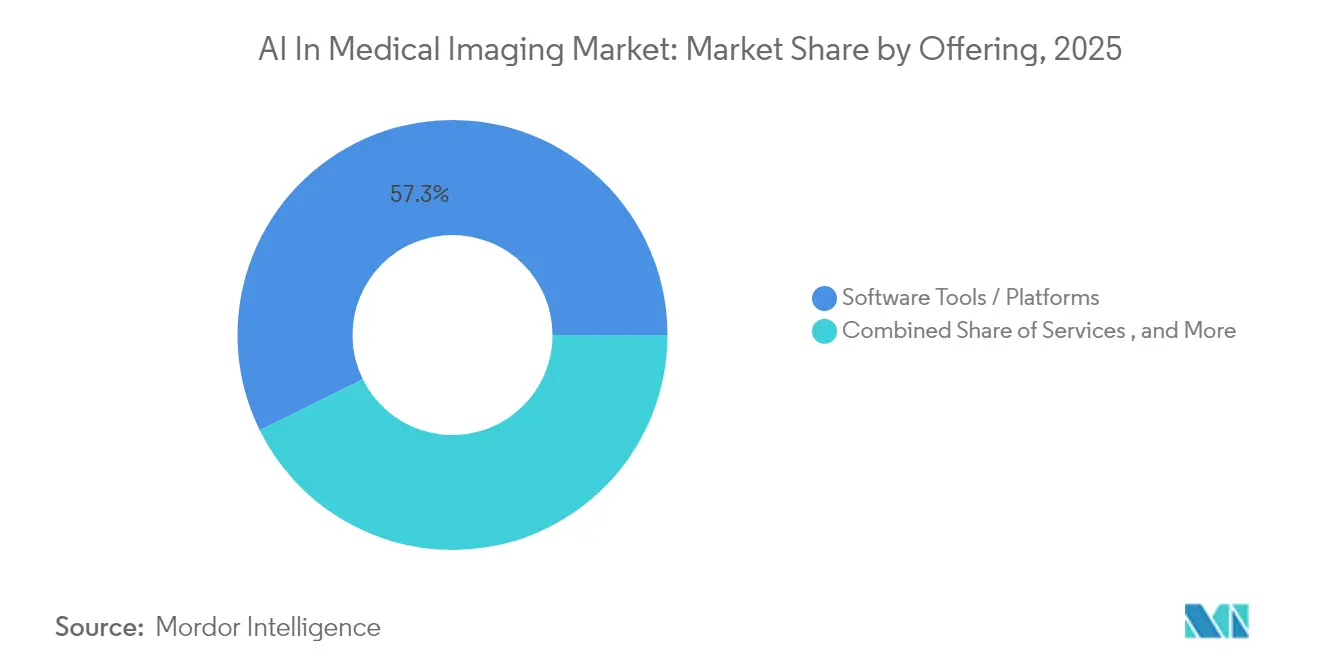
- By offering, software platforms led with 57.30% of the AI in medical imaging market share in 2025, while services are projected to expand at a 31.4% CAGR through 2031.
- By imaging modality, CT contributed 27.60% revenue share in 2025, whereas ultrasound is forecast to grow at 31.0% CAGR to 2031.
- By application, oncology accounted for 30.40% of the AI in medical imaging market size in 2025, and pulmonology is advancing at a 33.5% CAGR over 2026-2031.
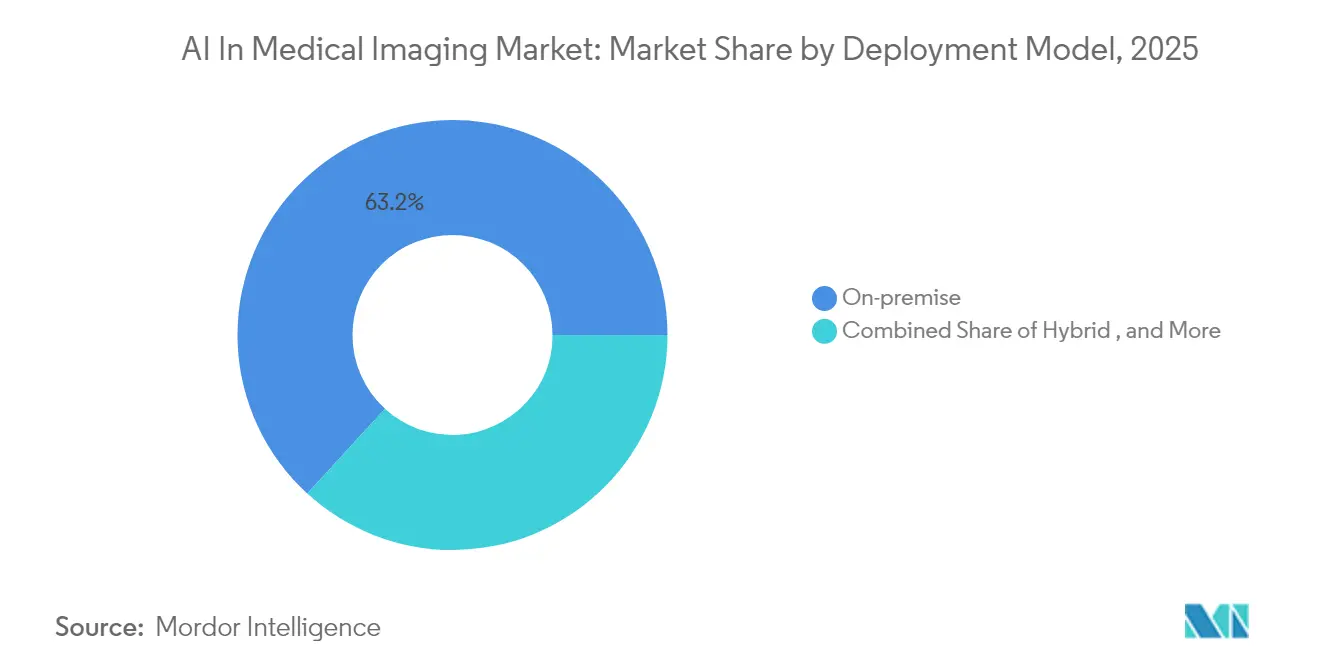
- By deployment model, on-premise systems held 63.20% share of the AI in medical imaging market size in 2025, yet cloud solutions are projected to climb at 35.4% CAGR to 2031.
- By end user, hospitals and clinics commanded 70.30% of 2025 revenue, while teleradiology providers registered the highest forecast CAGR at 34.9%.
- By geography, North America led with 40.60% revenue share in 2025; Asia is the fastest-growing region, expected to post a 32.5% CAGR through 2031.
Note: Market size and forecast figures in this report are generated using Mordor Intelligence’s proprietary estimation framework, updated with the latest available data and insights as of 2026.
Global AI In Medical Imaging Market Trends and Insights
Drivers Impact Analysis*
| Driver | (~) % Impact on CAGR Forecast | Geographic Relevance | Impact Timeline |
|---|---|---|---|
| Rapid expansion of multi-vendor PACS interoperability standards | +6.20% | North America and Europe | Medium term (2–4 years) |
| Accelerating oncology screening mandates in Asia | +5.80% | Asia | Medium term (2–4 years) |
| Large-scale national AI diagnostics grants | +4.70% | North America and Europe | Medium term (2–4 years) |
| Growing shortage of radiologists boosting teleradiology | +5.30% | Europe and Middle East | Short term (≤ 2 years) |
| Enterprise-level Cloud Migration of Imaging Archives by U.S. IDNs | +4.30% | United States, expanding to Canada and Western Europe | Medium term (2–4 years) |
| Commercial Roll-out of FDA and CE Cleared SaMD Algorithms for Stroke Triage | +3.70% | North America and Europe; emerging adoption in Asia | Short term (≤ 2 years) |
| Source: Mordor Intelligence | |||
Rapid expansion of multi-vendor PACS interoperability standards in U.S. and EU
Cross-border imaging exchange rules from the EU eHealth Network and upcoming U.S. interoperability provisions allow algorithms to read scans stored on any certified PACS. Early pilots using FHIR-based federated frameworks achieved 95% data-retrieval accuracy and cut latency by 38%, enabling faster triage in acute settings while maintaining data sovereignty
Accelerating oncology screening mandates in Asia (China, Japan, South Korea)
Government-funded programs are adding millions of extra CT and endoscopy exams each year. South Korea’s national gastric-cancer initiative demonstrates favorable cost-utility ratios, and Japan now detects 70% of lung cancers at Stage I or II when AI flags incidental nodules.
Large-scale national AI diagnostics grants
Programs such as NIH Bridge2AI are funding algorithm development, workforce training, and bias-mitigation research. In the United Kingdom, NHS-AI pilots of e-Stroke have lifted mechanical-thrombectomy rates by 62% and shortened patient transfer times, translating research investment into measurable care improvements.
Growing shortage of radiologists boosting teleradiology adoption in Nordics & GCC
Rising scan volumes and limited specialist availability press health systems to outsource reads. AI-enhanced teleradiology platforms now offer automated triage, structured reporting, and quality-control dashboards, helping providers uphold turnaround-time targets without expanding headcount.
Restraints Impact Analysis*
| Restraint | (~) % Impact on CAGR Forecast | Geographic Relevance | Impact Timeline |
|---|---|---|---|
| Fragmented data-governance laws are hindering cross-border model training | –3.2% | EU and Asia | Medium term (2–4 years) |
| High per-scan inference costs on edge GPUs in low-volume clinics | –2.8% | Global (emerging markets) | Short term (≤ 2 years) |
| Liability Ambiguity Around AI-assisted Diagnosis in EU MDR | –2.3% | EU | Medium term (2–4 years) |
| CAPEX Freeze in Small and Rural Hospitals Post-COVID Capital Depletion | –1.7% | North America and Asia | Short term (≤ 2 years) |
| Source: Mordor Intelligence | |||
Fragmented data-governance laws are hindering cross-border AI model training
The EU AI Act classifies diagnostic algorithms as high-risk, demanding rigorous conformity assessments. Divergent consent rules across Asia further limit the use of multi-country datasets, which in turn degrade model generalizability and slow down approvals, especially for rare-disease cohorts.[2]European Commission, “Artificial Intelligence Act – High-Risk Medical Devices,” ec.europa.eu
High per-scan inference costs on edge GPUs in low-volume clinics
GPU hardware enables sub-second inference but remains expensive. Benchmark tests show bone-age models jump from 1.4 to 267 images per second on GPUs, yet capital and maintenance outlays restrict adoption to larger hubs. CPU-optimized toolkits from Intel offer relief but are still rolling out.[1] Intel, “AI-Driven Medical Imaging Performance on Xeon and Arc Architecture,” intel.com
*Our forecasts treat driver/restraint impacts as directional, not additive. The impact forecasts reflect baseline growth, mix effects, and variable interactions.
Segment Analysis
By Offering: Platforms Consolidate Enterprise Workflows
The software tools and platforms segment captured 57.30% of 2025 revenue, underlining its role as the operating layer for algorithm orchestration and lifecycle management across hospital networks. Services are adding value through workflow redesign and post-deployment monitoring and are forecast to post the fastest 31.4% CAGR during 2026-2031. Vendors now bundle implementation, clinical-validation and cybersecurity support, reflecting provider preference for turnkey engagements that minimize disruption. Edge-enabled appliances remain a niche but are gaining traction for stroke and trauma hubs where every second matters. Hospitals appreciate vendor-neutral marketplaces that host dozens of cleared algorithms behind a single sign-on. GE HealthCare’s Genesis stack lets radiologists select applications à la carte and deploy updates without manual re-validation, lowering total cost of ownership and accelerating time-to-benefit GE HealthCare. Such architectures anchor the AI in medical imaging market and will shape procurement for the remainder of the decade.


By Imaging Modality: CT Holds Lead, Ultrasound Rises Fast
CT retained 27.60% share of the AI in medical imaging market in 2025 thanks to its ubiquity in trauma, chest and neuro protocols. Algorithmic triage in stroke care is now standard in many urban stroke centers, shrinking door-to-needle times. Photon-counting CT, newly commercialized, promises sharper cardiac images, opening fertile ground for next-generation models. Ultrasound is projected to outpace all other modalities with a 31.0% CAGR through 2031. Hand-held probes paired with real-time AI guidance help emergency staff locate internal bleeding and assist midwives in fetal-growth checks. The portability of modern devices increases scan frequency, feeding ever larger datasets into training pipelines. MRI and PET continue to see algorithmic gains in noise reduction and quantitative mapping, yet their growth remains tied to scanner throughput constraints and reimbursement complexities.
By Application: Oncology Remains Anchor, Pulmonology Accelerates
Oncology commanded 30.40% of 2025 revenue, cementing its position as the largest use-case cluster within the AI in medical imaging market. Algorithms now delineate tumors, assign TNM stages and estimate therapy response, assisting multidisciplinary boards in treatment planning. Radiomics features extracted by AI also inform early-phase drug trials, shortening discovery cycles for pharma partners. Pulmonology will expand the fastest at 33.5% CAGR during 2026-2031. COVID-19 left health systems with heightened vigilance on respiratory conditions, spurring investment in tools that detect interstitial lung disease, pulmonary embolism and chronic obstructive patterns. AI platforms that scan chest radiographs in community clinics catch abnormalities quickly and route suspicious cases for confirmatory CT, supporting earlier interventions.
By Deployment Model: Cloud Adoption Gains Momentum
On-premise installations still represent 63.20% of current deployments, a legacy of stringent data-security policies and real-time performance needs. Yet the economics of scale now favor hosted models. Cloud-ready archives slash infrastructure refresh costs and enable cross-site reading pools, pivotal for networks coping with staff shortages. The cloud segment is slated to post a 35.4% CAGR through 2031, making it the fastest-growing deployment tier within the AI in medical imaging market. Hybrid architectures bring local caching for urgent studies and cloud elasticity for longitudinal analytics. Philips HealthSuite Imaging on Amazon Web Services illustrates how vendors blend local responsiveness with centralized governance, delivering unified worklists to radiologists irrespective of location
By End User: Hospitals Dominate, Teleradiology Providers Surge
Hospitals and clinics held 70.30% revenue share in 2025, reflecting their ownership of advanced scanners, Picture Archiving systems and specialist expertise. Survey data show almost one-half of large hospitals already use at least one imaging-AI tool in regular practice. They seek unified dashboards that highlight critical cases, automate measurements and feed structured findings into electronic health records. Teleradiology providers will record a 34.9% CAGR, the highest across end-user groups. Regional hubs redistribute workload across time zones so reports arrive before morning rounds. AI accelerates preliminary reads, allowing scarce subspecialists to focus on complex studies while maintaining rapid turnaround. Ambulatory surgery centers and academic institutes adopt AI mainly for workflow efficiency, quality assurance and algorithm-validation research.
Geography Analysis
North America led the AI in medical imaging market with 40.60% share in 2025. Robust health IT infrastructure, proactive FDA clearances and reimbursement pathways bolster adoption. Integrated Delivery Networks rapidly migrate archives to the cloud to pool radiologists and unlock predictive analytics. Canada’s fresh approval of chest and neuro AI applications signals wider regional uptake. Asia is the fastest-growing geography, projected at 32.5% CAGR to 2031. China counts dozens of homegrown cleared devices, and Japan funds nationwide lung-cancer screening that leans heavily on AI triage. South Korea’s national programs display cost-effectiveness that encourages similar rollouts. India advances TB-focused tools for low-resource clinics, highlighting the versatility of AI across income brackets. Europe balances opportunity and caution. The Medical Devices Regulation heightens compliance requirements, yet pan-EU image-exchange guidelines unlock a broader data pool that benefits algorithm robustness. The Nordics pioneer teleradiology to serve remote regions, while France embarks on long-term imaging-value partnerships that incorporate sustainability clauses and research funding.

Competitive Landscape
Competition is vibrant and fragmented. Incumbent modality vendors leverage installed bases to insert AI across scanners, workstations, and cloud suites. GE HealthCare lists 72 FDA-cleared applications, Siemens Healthineers has 64, and Philips holds 27, signaling a deepening feature race. Acquisitions such as GE HealthCare’s purchase of MIM Software expand multimodality integration capabilities and strengthen lock-in.
Specialist firms including Aidoc, RapidAI and Qure.ai innovate rapidly in stroke, trauma and pulmonary use cases. They license modules through vendor-neutral marketplaces and partner with scanner makers to shorten deployment cycles. Yet only a handful of algorithms enjoy clear payment codes, underscoring the immaturity of reimbursement frameworks. Start-ups therefore diversify into decision-support bundles that deliver measurable turn-around time gains, a metric hospitals can monetize internally.
Cloud hyperscalers influence the stack from below, offering AI-optimized storage tiers and federated learning services. These moves lower entry barriers for niche developers and intensify price pressure on proprietary archives, adding another layer to competitive dynamics within the AI in medical imaging market.
AI In Medical Imaging Industry Leaders
Siemens Healthineers AG
GE HealthCare Technologies Inc.
Koninklijke Philips N.V.
NVIDIA Corporation
Aidoc Medical Ltd.
- *Disclaimer: Major Players sorted in no particular order

Recent Industry Developments
- April 2025: GE HealthCare and FPT opened a Vietnamese center to co-develop AI diagnostic tools for emerging markets.
- March 2025: GE HealthCare introduced the Genesis cloud portfolio built on Amazon Web Services, combining edge processing, vendor-neutral archiving and algorithm marketplaces.
- February 2025: Philips rolled out its cloud enterprise-imaging service in Europe, adding generative-AI voice reporting to ease documentation burdens.
- January 2025: AZmed’s Rayvolve suite surpassed 2,500 hospital installations worldwide, matching radiologist performance in fracture detection while cutting report times.


Global AI In Medical Imaging Market Report Scope
Medical imaging can be described as the diagnostic procedure that involves the creation of visual aids and image representations of the human body and involves monitoring the performance and functioning of the organs of the human body. With the integration of artificial intelligence (AI) in healthcare and medical imaging, there is a change in how the diagnostics and the entire procedure are carried out. The AI assists the surgeons in carrying out the image-capturing process and how to diagnose these images for the conclusion and personalized treatment concerning every individual and patient.
The AI Market in Medical Imaging is segmented by Offering (Software Tools/Platform and Services), Image Acquisition Technology (X-Ray, Computed Tomography, Magnetic Resonance Imaging, Ultrasound Imaging, and Molecular Imaging), End User (Hospitals, Clinics, and Research Laboratories and Diagnostic Centers), and Geography. The market sizes and forecasts are provided in terms of value in USD for all the above segments.
| Software Tools / Platforms |
| Services |
| Hardware / Integrated Solutions |
| X-ray |
| Computed Tomography (CT) |
| Magnetic Resonance Imaging (MRI) |
| Ultrasound |
| Positron Emission Tomography (PET) / SPECT |
| Oncology |
| Neurology |
| Cardiology |
| Musculoskeletal and Orthopedics |
| Breast Imaging |
| Pulmonology |
| On-premise |
| Cloud / Web-based |
| Hybrid |
| Hospitals and Clinics |
| Diagnostic Imaging Centers |
| Ambulatory Surgery Centers (ASC) |
| Research and Academic Institutes |
| Teleradiology Providers |
| North America | United States |
| Canada | |
| South America | Brazil |
| Argentina | |
| Chile | |
| Europe | Germany |
| France | |
| United Kingdom | |
| Italy | |
| Spain | |
| Nordics (Sweden, Norway, Finland, Denmark) | |
| Rest of Europe | |
| Middle East | Saudi Arabia |
| United Arab Emirates | |
| Turkey | |
| Rest of Middle East | |
| Africa | South Africa |
| Nigeria | |
| Rest of Africa | |
| Asia Pacific | China |
| India | |
| Japan | |
| South Korea | |
| Southeast Asia | |
| Rest of Asia Pacific |
| By Offering | Software Tools / Platforms | |
| Services | ||
| Hardware / Integrated Solutions | ||
| By Imaging Modality | X-ray | |
| Computed Tomography (CT) | ||
| Magnetic Resonance Imaging (MRI) | ||
| Ultrasound | ||
| Positron Emission Tomography (PET) / SPECT | ||
| By Application | Oncology | |
| Neurology | ||
| Cardiology | ||
| Musculoskeletal and Orthopedics | ||
| Breast Imaging | ||
| Pulmonology | ||
| By Deployment Model | On-premise | |
| Cloud / Web-based | ||
| Hybrid | ||
| By End User | Hospitals and Clinics | |
| Diagnostic Imaging Centers | ||
| Ambulatory Surgery Centers (ASC) | ||
| Research and Academic Institutes | ||
| Teleradiology Providers | ||
| By Geography | North America | United States |
| Canada | ||
| South America | Brazil | |
| Argentina | ||
| Chile | ||
| Europe | Germany | |
| France | ||
| United Kingdom | ||
| Italy | ||
| Spain | ||
| Nordics (Sweden, Norway, Finland, Denmark) | ||
| Rest of Europe | ||
| Middle East | Saudi Arabia | |
| United Arab Emirates | ||
| Turkey | ||
| Rest of Middle East | ||
| Africa | South Africa | |
| Nigeria | ||
| Rest of Africa | ||
| Asia Pacific | China | |
| India | ||
| Japan | ||
| South Korea | ||
| Southeast Asia | ||
| Rest of Asia Pacific | ||


Key Questions Answered in the Report
What is the current size of the AI in medical imaging market?
The AI in medical imaging market size is USD 2.16 billion in 2026 and is forecast to reach USD 8.23 billion by 2031.
Which segment leads the market by offering?
Software platforms hold the largest 57.30% share, thanks to their role in orchestrating algorithms across PACS and cloud archives.
What modality is growing fastest?
Ultrasound is projected to register a 31.0% CAGR from 2026-2031, driven by point-of-care applications and real-time AI guidance.
Why is Asia the fastest-growing region?
Government-mandated cancer-screening programs and accelerated device approvals are pushing Asia to a 32.5% regional CAGR.
Which region has the biggest share in AI In Medical Imaging Market?
In 2025, the North America accounts for the largest market share in AI In Medical Imaging Market.
How does cloud deployment benefit providers?
Cloud archives cut infrastructure costs and let radiologists collaborate across sites, supporting a 35.4% CAGR for the deployment model.
Are AI tools reimbursed today?
Only a handful of algorithms have explicit payment codes, but providers justify investments through productivity gains and reduced turnaround times.
Page last updated on:


