
GPU Accelerator Card Market Size and Share
Market Overview
| Study Period | 2020 - 2031 |
|---|---|
| Market Size (2026) | USD 35.23 Billion |
| Market Size (2031) | USD 74.86 Billion |
| Growth Rate (2026 - 2031) | 20.74 % |
| Fastest Growing Market | Asia-Pacific |
| Largest Market | North America |
| Market Concentration | High |
Major Players *Disclaimer: Major Players sorted in no particular order Image © Mordor Intelligence. Reuse requires attribution under CC BY 4.0. | |
GPU Accelerator Card Market Analysis by Mordor Intelligence
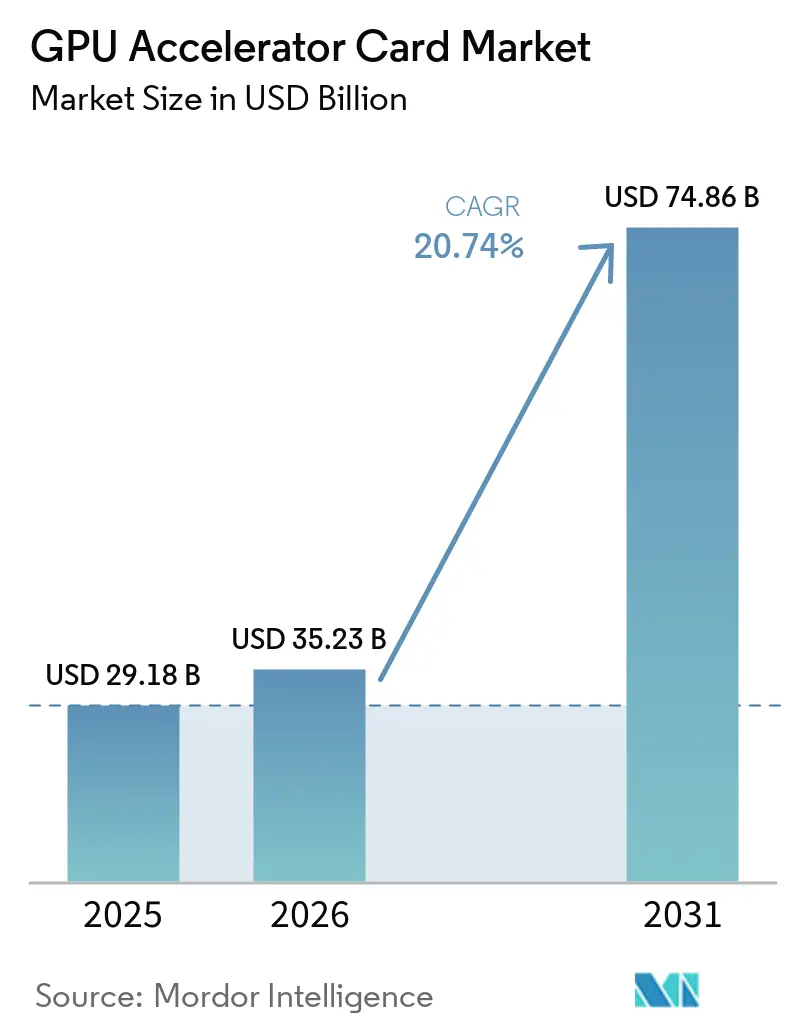
The GPU accelerator card market size is expected to increase from USD 29.18 billion in 2025 to USD 35.23 billion in 2026 and reach USD 74.86 billion by 2031, growing at a CAGR of 20.74% over 2026-2031. Memory bandwidth rather than raw compute now dictates performance ceilings, encouraging designs that integrate more HBM stacks and higher-speed interconnects. Sovereign investments worth USD 33 billion through 2026, combined with USD 660 billion in hyperscaler AI capital expenditure, have created persistent demand that outpaces substrate and HBM supply. Form-factor preferences are diverging, hyperscalers are pivoting to Open Accelerator Module (OAM) layouts for rack-level density, while enterprises are retaining PCIe for incremental upgrades. Fragmented export-control regimes are reshaping supply chains, forcing vendors to tailor silicon for restricted and unrestricted markets, which in turn sustains premium pricing for constrained parts across the GPU accelerator card market.
Key Report Takeaways
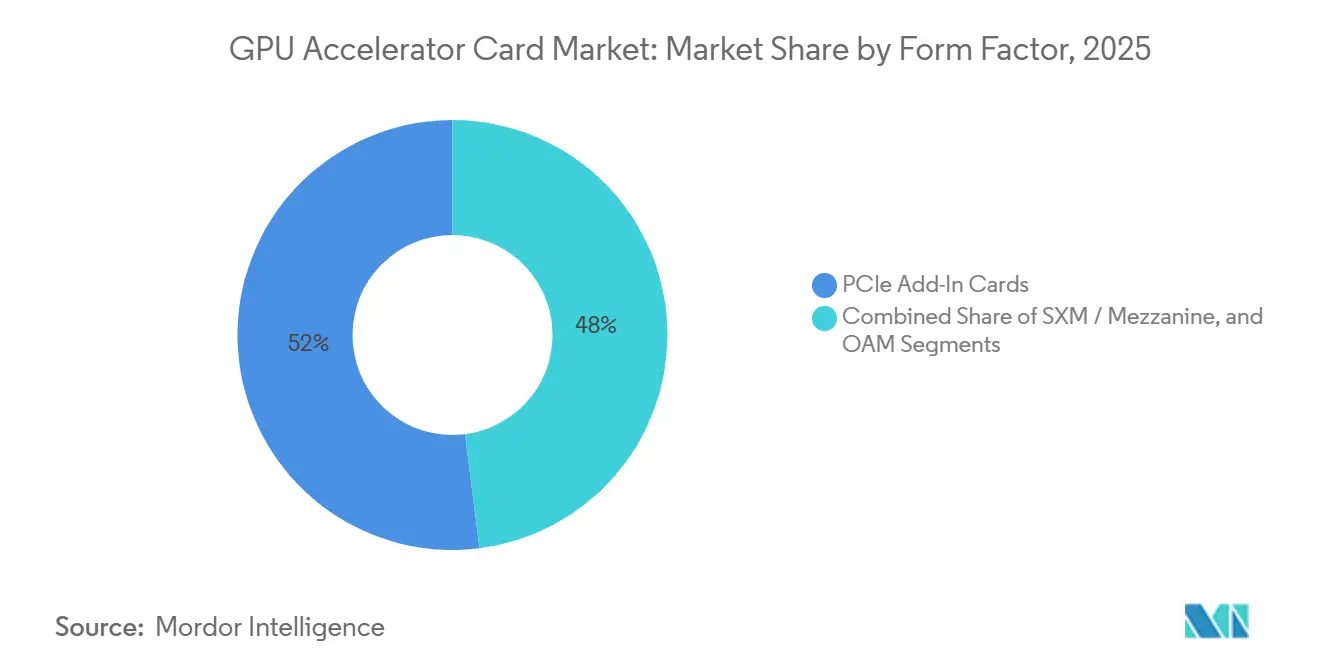
- By form factor, PCIe add-in cards led with 52% revenue share in 2025, whereas OAM modules are expanding at a 21.34% CAGR through 2031.
- By memory type, HBM captured 84% of the GPU accelerator card market share in 2025, and its segment is projected to advance at a 21.14% CAGR until 2031.
- By cooling solution, passive implementations accounted for 71% of the GPU accelerator card market size in 2025, while active liquid cooling is set to grow at 21.18% over the forecast period.
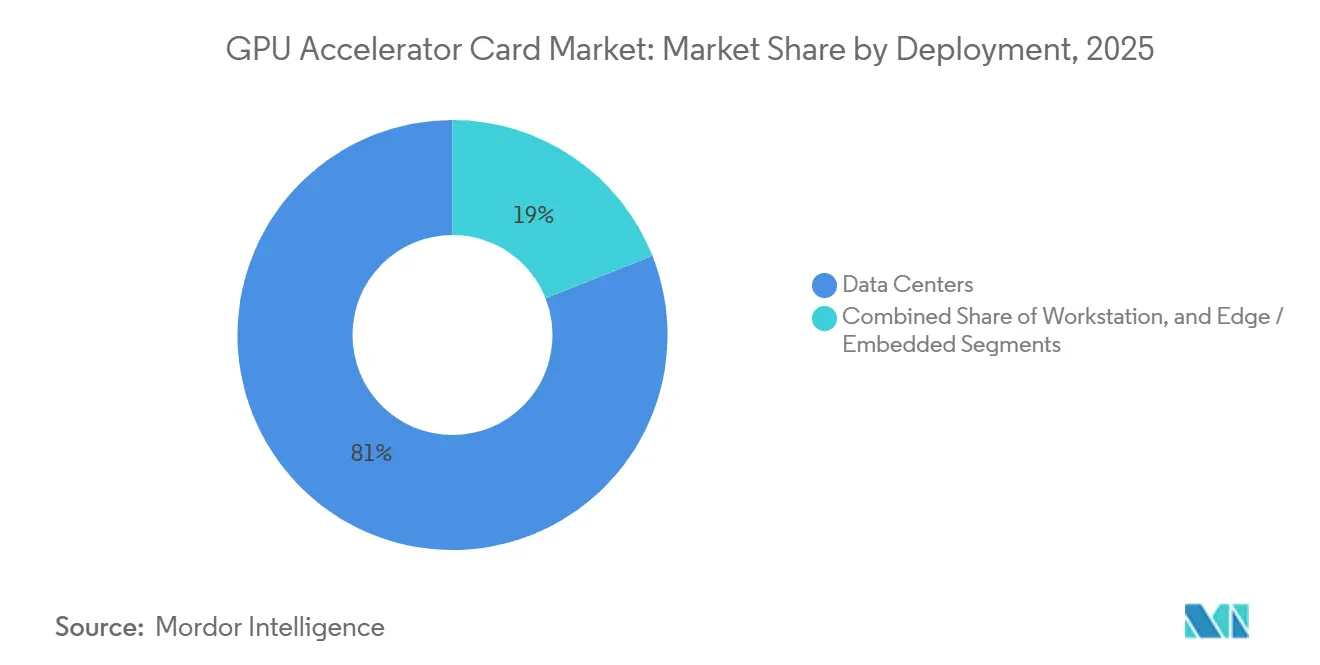
- By deployment, data center installations accounted for 81% of the 2025 volume, yet edge and embedded cards are forecast to grow at a 21.39% CAGR through 2031.
- By industry vertical, cloud service providers held 58% of revenue in 2025 and are projected to continue at a 21.76% CAGR through 2031, outpacing all other customer segments.
- By geography, North America dominated with 46% share in 2025, whereas Asia-Pacific is anticipated to expand at the fastest 21.82% CAGR to 2031.
Note: Market size and forecast figures in this report are generated using Mordor Intelligence’s proprietary estimation framework, updated with the latest available data and insights as of January 2026.
Global GPU Accelerator Card Market Trends and Insights
Drivers Impact Analysis*
| Driver | (~) % Impact on CAGR Forcast | Geographic Relevance | Impact Timeline |
|---|---|---|---|
| Explosive Growth in AI and Machine Learning Training Workloads | +6.8% | Global, with concentration in North America and Asia-Pacific | Long term (≥ 4 years) |
| Surging Adoption of Cloud Gaming and Streaming Platforms | +3.2% | North America, Europe, Asia-Pacific urban centers | Medium term (2-4 years) |
| Accelerated Enterprise Roll-outs of Generative AI Applications | +5.4% | Global, led by North America and Europe enterprise segments | Medium term (2-4 years) |
| Rising Demand for High-Performance Computing in Academia and Government | +2.9% | North America, Europe, Asia-Pacific (Japan, India, Singapore) | Long term (≥ 4 years) |
| EU Sustainability Rules Accelerating Procurement of Energy-Efficient GPUs | +1.6% | Europe, with spillover to North America and Asia-Pacific | Short term (≤ 2 years) |
| Open Accelerator Module (OAM) Standard Enabling Multi-Vendor Interoperability | +2.1% | Global, concentrated in hyperscale datacenter deployments | Medium term (2-4 years) |
| Source: Mordor Intelligence | |||
Explosive Growth in AI And Machine Learning Training Workloads
Model parameter counts have jumped from 1.8 trillion to over 10 trillion, requiring clusters with more than 100,000 accelerators and interconnect fabrics exceeding 400 Gbps per GPU. Frontier systems at U.S. national laboratories now integrate more than 28,000 NVIDIA H100 units, while hyperscalers each spent over USD 70 billion expanding AI capacity in 2025. Training jobs demand sustained utilization near 90%, reshaping total cost-of-ownership assumptions and locking in long multi-year hardware pipelines. Pre-training costs exceeding USD 100 million per run have narrowed participation to capital-intensive firms, thereby fortifying demand across the GPU accelerator card market. The resulting pressure keeps premium parts supply-constrained, sustaining high average selling prices even as volumes climb.
Surging Adoption of Cloud Gaming and Streaming Platforms
Cloud gaming revenues hit USD 8.5 billion in 2025, and leading platforms now target 4 K at 240 fps with sub-40 ms latency. Providers confront sharp evening peaks that create three-to-one utilization swings, so many routes idle overnight capacity toward generative AI inference to lift asset use from 35% to 65%. Latency budgets under 50 ms require edge data centers within 20 ms of end users, driving demand for compact, passively cooled accelerators that tolerate remote operation. As competitive esports titles migrate to cloud delivery, every millisecond of delay becomes a risk of customer churn, accelerating refresh cycles in the GPU accelerator card market.
Accelerated Enterprise Roll-Outs of Generative AI Applications
High API fees have shortened payback periods for self-hosted clusters to roughly 18 months, prompting banks, insurers, and pharmaceutical companies to deploy between 500 and 2,000 GPUs per site. Data-sovereignty mandates within the European Union further push customers toward on-premise hardware, favoring widely compatible PCIe cards over proprietary mezzanine formats. Healthcare providers process tens of thousands of imaging scans daily on HIPAA-compliant clusters, shrinking diagnostic turnaround times by an order of magnitude. These economics sustain PCIe’s 52% share despite lower power efficiency and keep enterprise demand sticky inside the GPU accelerator card market.
Rising Demand for High-Performance Computing in Academia and Government
Government procurements reached USD 12 billion in 2025 as nations chase AI sovereignty. Japan earmarked JPY 4 trillion (USD 26 billion) for ABCI-3.0 and future exascale systems, India budgeted INR 103.07 billion (USD 1.24 billion) for 10,000 GPUs, and Europe rolled out MI300X-based exascale sites. Academic workloads prioritize memory capacity over sheer throughput, valuing 192 GB or larger per device to handle sparse matrices and genomic datasets. Consequently, vendors offering higher-capacity HBM configurations gain meaningful share, reinforcing bandwidth as the chief purchasing criterion within the GPU accelerator card market.[1]Japan Ministry of Economy, Trade and Industry, “AI Policy and Investment Initiatives,” meti.go.jp
Restraints Impact Analysis*
| Restraint | (~) % Impact on CAGR Forecast | Geographic Relevance | Impact Timeline |
|---|---|---|---|
| Persistent Supply Chain Constraints in Advanced Substrates | -3.4% | Global, most acute in Asia-Pacific manufacturing hubs | Medium term (2-4 years) |
| High Total Cost of Ownership of Datacenter GPU Infrastructure | -2.8% | Global, concentrated in enterprise and mid-tier cloud providers | Long term (≥ 4 years) |
| HBM Capacity Bottlenecks Limiting Board-Level Memory Expansion | -2.1% | Global, affecting all accelerator manufacturers | Short term (≤ 2 years) |
| Export-Control Restrictions Curtailing Cross-Border GPU Shipments | -1.9% | Asia-Pacific (China), Middle East, select emerging markets | Long term (≥ 4 years) |
| Source: Mordor Intelligence | |||
Persistent Supply Chain Constraints in Advanced Substrates
Ajinomoto Build-up Film substrates remain fully booked through 2027, stretching lead times to 52 weeks. NVIDIA, AMD, and Intel hold multiyear allocations from the same pool of Taiwanese and Korean suppliers, crowding out smaller entrants. The 2024 Taiwan earthquake highlighted the fragility of this node, as it paused production for 6 weeks and lengthened global scheduling by another quarter. Because substrates form up to one-fifth of a board’s bill of materials, price spikes ripple directly to end cards, creating a headwind for the GPU accelerator card market.
High Total Cost of Ownership of Datacenter GPU Infrastructure
A 1,000-GPU cluster draws as much as 3 MW, adding USD 3 million in annual power bills, even before cooling overheads. Liquid cooling hardware costs USD 50,000-100,000 per rack, ten times higher than air-cooled setups, and still demands specialized maintenance. Unless operators achieve utilization above 60%, amortized costs exceed API consumption costs, deterring mid-tier clouds from purchasing accelerators outright. New EU directives that cap power-usage-effectiveness below 1.3 compel even deeper spending on efficiency upgrades, elevating barriers to entry in the GPU accelerator card market.[2]European Commission, “Energy Efficiency Directive 2023/1791 Requirements,” ec.europa.eu
*Our forecasts treat driver/restraint impacts as directional, not additive. The impact forecasts reflect baseline growth, mix effects, and variable interactions.
Segment Analysis
By Form Factor: OAM’s Density Upswing
OAM modules posted a 21.34% CAGR from 2026 to 2031, while the PCIe add-in card GPU accelerator market commanded 52% of revenue in 2025. OAM lets hyperscalers pack 72 accelerators drawing 1.4 MW into a 42U rack, shrinking floor space 40% compared with PCIe equivalents. Meta and its peers standardized on direct-liquid-cooled OAM designs that handle 700-W GPUs, enhancing power efficiency by 25%. In contrast, enterprises prize PCIe’s hot-swappable flexibility, which still anchors procurement cycles for firms upgrading a few servers at a time.
The efficiency delta translates into materially lower cost per floating-point operation at massive scale, so OAM’s installed base will keep climbing in hyperscale facilities. Yet the GPU accelerator card market remains bifurcated because smaller organizations hesitate to rebuild racks around 700-W liquid-cooling loops. SXM modules, embedded primarily in NVIDIA’s DGX systems, hold a 28% share and will maintain niche demand among users who value proprietary NVLink bandwidth over open standards.



By Memory Type: HBM’s Bandwidth Lock-In
HBM attained 84% of 2025 revenue and remains the fulcrum of competitive positioning, with the GPU accelerator card market share segment anchored by supply from SK Hynix, Samsung, and Micron. Each HBM3e stack now delivers 1.15 TB/s, and top devices couple eight or more stacks for 8 TB/s aggregate bandwidth. Model sizes keep rising faster than Moore’s law gains, so buyers willingly pay the 8x premium over GDDR6.[3]SK Hynix, “HBM3e and HBM4 Memory Technology Roadmap,” skhynix.com
GDDR-backed cards continue to serve workstations and edge inference, where cost per GB trumps peak bandwidth, retaining a 16% share. HBM4 is scheduled for 2027 and promises 2 TB/s per stack, potentially easing the bottleneck but likely at even higher unit costs initially. Until fresh capacity in South Korea and the United States reaches volume scale in 2028, HBM supply will constrain overall growth in the GPU accelerator card market.
By Cooling: Passive Dominance Faces Power-Density Limits
Passive heatsink-and-fan solutions shipped in 71% of 2025 units, favored for simplicity and capex that is an order of magnitude lower than liquid systems. Air-cooled cards cost USD 200-500 each for thermal components, while liquid plates and distribution lines add USD 2,000-5,000, so many enterprises accept lower power ceilings to avoid plumbing complexity. That said, active liquid loops keep junction temperatures below 85 °C while supporting 700-W GPUs, a threshold that passive systems cannot reach without throttling.
As next-generation silicon approaches 1,000 W per device, liquid methods will capture new deployments inside hyperscale halls. Edge and automotive platforms will still rely on passive approaches because maintenance crews are not on-site and fanless designs prevail in dusty or vibration-heavy environments. Power envelopes, therefore, split the GPU-accelerator card market into high-density, liquid-cooled data centers and distributed, passive-cooled nodes.
By Deployment: Edge Momentum Builds
Data centers accounted for 81% of 2025 volume, yet edge and embedded shipments are forecast to grow at a 21.39% CAGR through 2031. On-vehicle accelerators in autonomous cars now equal thousands of datacenter GPUs in aggregate TOPS, and industrial sensor arrays generate bandwidth costs that make on-premise inference cheaper than cloud roundtrips. Because many edge sites operate without specialized staff, reliability and passive cooling weigh more than raw throughput.
Workstation demand consistently accounts for a stable 12% share of the market, primarily supporting workloads such as design, rendering, and visualization. These workloads typically require FP64 precision or large framebuffers but do not necessitate cluster-scale orchestration capabilities. In the broader context, the differing economics of latency and bandwidth are driving faster growth trajectories for edge use cases. This trend is contributing to incremental diversification within the GPU accelerator card market landscape, as edge applications continue to expand and evolve.
By Industry Vertical: Cloud Providers Retain Primacy
Cloud service providers accounted for 58% of 2025 revenue and are projected to continue expanding at a compound annual growth rate (CAGR) of 21.76% through 2031. This growth is primarily driven by hyperscalers striving to lower inference costs per query, which is a critical factor in their operations. Companies such as Meta, Amazon, and Microsoft collectively purchased tens of thousands of GPUs in 2025. These purchases highlight the increasing reliance on self-hosting, which offers better cost control, especially when daily generative queries exceed a billion. Enterprise IT followed with 24% market share, supported by significant deployments across industries such as finance, healthcare, and manufacturing. These industries are particularly focused on adhering to data-sovereignty mandates, which are becoming increasingly important in the current regulatory environment.
Government and research labs held a 9% market share, driven by national compute-sovereignty agendas that emphasize maintaining control over computational resources. Meanwhile, the media, entertainment, and automotive segments accounted for the remaining market share. Custom silicon initiatives, such as Amazon Trainium and Google TPU, have the potential to reduce reliance on merchant GPUs. However, the strong software lock-in associated with platforms such as CUDA and ROCm continues to sustain current demand trends in the GPU accelerator card market.
Geography Analysis
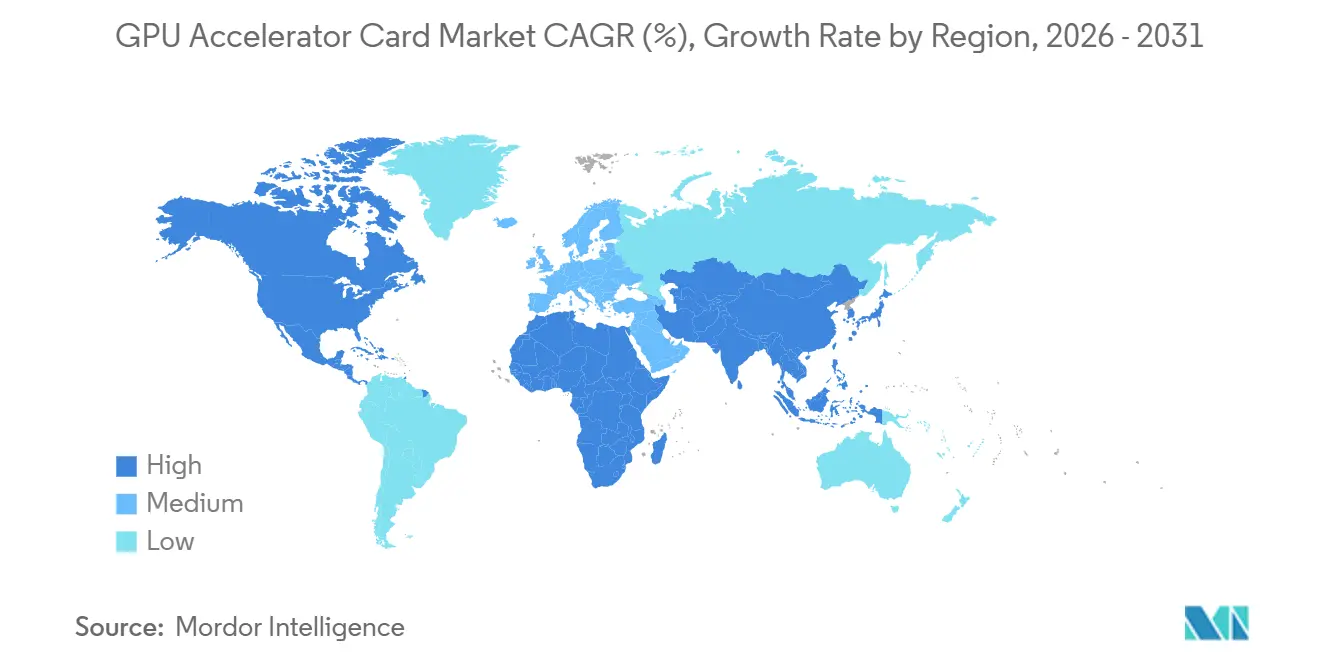
North America accounted for 46% of 2025 revenue, driven by hyperscaler outlays exceeding USD 300 billion. However, the regional compound annual growth rate (CAGR) is projected at a below-average 19.8%, primarily due to delays in grid interconnections and challenges in obtaining power permits, which are slowing further datacenter buildouts. In Canada, hydro-powered provinces have attracted investments totaling USD 8 billion for the construction of new data halls. Meanwhile, the U.S. export regime, which restricts the sale of advanced GPUs to China, has redirected excess demand domestically. This redirection has helped maintain elevated GPU prices in the region.
Asia-Pacific is set to grow at 21.82% CAGR, the fastest among regions. Japan allocated JPY 4 trillion (USD 26 billion) to AI research infrastructure, India’s INR 103.07 billion (USD 1.24 billion) mission will add 10,000 GPUs, and Singapore targets 50 PFLOPS with a USD 500 million buildout. China’s domestic vendors, shielded from export restrictions, shipped USD 8 billion worth of accelerators in 2025, while South Korea’s dominance in HBM supply cements the area’s strategic heft in the GPU accelerator card market.
Europe captured 18% share in 2025, helped by EuroHPC investments in exascale systems across Germany, Italy, and Spain. New directives requiring power-usage effectiveness below 1.3 and 80% renewable sourcing by 2028 drive demand for energy-efficient GPUs.[4]EuroHPC Joint Undertaking, “European Supercomputing Infrastructure Projects,” eurohpc-ju.europa.eu France also requires carbon accounting for training jobs above 10 PF-days, which privileges hyperscalers with established reporting infrastructure. South America and the Middle East and Africa collectively held 8% share, backed by sovereign wealth fund commitments in Brazil, the United Arab Emirates, and Saudi Arabia. Limited grid capacity and specialist workforce shortages curb near-term acceleration, yet long-distance cable upgrades and modular nuclear pilots could unlock latent demand post-2028.

Competitive Landscape
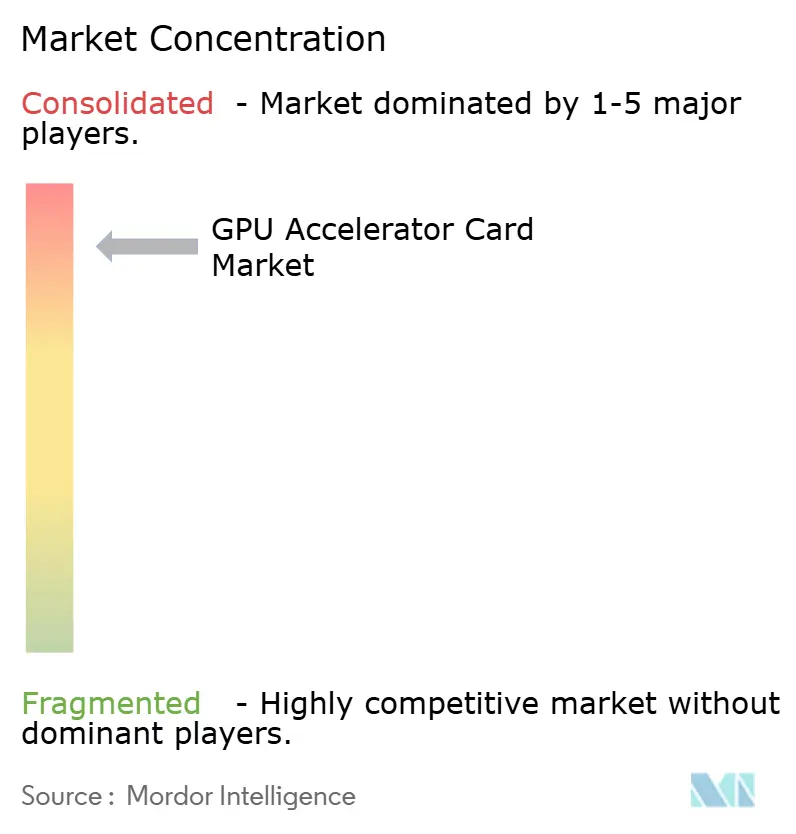
The GPU accelerator card market remains highly concentrated. NVIDIA continues to dominate the market, controlling approximately 80-85% of datacenter training deployments. This dominance is attributed to the widespread adoption of CUDA and the superior performance of NVLink, which provides high-speed interconnects. AMD’s MI300 family, on the other hand, holds a smaller but significant market share of about 10-12%, driven by key wins with cloud providers such as Azure and Oracle. Meanwhile, Intel’s Max Series has demonstrated competitiveness in high-performance computing (HPC) applications but has yet to achieve significant traction in the commercial AI space. Additionally, U.S. export restrictions have led to the emergence of a parallel Chinese ecosystem, where companies like Huawei Ascend and Alibaba T-Head cater to local demand by developing and deploying their own GPU solutions.
Start-ups in the market are focusing on achieving architectural breakthroughs to carve out niches. For instance, Cerebras’s wafer-scale engine eliminates chip-to-chip latencies, a significant innovation that helped the company secure a USD 10 billion contract with OpenAI. Similarly, Tenstorrent’s RISC-V-based designs and Groq’s deterministic LPUs are targeting specific inference applications. Furthermore, patent filings in the industry indicate a shift toward technologies such as optical interconnects and chiplets. These advancements aim to disaggregate compute and memory functions, presenting a challenge to traditional monolithic GPUs, which often face limitations due to substrate and high-bandwidth memory (HBM) bottlenecks.
Efforts to standardize form factors, such as through the Open Accelerator Module, could potentially reduce vendor lock-in. However, NVIDIA and AMD continue to maintain a competitive edge by offering proprietary high-speed fabrics that are not available over standard PCIe interfaces. In the long term, market concentration will depend on whether open-source software stacks like OpenXLA can erode CUDA’s competitive advantage. For now, companies with established HBM supply contracts and advanced packaging capabilities are expected to retain their dominant positions in the GPU accelerator card market.
GPU Accelerator Card Industry Leaders
NVIDIA Corporation
Advanced Micro Devices, Inc.
Intel Corporation
Huawei Technologies Co., Ltd.
Graphcore Ltd.
- *Disclaimer: Major Players sorted in no particular order

Recent Industry Developments
- March 2026: NVIDIA introduced the GB300 accelerator with 208 billion transistors, eight HBM3e stacks, and an NVL72 rack that combines 72 GPUs and 36 Grace CPUs for 1.44 exaflops of FP4 performance.
- January 2026: AMD commenced volume shipments of the Instinct MI355X, featuring 12 HBM3e stacks, 288 GB capacity, and 6.5 TB/s bandwidth, and won clusters at Azure and Meta.
- December 2025: Cerebras Systems closed a USD 1 billion Series H at a USD 23.1 billion valuation and secured a USD 10 billion inference contract with OpenAI.
- November 2025: Huawei produced 600,000 Ascend 910C units in 2025 and aims for 1.6 million by 2027, while the Ascend 910D rolls out in Q2 2026.


Global GPU Accelerator Card Market Report Scope
The GPU Accelerator Card Market comprises discrete hardware components designed to enhance computational performance by offloading and accelerating parallel processing tasks from central processing units (CPUs). These accelerator cards are widely used to support intensive workloads, including artificial intelligence (AI), machine learning (ML), data analytics, high-performance computing (HPC), and graphics rendering, across a variety of computing environments.
The GPU Accelerator Card Market Report is Segmented by Form Factor (PCIe Add-In Cards, SXM/Mezzanine, and OAM), Memory Type (HBM, and GDDR), Cooling (Passive, aand Active), Deployment (Data Center/Server, Workstation, and Edge/Embedded), Industry Vertical (Cloud Service Providers, Enterprise IT, Government and Research, Media and Entertainment, and Automotive/Edge AI), and Geography (North America, Europe, Asia-Pacific, South America, and Middle East and Africa). The Market Forecasts are Provided in Terms of Value (USD).
| PCIe Add-In Cards |
| SXM / Mezzanine |
| OAM |
| HBM |
| GDDR |
| Passive |
| Active |
| Data Center / Server |
| Workstation |
| Edge / Embedded |
| Cloud Service Providers |
| Enterprise IT |
| Government and Research |
| Media and Entertainment |
| Automotive / Edge AI |
| North America | United States |
| Canada | |
| Mexico | |
| Europe | United Kingdom |
| Germany | |
| France | |
| Rest of Europe | |
| Asia-Pacific | China |
| Japan | |
| India | |
| South Korea | |
| Rest of Asia Pacific | |
| South America | |
| Middle East and Africa |
| By Form Factor | PCIe Add-In Cards | |
| SXM / Mezzanine | ||
| OAM | ||
| By Memory Type | HBM | |
| GDDR | ||
| By Cooling | Passive | |
| Active | ||
| By Deployment | Data Center / Server | |
| Workstation | ||
| Edge / Embedded | ||
| By Industry Vertical | Cloud Service Providers | |
| Enterprise IT | ||
| Government and Research | ||
| Media and Entertainment | ||
| Automotive / Edge AI | ||
| By Geography | North America | United States |
| Canada | ||
| Mexico | ||
| Europe | United Kingdom | |
| Germany | ||
| France | ||
| Rest of Europe | ||
| Asia-Pacific | China | |
| Japan | ||
| India | ||
| South Korea | ||
| Rest of Asia Pacific | ||
| South America | ||
| Middle East and Africa | ||


Key Questions Answered in the Report
What is the current GPU accelerator card market size and how fast is it growing?
The GPU accelerator card market size stood at USD 29.18 billion in 2025 and is projected to reach USD 74.86 billion by 2031 at a 20.74% CAGR, according to Mordor Intelligence.
Which form factor is gaining the most momentum among hyperscale cloud providers?
Open Accelerator Module designs are expanding at a 21.34% CAGR because they pack 72 GPUs per rack and simplify liquid cooling integration.
Why is HBM memory so critical for modern accelerator cards?
AI training models now rely more on bandwidth than raw compute, and HBM delivers up to 8 TB/s per GPU, far exceeding what GDDR can provide.
How do export controls influence regional demand patterns?
U.S. restrictions on advanced GPUs drive Chinese clouds toward domestic alternatives like Huawei Ascend and Alibaba Zhenwu, creating parallel supply ecosystems.
What factors drive edge deployment growth for accelerators?
Latency sensitivity, bandwidth cost avoidance, and autonomy requirements in vehicles and factories make on-device inference more economical than centralized processing.
How concentrated is the competitive landscape?
NVIDIA leads with about 80-85% of training deployments, but AMD, Intel, Huawei, and emerging start-ups are gradually eroding that share through differentiated architectures.
Page last updated on:





