
Gene Panel Market Size and Share
Market Overview
| Study Period | 2020 - 2031 |
|---|---|
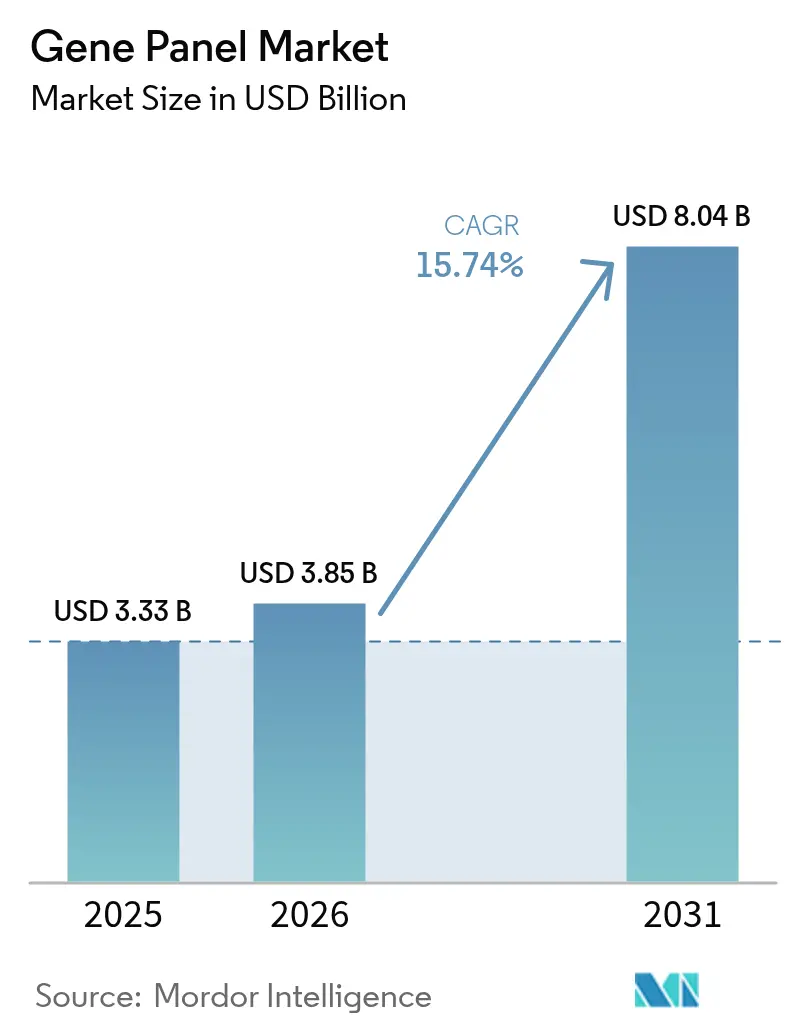
| Market Size (2026) | USD 3.85 Billion |
| Market Size (2031) | USD 8.04 Billion |
| Growth Rate (2026 - 2031) | 15.74 % |
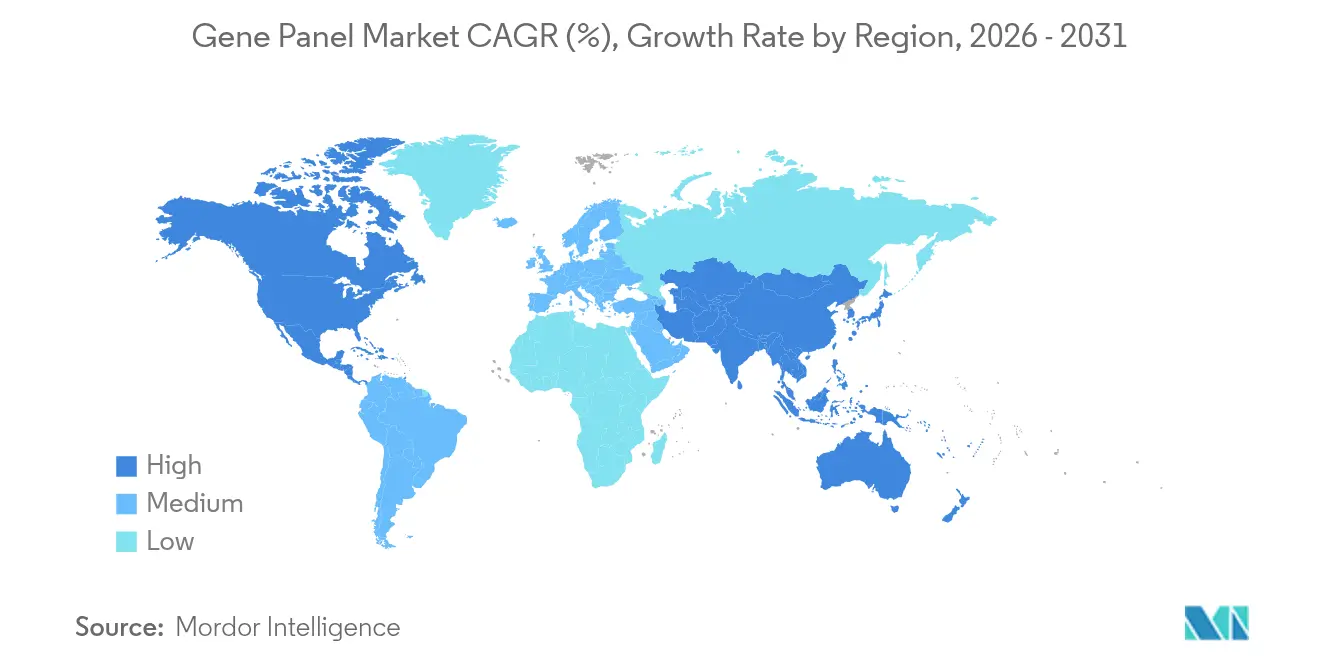
| Fastest Growing Market | Asia Pacific |
| Largest Market | North America |
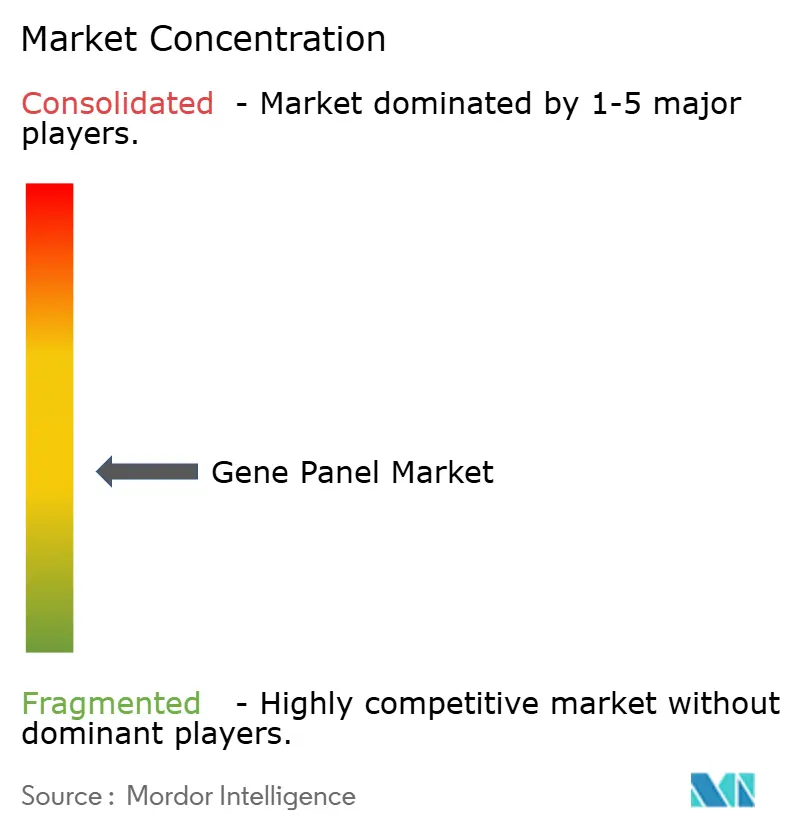
| Market Concentration | Medium |
Major Players *Disclaimer: Major Players sorted in no particular order Image © Mordor Intelligence. Reuse requires attribution under CC BY 4.0. | |
Gene Panel Market Analysis by Mordor Intelligence
The gene panel market size is expected to grow from USD 3.33 billion in 2025 to USD 3.85 billion in 2026 and is forecast to reach USD 8.04 billion by 2031 at 15.74% CAGR over 2026-2031. Growing clinical adoption, expanding payer coverage, and AI-enabled interpretation technologies underpin this rapid scale-up. Larger commercial laboratories adopt multi-cancer and pharmacogenomic panels as bundled services, spurring reagent demand and repeat testing volumes. Payer acceptance widens following the Centers for Medicare & Medicaid Services (CMS) National Coverage Determination 90.2 and parallel private-insurer guidelines, easing the reimbursement barrier for high-complexity assays [1]. At the same time, global population-scale sequencing initiatives and newborn screening pilots broaden the addressable test universe. Competitive intensity increases as full-stack providers knit sequencing platforms, informatics, and clinical reporting into single-vendor solutions, accelerating consolidation within the gene panel market.
Key Report Takeaways
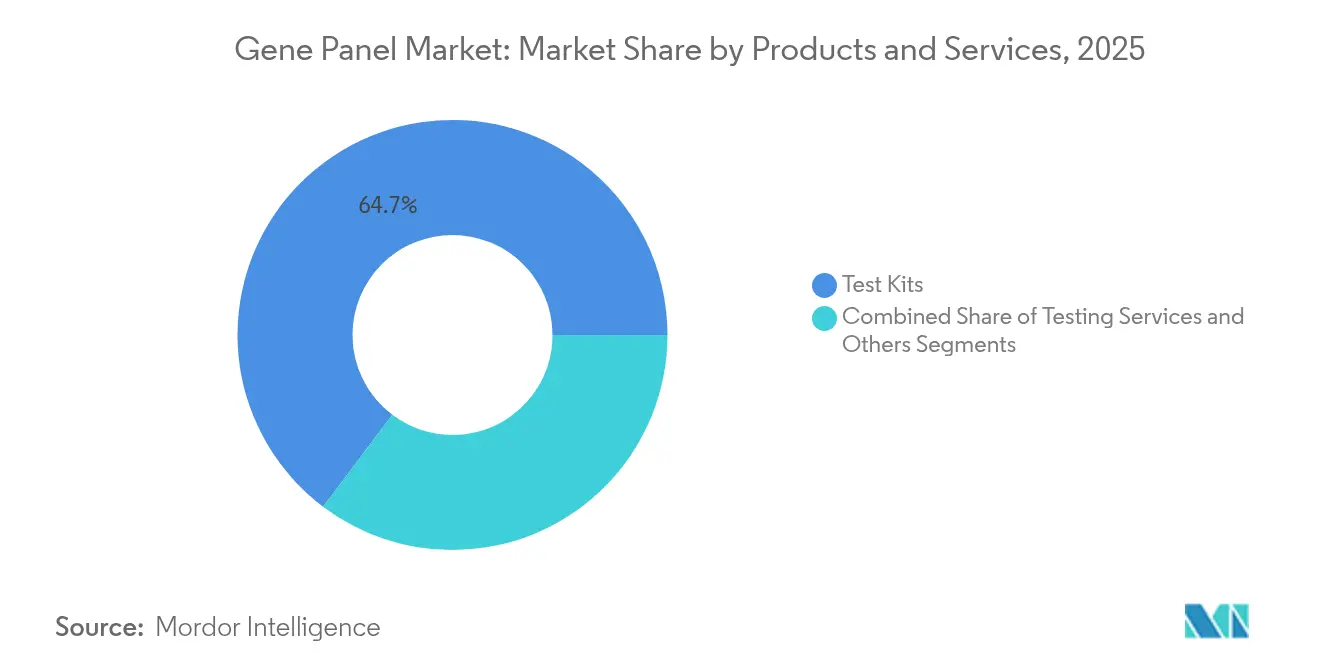
- By product category, Test Kits led with 64.72% revenue share in 2025; Testing Services are forecast to expand at a 16.55% CAGR through 2031.
- By technique, amplicon-based workflows held 61.55% of the gene panel market share in 2025, while hybridization capture approaches are poised to grow at 16.48% CAGR by 2031.
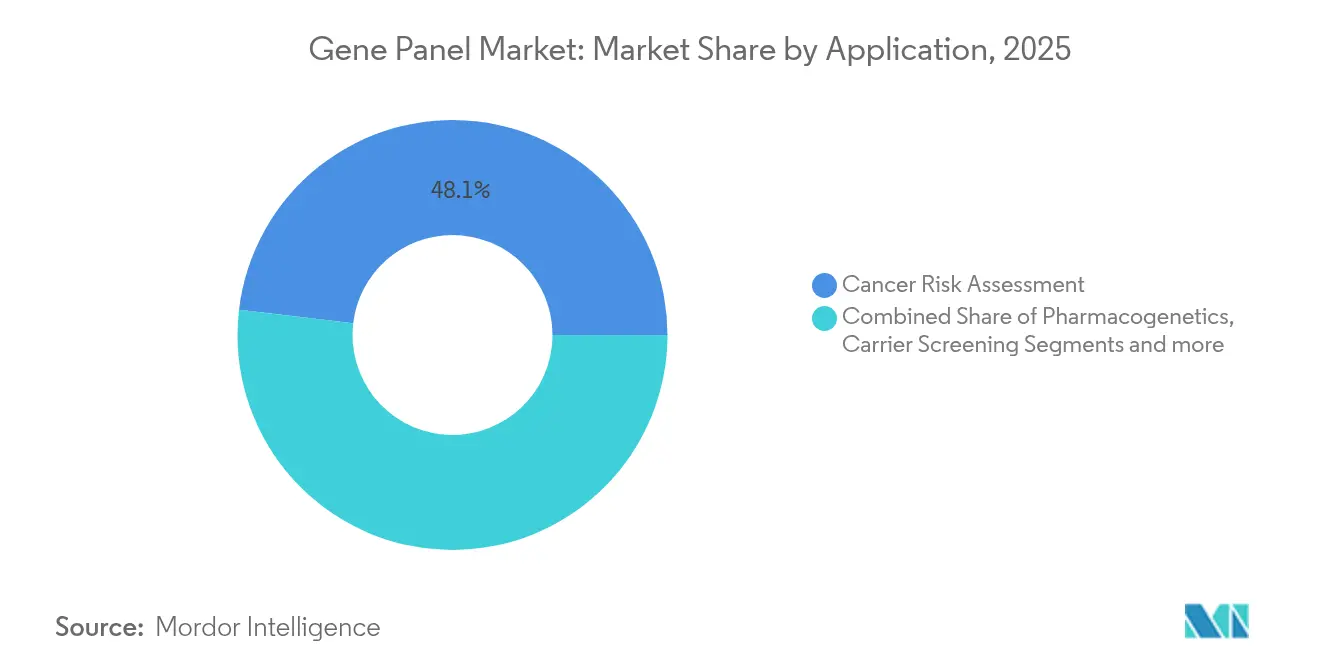
- By application, Cancer Risk Assessment accounted for 48.12% share of the gene panel market size in 2025 and Pharmacogenetics is set to rise at a 16.42% CAGR to 2031.
- By end user, Hospitals & Clinics captured 56.20% share in 2025; Diagnostic Laboratories are projected to advance at a 16.29% CAGR through 2031.
- By geography, North America commanded 42.10% revenue in 2025, while Asia-Pacific is forecast to expand at a 16.58% CAGR to 2031.
Note: Market size and forecast figures in this report are generated using Mordor Intelligence’s proprietary estimation framework, updated with the latest available data and insights as of 2026.
Market Trends and Insights
Drivers Impact Analysis of Gene Panel Market*
| Driver | (~) % Impact on CAGR Forecast | Geographic Relevance | Impact Timeline |
|---|---|---|---|
| Oncology-focused clinical adoption through broader NGS reimbursement | +3.2% | North America & Europe, expanding to Asia-Pacific | Medium term (2-4 years) |
| Rising prevalence of multi-gene pharmacogenomic labels in FDA approvals | +2.8% | Global | Long term (≥ 4 years) |
| Integration into newborn and carrier screening programs | +2.1% | Global, led by developed markets | Long term (≥ 4 years) |
| AI-powered interpretation tools cutting VUS rates and turnaround | +3.5% | Global, concentrated in high-volume labs | Short term (≤ 2 years) |
| Custom panel demand from decentralized sequencing labs | +1.9% | Asia-Pacific core, spill-over to Middle East & Africa | Medium term (2-4 years) |
| Population-scale genomic initiatives | +2.0% | National programs worldwide | Long term (≥ 4 years) |
| Source: Mordor Intelligence | |||
Accelerating Oncology-Focused Clinical Adoption Through NGS Reimbursement Expansion
Expanded payer coverage transforms oncology testing economics and speeds the shift from sequential single-gene assays to comprehensive panels. CMS Local Coverage Determination L37810 now covers advanced solid tumors, while Blue Cross Blue Shield networks codify medical-necessity criteria such as pre-test counseling and relevant family histories. Value-based care reimbursement aligns with upfront genomic profiling because early molecular stratification reduces downstream chemotherapy failures. Community oncology practices adopt panel testing as standard of care, shortening diagnostic odysseys and boosting targeted-therapy utilization. Laboratories leverage this demand spike by bundling tissue and blood-based assays, thereby enlarging the total order value per patient. The resulting volume gains reinforce economies of scale and lower the unit cost curve across the gene panel market.
AI-Powered Interpretation Tools Slashing VUS Rates and Turnaround Times
Artificial-intelligence engines digest millions of prior case variants and real-world outcomes, converting raw NGS data into concise clinical reports within hours. Invitae’s Clinical Variant Modeling lowered variants of uncertain significance by 24% for Lynch syndrome genes across 4 million samples [2]. QIAGEN’s QCI Interpret now handles 850,000 cases annually, delivering batch-level interpretation for high-throughput laboratories [3]. Early deployments show 30-50% reductions in report-generation labor and meaningful acceleration of patient management decisions. Academic consortia such as AI-MARRVEL demonstrate 98% precision in rare-disease variant classification, doubling diagnostic yields over traditional curation workflows. As AI models continue to learn from federated clinical repositories, algorithmic interpretation becomes a must-have differentiator across the gene panel market.
Increasing Prevalence of Multi-Gene Pharmacogenomic Labels in FDA Approvals
FDA labels referencing CPIC or PharmGKB pharmacogenomic guidance jumped sharply during 2024–2025 drug approvals, spanning cardiovascular, psychiatric, and oncology classes. The PREPARE study under the Department of Veterans Affairs showed a 30% cut in adverse drug reactions using a 12-gene panel before prescription. Medicare’s draft Local Coverage Determination requires panels to demonstrate actionability per CPIC tables, cementing coverage for multi-gene assays. Hospital antimicrobial stewardship programs incorporate pharmacogenomic alerts into electronic medical records, creating consistent test pull-through. Pharmaceutical sponsors co-develop companion diagnostics to derisk new-drug launches, fueling demand for analytically validated pharmacogenomic panels.
Wider Integration Into Newborn and Carrier Screening Programs
Sequencing costs abated at a 14% annual clip between 2021 and 2024, prompting policymakers to re-evaluate newborn screening menus. The U.S. Recommended Uniform Screening Panel now lists 35 conditions, with SMA reaching full state adoption in 2.1 years. China’s multicenter NGS newborn pilot confirmed feasibility for monogenic disorders, while India’s National Biobank Consortium earmarked funds for expanded carrier screening infrastructure. Pilot data show that broad panels identify risk variants in nearly 10% of couples pursuing assisted reproduction. Pay-for-performance incentives allow regional labs to bundle postpartum pharmacogenomic screening, generating recurring revenue streams within the gene panel market.
Restraints Impact Analysis of Gene Panel Market*
| Restraint | (~) % Impact on CAGR Forecast | Geographic Relevance | Impact Timeline |
|---|---|---|---|
| Bioinformatics workforce shortage | −2.3% | Global, acute in emerging markets | Medium term (2-4 years) |
| Data-sovereignty & cross-border restrictions | −1.8% | European Union, expanding to Asia-Pacific | Long term (≥ 4 years) |
| Payer push-back on hereditary panels with limited utility | −1.5% | North America & Europe | Medium term (2-4 years) |
| Supply-chain fragility for oligo and enzymes | −1.2% | Global, specialized manufacturing hubs | Short term (≤ 2 years) |
| Source: Mordor Intelligence | |||
Escalating Bioinformatics Workforce Shortage
Clinical labs confront a tight supply of accredited variant scientists as test complexity rises. Training pipelines lag behind job growth, with only 20 U.S. molecular genetics fellowship slots graduating annually. AI tools offset routine interpretation, but oversight roles still require certified professionals, creating bottlenecks in high-volume centers. African initiatives under H3Africa demonstrate similar gaps, prompting distance-learning programs for local researchers. Until broad upskilling closes the gap, turnaround-time gains from sequencing hardware will be capped, moderating expansion of the gene panel market.
Data Sovereignty and Cross-Border Transfer Restrictions
The European Health Data Space regulation permits secondary health-data use but demands explicit patient-level consent for cross-border transfers, raising compliance costs for multinational labs. Singapore’s Personal Data Protection Act imposes contractual clauses for genomic exports, while U.S. anti-China biotech bills tighten supply-chain scrutiny. These hurdles fragment global reference labs into regional silos, reducing dataset diversity and slowing AI model improvement. Consequently, test developers must stand-up in-country bioinformatics pipelines, inflating overhead and tempering the gene panel market’s scale benefits.
*Our forecasts treat driver/restraint impacts as directional, not additive. The impact forecasts reflect baseline growth, mix effects, and variable interactions.
Gene Panel Market Segment Analysis
By Products & Services:
Testing Services Drive Market EvolutionTesting Services revenue is on track for a 16.55% CAGR through 2031, reflecting laboratories’ pivot from kit sales toward bundled sequencing-plus-interpretation offerings. The gene panel market size for Testing Services is projected to climb as reimbursement and clinician familiarity encourage send-out testing. Multi-gene oncology panels anchor referral volumes, enabling labs to amortize infrastructure and cross-sell pharmacogenomic screening.
Test Kits remain foundational, holding 64.72% revenue share in 2025 because hospitals still value in-house control over sample flows. Yet as CLIA-certified labs like Labcorp integrate Invitae’s oncology assets, they gain the scale to undercut hospital lab costs while guaranteeing 10-day turnaround for complex cases. Bioinformatics-only subscriptions—classified in the Others segment—grow as laboratories license AI pipelines such as QIAGEN QCI Interpret to process legacy FASTQ files, opening an asset-light entry path for regional players.

By Technique:
Hybridization Capture Gains on Amplicon DominanceAmplicon-based methods generated 61.55% of total revenue, underpinned by rapid PCR amplification workflows suited to FFPE tissue and liquid biopsy applications. Nevertheless, hybridization capture systems will deliver a 16.48% CAGR to 2031, increasing their contribution as laboratories prioritize even coverage over speed for comprehensive genomic profiling.
The gene panel market share held by amplicon platforms erodes gradually because hybrid capture demonstrates lower GC-bias and superior detection of copy-number variants in high-throughput oncology testing. Vendors like Roche and QIAGEN commercialize ready-to-run capture panels for circulating tumor DNA, allowing community labs to deploy liquid biopsy with minimal validation. Enzymatic DNA synthesis, while nascent, promises longer oligo length and greener chemistry, setting the stage for custom panel manufacturing at scale and further reshaping technique preferences.
By Application:
Pharmacogenetics Accelerates Beyond Cancer Risk AssessmentCancer Risk Assessment retained 48.12% revenue share in 2025 thanks to well-established hereditary cancer pathways and universal BRCA testing guidelines. Yet Pharmacogenetics, is forecast to log the fastest 16.42% CAGR through 2031, lifting its share of the gene panel market size to nearly one-quarter. Hospital stewardship programs embed prescription alerts that automatically order pharmacogenomic panels before high-risk therapy initiation, normalizing routine testing.
Multi-gene drug-metabolism panels save payers treatment-failure costs, helping negotiate value-based reimbursement contracts. Congenital and rare-disease diagnosis advances in parallel, fueled by ultra-rapid whole-genome protocols that return results in 20 hours for NICU admissions. Population-scale preventive programs, from Vermont’s 431-gene voluntary adult screen to South Korea’s Welfare Genome pilot, demonstrate high participant uptake, broadening future test demand within the gene panel market.
By End User:
Diagnostic Laboratories Outpace Hospital GrowthHospitals and clinics generated 56.20% of spending in 2025, because embedded genetic counselors and on-site phlebotomy simplify testing logistics. Diagnostic laboratories, however, will compound at 16.29% annually through 2031 as they exploit scale economies across centralized sample intake, robotics, and AI interpretation pipelines.
Pharmaceutical and biotech companies raise demand for gene panels as companion diagnostics become prerequisites for market access. Agilent’s alliance with Incyte on hematology assays exemplifies co-development deals that lock specific panels into late-stage clinical trials. Research institutes leverage discounted panel pricing to sequence hundreds of thousands of samples for drug-target discovery, indirectly expanding the commercial installed base and cementing a service-oriented supply chain.
Geography Analysis
North America Gene Panel Market
North America contributed 42.10% of global revenue in 2025, buoyed by CMS coverage under National Coverage Determination 90.2 and private-payer parity laws. U.S. reference labs roll out tumor-agnostic panels paired with real-time prescription decision support, capturing recurrent monitoring orders. Canada trials pan-province pharmacogenomic reimbursement frameworks to mitigate adverse drug events, while Mexico’s national genomics consortium negotiates cross-border sample logistics and shared variant databases.
APAC Gene Panel Market
Asia-Pacific is the fastest growing geography with a 16.58% CAGR to 2031. China’s newborn sequencing pilots span more than 20 provincial hospitals, demonstrating cost per sample under USD 150 by pooling barcoded libraries. India’s GenomeIndia project seeds regional testing hubs and incentivizes private labs to meet a projected 12-million sample backlog by 2030. South Korea’s Welfare Genome Project links lifestyle coaching apps to sequencing results, increasing test completion rates and post-test engagement. Meanwhile, Japan’s national insurance funds 2 comprehensive cancer panels per patient lifetime, though rural access disparities persist due to specialist concentration in metropolitan centers.
EMEA Gene Panel Market
Europe posts steady adoption as the European Health Data Space clarifies secondary-use rights, albeit at the cost of stricter cross-border transfer compliance. Germany funnels de-identified genomic data into federally managed trusted research environments, catalyzing AI model training partnerships with health-tech start-ups. Switzerland mirrors Japanese reimbursement breadth but contends with patient-awareness gaps in non-urban cantons. Middle East and Africa remain latency markets; however, H3Africa builds local sequencing core facilities and distance-learning programs that nurture the talent base necessary for long-run gene panel market expansion.
Regulatory Landscape
Gene panel testing is governed by evolving in vitro diagnostics and clinical laboratory requirements that shape panel claims, reportable content, and evidence thresholds for reimbursement-aligned use. In the United States, CMS coverage for NGS in advanced cancer under National Coverage Determination (NCD) 90.2 continues to anchor payer pathways for oncology panels. In April 2026, the FDA added device-level clarity by classifying a setmelanotide eligibility gene variant detection system as a Class II device with special controls (21 CFR 862.1164), which reinforces expectations around analytical performance and labeling for targeted genetic tests.
Outside the US, requirements around companion diagnostics and genomic data handling add complexity to multinational gene-panel workflows. In the European Union, the In Vitro Diagnostic Regulation (IVDR) framework maintains EMA consultation requirements for companion diagnostics under Article 48, with transitional arrangements affecting how quickly legacy assays can be updated and re-certified. In China, oversight spans NMPA device review and human genetic resources controls for certain studies. In June 2026, NMPA-associated bodies (CDE/CMDE) issued guidance that includes technical review requirements for NGS-based tumor genetic variation detection reagents and reporting stratification, influencing panel design and the scope of variants laboratories can return to clinicians.
Competitive Landscape
The gene panel market features moderate fragmentation: platform leaders Illumina, Thermo Fisher, and Agilent anchoring sequencing chemistry, while service specialists such as Guardant Health, GeneDx, and QIAGEN scale proprietary interpretation software. Illumina’s NovaSeq X drives sub-USD 100 whole-genome sequencing economics, positioning the firm for expanded oncology and population-screening deals. Its partnership with Tempus AI extends into multimodal data integration, signaling a shift toward clinic-ready informatics pipelines.
Acquisition activity intensifies as incumbents buy informatics assets. Labcorp’s USD 239 million Invitae oncology purchase folds panel design, wet-lab operations, and electronic-medical-record integration into a single invoice, enhancing clinician stickiness. GeneDx pursues the same model via the USD 51 million Fabric Genomics bid, aiming to decentralize wet-lab operations while balancing interpretive oversight centrally.
Niche players chase white-space in population genomics and prenatal screens. Guardant Health launched a blood-based hereditary test covering 82 genes, compressing phlebotomy-to-report timelines. Start-ups building enzymatic DNA-synthesis platforms promise greener reagent supply chains and rapid custom-panel cycle times, threatening incumbent oligonucleotide manufacturers. As scale advantages accrue, the combined market share of the top five providers is estimated near 55%, leaving room for innovative entrants yet nudging the structure toward oligopolistic rivalry within the gene panel market.
Gene Panel Industry Leaders
-
Illumina, Inc.
-
Agilent Technologies, Inc.
-
Thermo Fisher Scientific
-
QIAGEN
-
Danaher Corporation
- *Disclaimer: Major Players sorted in no particular order
Gene Panel Market Companies Covered in this Report
- Illumina
- Thermo Fisher Scientific
- Agilent Technologies
- QIAGEN
- Roche
- Danaher
- BGI
- Eurofins
- Novogene Co.
- Guardant Health
- Invitae
- Myriad Genetics
- Color Genomics
- Twist Bioscience
- ArcherDX (Invitae)
- Sophia Genetics
- Personalis Inc.
- Helix OpCo
- Geneseeq Technology
- GENEWIZ (Azenta)
Market Opportunities and Future Outlook
Near-term whitespace is building in end-to-end workflows that deliver faster turnaround and reduce operational barriers for hospitals and decentralized labs, with particular traction in oncology profiling and MRD-adjacent longitudinal use cases. FDA actions and vendor roadmaps support this shift. In May 2026, Tempus received FDA approval for a tumor-only indication for its xT CDx NGS platform, allowing testing without matched normal samples and widening the patient and care settings that can operationalize comprehensive profiling. At the same time, kit and informatics vendors are packaging components to cut hands-on time and interpretation friction, including Integrated DNA Technologies (IDT) outlining an NGS innovation roadmap in February 2026 across library preparation and hybridization capture elements for cancer research workflows.
Guideline and payer criteria are also opening clearer pockets of demand for multigene panels, where medical-necessity documentation is more straightforward, which can support higher testing consistency and repeat ordering. Carelon Medical Benefits Management updated hereditary cancer testing guidelines in April 2026 (with additional 2026 updates referenced in the evidence pack). In May 2026, the Japanese Society for Hereditary Tumors issued multigene panel testing guidance. Together, these developments reinforce clinical criteria and use cases across germline risk assessment, prognosis support, and treatment optimization, and they favor suppliers that can bundle panel content, validated bioinformatics, and report-ready clinical interpretation while meeting data-sovereignty and cross-border transfer constraints through regionalized analytics and compliant data handling.
Recent Industry Developments in Gene Panel Market
- June 2026: Illumina released Connected Insights 5.4 with expanded reporting automation and longitudinal features for minimal residual disease research workflows. The update improves software-led differentiation around interpretation and follow-up reporting, supporting labs that want integrated secondary analysis alongside targeted panel testing.
- May 2026: Illumina and SPT Labtech introduced the fireflyGO automation platform for targeted oncology research, designed to integrate with the MiSeq i100 Series. The release advances end-to-end workflow automation around panel-based sequencing by reducing hands-on steps and standardizing sample-to-data processes.
- April 2025: GeneDx agreed to acquire Fabric Genomics for up to USD 51 million to combine AI-driven interpretation with decentralized sequencing models. The deal deepens vertical integration in clinical genomics services, increasing competitive pressure on standalone panel providers that lack interpretation scale.
Gene Panel Market Report Scope and Research Methodology
Market Definition and Coverage
For this study, the gene panel market covers revenue generated from multi-gene testing panels that analyze a predefined set of genes using sequencing workflows, along with the associated testing service value when it is bundled with the panel offering.
Scope exclusions: Single gene tests, whole genome sequencing, whole exome sequencing, and stand-alone bioinformatics software sold without a panel testing component are excluded.
Segments Covered in This Report
- By Products and Services
- Test Kits
- Testing Services
- Others
- By Technique
- Amplicon-Based
- Hybridization Capture
- Others
- By Application
- Cancer Risk Assessment
- Pharmacogenetics
- Congenital & Rare Disorders Diagnosis
- Carrier Screening
- Others
- By End User
- Hospitals and Clinics
- Diagnostic Laboratories
- Pharmaceutical & Biotech Companies
- Others
- By Geography
- North America
- United States
- Canada
- Mexico
- Europe
- Germany
- United Kingdom
- France
- Italy
- Spain
- Rest of Europe
- Asia-Pacific
- China
- Japan
- India
- Australia
- South Korea
- Rest of Asia-Pacific
- Middle East and Africa
- GCC
- South Africa
- Rest of Middle East and Africa
- South America
- Brazil
- Argentina
- Rest of South America
- North America
Data Sources, Market Sizing, and Validation
Desk Research
Desk research was used to set the groundwork on how gene panels are being adopted and paid for, and to capture the main demand signals across oncology and inherited disease testing. We relied on public, official sources such as the US FDA (test authorizations and safety notices), the US National Institutes of Health and NCBI (clinical genetics references), the US National Library of Medicine for peer-reviewed studies, and the Centers for Medicare and Medicaid Services coverage and reimbursement materials.
To keep the model practical, we also reviewed items such as company filings and investor decks, laboratory accreditation and guideline pages, and healthcare press that tracks test launches and partnerships. Where available, paid subscription data for company financials and intelligence and a patent database were used to confirm product footprints and to cross-check activity levels in panel development. The desk sources listed are illustrative only, and many other public references were used for data collection, validation, and clarification.
Primary Interviews and Surveys
Primary work focused on conversations and surveys with clinical laboratory leaders, hospital lab managers, assay development teams, and procurement and reimbursement focused roles that influence panel selection and usage. We used these inputs to sanity check testing volumes, typical panel pricing ranges, average update cycles for panels, and the split between in-house testing and reference lab send-outs across major regions.
Distribution of primary research fieldwork respondents
| Company type | Respondent position | Region |
|---|---|---|
| Top tier: 30% | CXOs: 13% | APAC: 44% |
| Mid tier: 56% | Functional/Unit leaders: 34% | EMEA: 35% |
| Smaller Players: 14% | Managers: 53% | Americas: 21% |
Market-Sizing & Forecasting
Sizing started with a top-down build where diagnostic testing demand pools were reconstructed from disease incidence patterns, testing guideline intensity, and lab throughput capacity trends, which were then converted into gene panel volumes by application. To keep the totals realistic, we corroborated the output using selective bottom-up approximations like sampled test menu counts, typical tests per lab per week, and an average selling price range for small and large panels, followed by adjustments where the two views did not line up.
Key inputs that shaped the model included the share of oncology testing that uses multi-gene panels, the mix of targeted panels versus broader profiling, typical reimbursement levels and out-of-pocket sensitivity, panel refresh cycles (how often content is updated), and the rate of adoption in hospital labs versus independent clinical labs. Forecasting relied mainly on scenario analysis supported by expert consensus, since coverage decisions and clinical guideline changes can shift adoption quickly. Where bottom-up signals were thin for smaller countries, we used proxy indicators such as diagnostic spend growth and regional lab capacity expansion before final checks were applied.
Data Validation & Update Cycle
Validation was done by comparing outputs against independent signals such as published testing volumes in key disease areas, reimbursement schedule movements, and observed panel price ranges discussed by respondents. If a country-level result looked out of line with these checks, the assumptions were revisited and, when needed, a follow-up conversation was triggered to confirm what changed.
Before sign-off, results are reviewed in steps, starting with analyst-level variance checks and moving to a second pass that tests whether growth drivers and restraints are being reflected consistently in the numbers. The report is refreshed annually, and interim updates are made when material events occur, such as major coverage revisions or step changes in test adoption. Right before delivery, we run a final sweep to ensure the model reflects the latest available public signals and validated assumptions.
Mordor Intelligence's Gene Panel Market Estimate Compared With Other Published Estimates
Published market sizes for gene panels often do not match because different studies count different things and they anchor their math to different demand signals. Common differences show up in whether testing services are bundled with panel revenue, how pricing is averaged across regions, and which clinical applications are treated as core demand.
The largest gaps usually come from scope and pricing logic. Some estimates fold in broader genetic testing or apply aggressive price uplifts without tying them to reimbursement timing and lab purchasing behavior. When the model is anchored to panel level demand drivers, and then stress tested against lab capacity and coverage signals, the spread narrows and the assumptions become easier to explain to clients.
Benchmark comparison
| Source | Market Size | Gaps in Research Methodology |
|---|---|---|
| Mordor Intelligence | USD 3.85 B (2026) | |
| Global Consultancy A | USD 4.12 B (2024) | Uses a 2024 base year with a broader product and service frame, and the uplift to future years is less clearly tied to reimbursement timing and panel refresh cycles, which can move pricing and volumes unevenly by region. |
| Industry Publisher B | USD 1.40 B (2024) | Appears to apply a narrower revenue lens that can undercount bundled testing services and may rely on limited disclosed revenues, which can miss usage in hospital labs and smaller regional reference labs. |
The table shows that year selection and what gets counted as panel value explain much of the spread, which becomes more visible once services and application coverage are made explicit. By separating panel driven testing demand from broader genetic testing categories and cross-checking pricing with reimbursement and lab throughput signals, the final total stays traceable to practical inputs, a modeling choice applied by Mordor Intelligence.
Key Questions Answered in the Report
What is the current value of the gene panel market?
The market is valued at USD 3.85 billion in 2026 and is forecast to reach USD 8.04 billion by 2031.
Which region is growing fastest for gene panel testing?
Asia-Pacific shows the quickest expansion with a projected 16.58% CAGR through 2031, driven by large-scale programs in China and India.
Why are hybridization capture techniques gaining traction?
They deliver more uniform coverage and better detection of complex variants, helping laboratories meet stringent quality metrics for comprehensive cancer panels.
How is AI changing gene panel interpretation?
AI reduces variants of uncertain significance, cuts reporting times, and scales analysis to hundreds of thousands of samples per year, boosting laboratory efficiency.
What factors limit wider adoption of gene panels?
Key hurdles include bioinformatics workforce shortages, data-sovereignty rules governing cross-border genomic data, and payer skepticism toward large hereditary panels with uncertain clinical utility.
Which application segment is projected to grow the fastest?
Pharmacogenetics leads with a 16.42% CAGR as FDA drug labels increasingly require multi-gene guidance for optimal therapy selection.