Gene Therapy Market Size and Share
Market Overview
| Study Period | 2020 - 2031 |
|---|---|
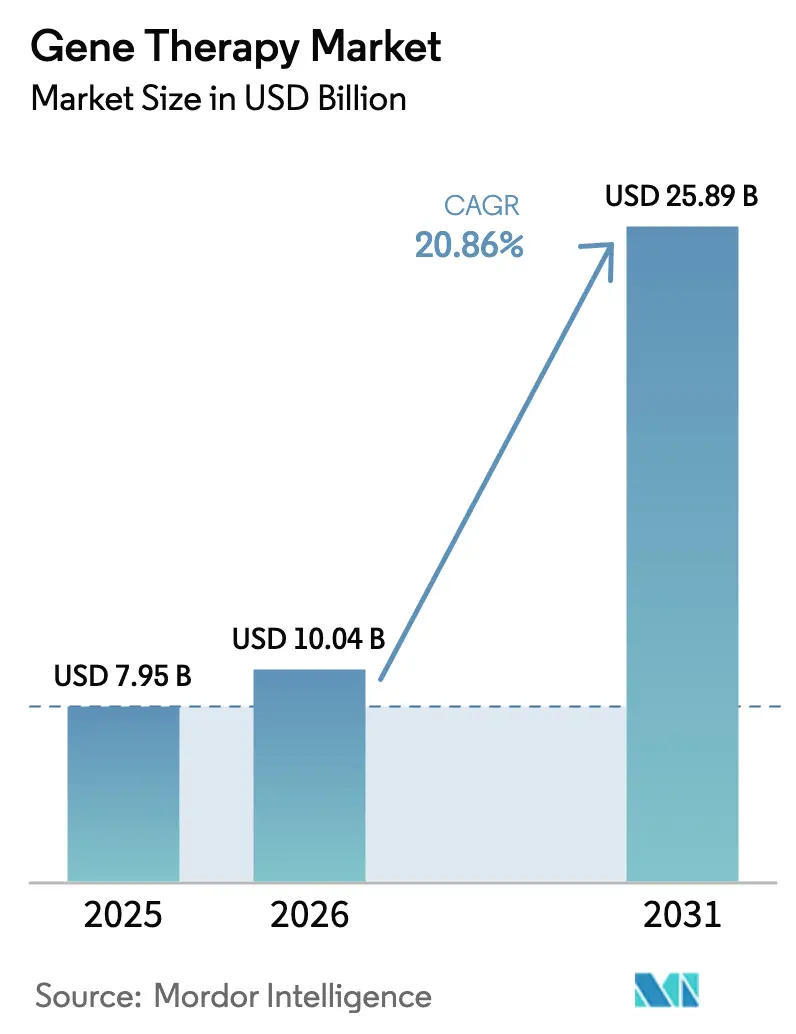
| Market Size (2026) | USD 10.04 Billion |
| Market Size (2031) | USD 25.89 Billion |
| Growth Rate (2026 - 2031) | 20.86% CAGR |
| Fastest Growing Market | Asia Pacific |
| Largest Market | North America |
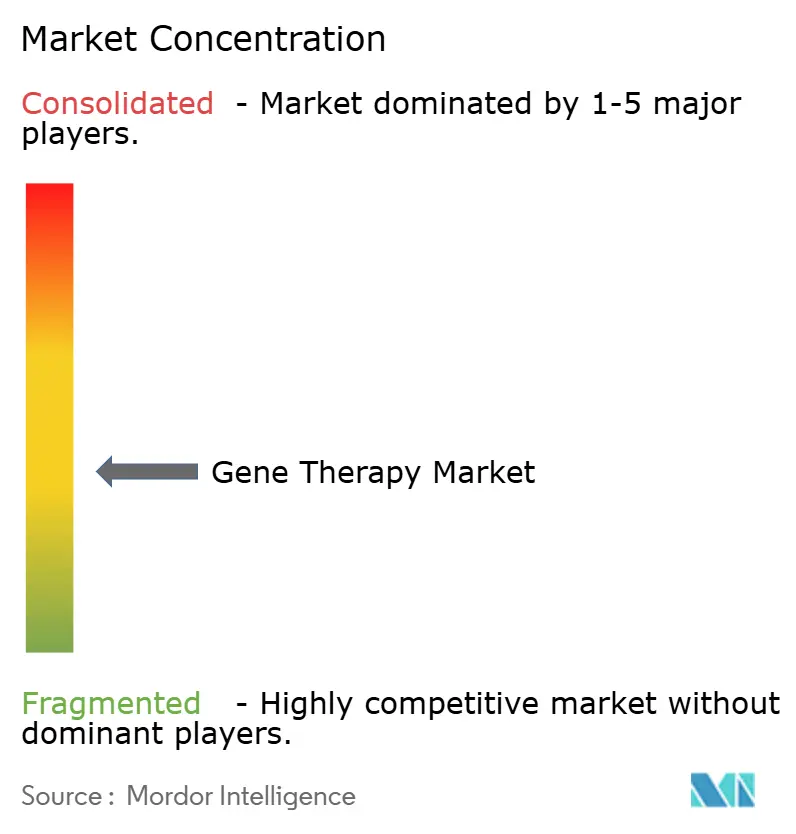
| Market Concentration | Medium |
Major Players *Disclaimer: Major Players sorted in no particular order Image © Mordor Intelligence. Reuse requires attribution under CC BY 4.0. | |
Gene Therapy Market Analysis by Mordor Intelligence
The Gene Therapy Market size was valued at USD 7.95 billion in 2025 and is estimated to grow from USD 10.04 billion in 2026 to reach USD 25.89 billion by 2031, at a CAGR of 20.86% during the forecast period (2026-2031).
Accelerating one-time curative approvals, outcomes-based reimbursement models, and platform manufacturing efficiencies are transforming gene therapy from an experimental modality into a commercially scalable treatment class. Payer reluctance is easing as real-world evidence shows durable benefit, while standardized adeno-associated virus (AAV) and lentivirus (LV) processes are compressing production timelines by up to 50%, supporting higher batch success rates. Venture investors have shifted toward late-stage assets, reducing development risk and directing capital toward assets with nearer-term revenue potential. Meanwhile, non-viral lipid nanoparticle systems are maturing, setting up cross-platform competition that could further expand therapeutic reach. Intellectual property competition around engineered capsids and editing payloads is intensifying, as more than 500 novel AAV capsid patents were filed between 2020 and 2024, signaling a decisive scramble for delivery leadership.
Key Report Takeaways
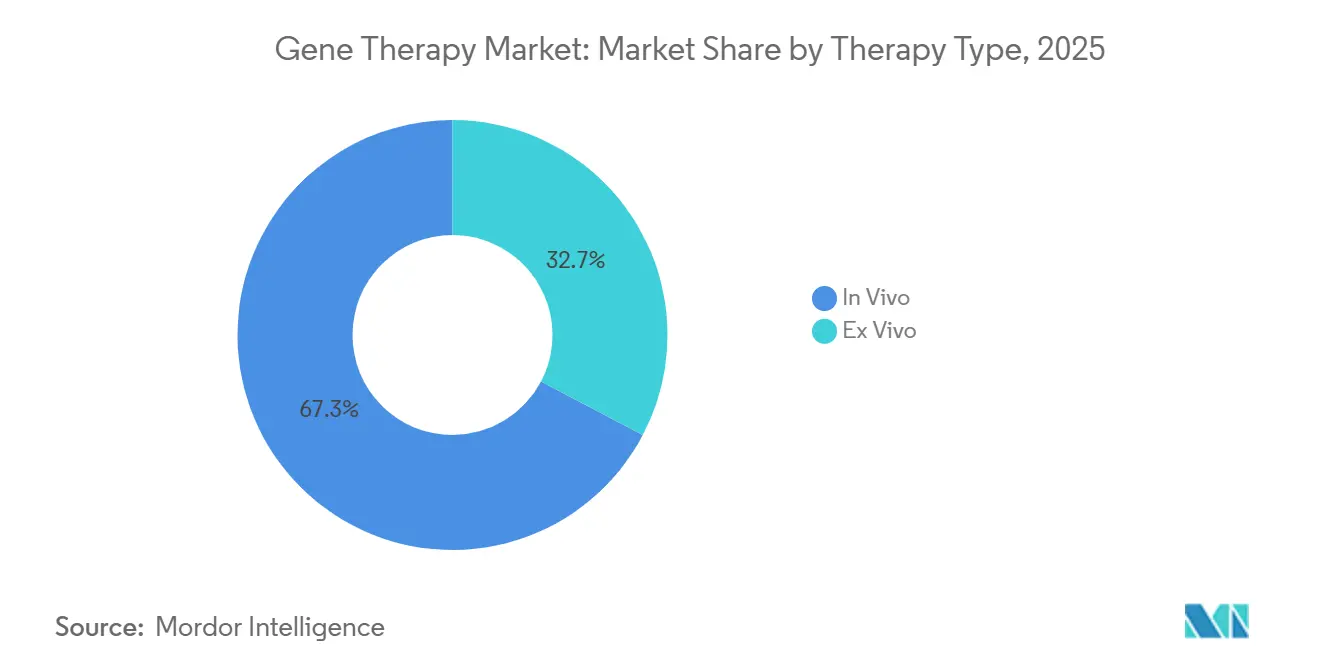
- By therapy type, in vivo approaches led with 67.31% revenue share in 2025, while ex vivo posted the fastest 21.97% CAGR outlook to 2031.
- By vector type, viral vectors commanded 74.83% of the gene therapy market share in 2025; however, non-viral systems are forecasted to expand at a 23.41% CAGR through 2031.
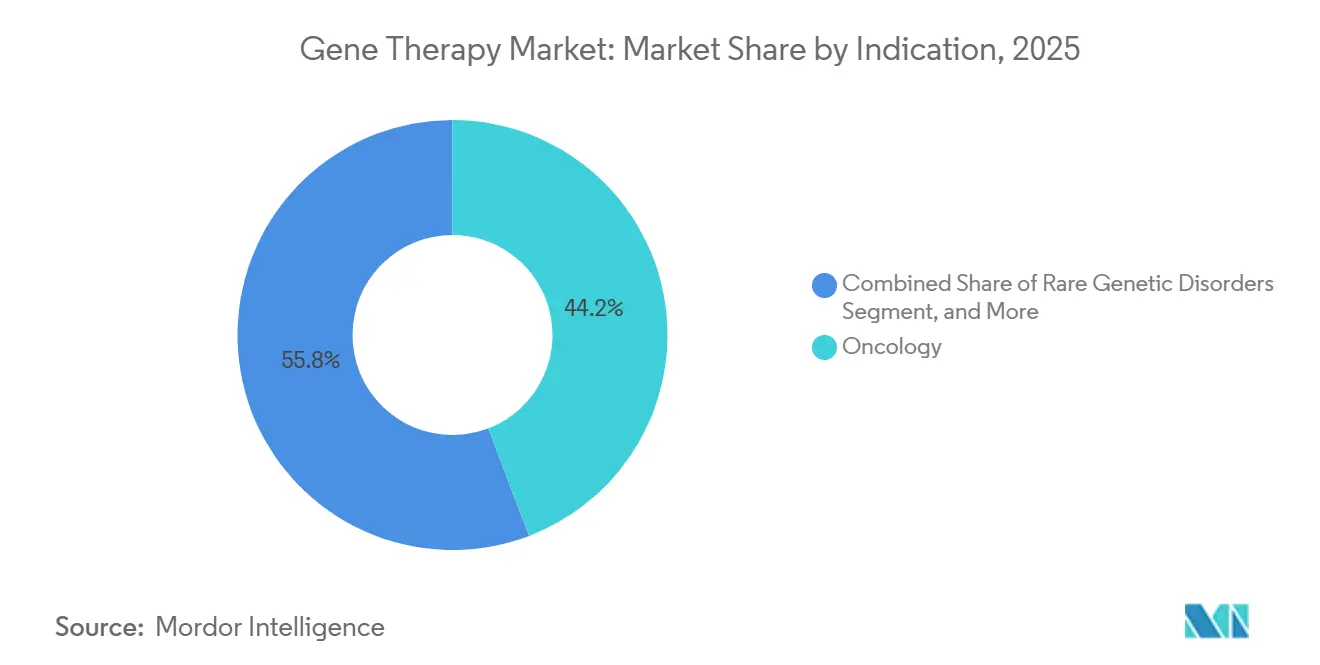
- By indication, oncology generated 44.15% of 2025 revenue, whereas neurology applications are advancing at a 22.71% CAGR toward 2031.
- By delivery method, systemic administration accounted for 46.36% of 2025 sales, while localized routes are projected to grow at 25.18% through 2031.
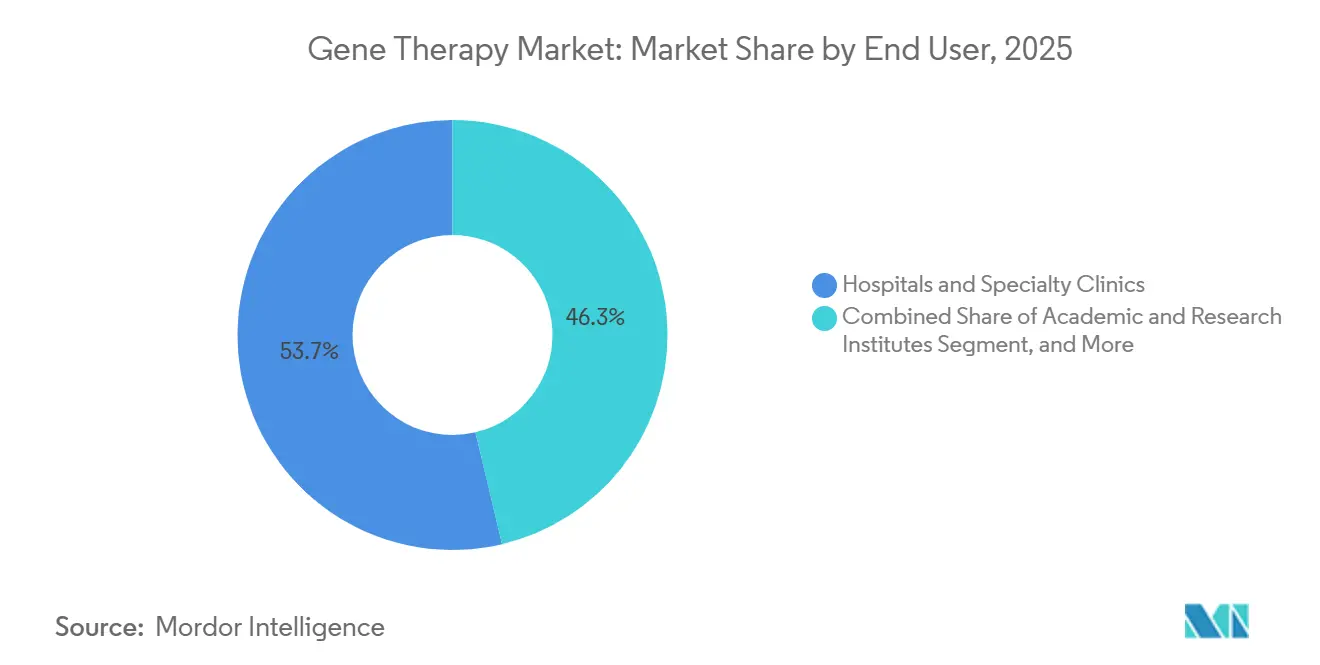
- By end user, hospitals and specialty clinics accounted for 53.66% of revenue in 2025, while academic and research institutes are on track for a 26.64% CAGR through 2031.
- By geography, North America retained 41.36% of 2025 value, yet Asia-Pacific is poised for the highest 28.78% CAGR between 2026 and 2031.
Note: Market size and forecast figures in this report are generated using Mordor Intelligence’s proprietary estimation framework, updated with the latest available data and insights as of January 2026.
Market Trends and Insights
Drivers Impact Analysis of Gene Therapy Market*
| Driver | (~) % Impact on CAGR Forecast | Geographic Relevance | Impact Timeline |
|---|---|---|---|
| Surge in Approvals of One-Shot Curative Therapies | +5.2% | Global, with North America and Europe leading | Medium term (2-4 years) |
| Expanding Reimbursement for Ultra-Rare Disorders | +4.8% | North America, selective EU markets, emerging in Asia-Pacific | Medium term (2-4 years) |
| Manufacturing Platform Standardisation (AAV & LV) | +4.1% | Global, concentrated in North America, Europe, and East Asia manufacturing hubs | Long term (≥ 4 years) |
| Growing Venture & SPAC Funding Pipelines | +2.9% | North America and Europe, spillover to Israel and Singapore | Short term (≤ 2 years) |
| CRISPR-Based In Vivo Editing Breakthroughs | +3.6% | Global, with clinical leadership in US, UK, and Switzerland | Medium term (2-4 years) |
| Growing Inclusion of Rare-Disease Gene Therapies | +2.7% | Global, with strong regulatory support in North America, EU, and Japan | Medium term (2-4 years) |
| Source: Mordor Intelligence | |||


Surge in Approvals of One-Shot Curative Therapies
Regulators accelerated timelines in 2024-2025, clearing therapies such as Waskyra for Wiskott-Aldrich syndrome, Itvisma for spinal muscular atrophy, and Casgevy for sickle-cell disease under priority pathways.[1]U.S. Food and Drug Administration, “Approved Cellular and Gene Therapy Products,” fda.gov Clinical datasets underpinning these decisions demonstrate durable efficacy, with Casgevy keeping 93.5% of patients crisis-free over 12 months and Beqvez maintaining greater than 40% factor IX activity, thereby eliminating the need for hemophilia B prophylaxis. Payers acknowledge that one-time interventions can offset decades of chronic-care costs, triggering recalibrated budget models. Japan’s Sakigake pathway extension to gene therapy underscores the broader alignment in the Asia-Pacific region, reinforcing the global shift toward curative paradigms.
Expanding Reimbursement for Ultra-Rare Disorders
Outcomes-based models now govern roughly 40% of U.S. commercial contracts, and CMS’s Cell and Gene Therapy Access Model covers 35 Medicaid programs, sharing financial risk with manufacturers.[2]Centers for Medicare & Medicaid Services, “Cell and Gene Therapy Access Model,” cms.gov Europe remains fragmented but is experimenting with installment payments, as France’s HAS spreads Zolgensma’s USD 2.1 million cost over five years. U.S. forecasts from the Congressional Budget Office indicate that sickle-cell therapies alone could generate USD 1.8 billion in annual Medicaid expenditures by 2028, prompting legislatures to develop pooled-purchase solutions. Registry data from real-world Zolgensma use indicate that 95% of treated children retain motor milestones at a five-year follow-up, reinforcing the value of pay-for-performance schemes.
Manufacturing Platform Standardization (AAV & LV)
Lonza’s USD 1 billion Portsmouth facility and Catalent’s USD 675 million Harmans expansion are purpose-built for modular bioreactors ranging from 50 to 2,000 liters, which can pivot across multiple campaigns without requiring process transfer.[3]Lonza, “Lonza Announces USD1 Billion Portsmouth Facility,” lonza.com MilliporeSigma’s AAV-MAX system cuts upstream costs in half by eliminating adherent culture requirements, while Viralgen’s Pro10™ platform reduced batch-failure rates to below 5% across 1,500 runs. Samsung Biologics is adding Asia-Pacific’s first large-scale AAV plant, foreshadowing a geographically diversified supply chain. The 2024 joint FDA-EMA guidance on AAV analytics harmonizes release testing, directly reducing duplicated validation costs.
Growing Venture & SPAC Funding Pipelines
Venture investors deployed USD 3.2 billion in 2024, with 70% of the funds allocated to Phase 2+ assets, indicating a higher demand for clinical de-risking. Prime Medicine’s USD 315 million Series C and Tome Biosciences’ USD 213 million Series A exemplify oversized bets on differentiated editing. SPAC activity declined in 2024-2025 as public markets prioritized revenue visibility; however, corporate venture arms such as Novo Holdings and Takeda Ventures remained active, bringing regulatory and CMC expertise alongside capital.
Restraints Impact Analysis of Gene Therapy Market*
| Restraint | (~) % Impact on CAGR Forecast | Geographic Relevance | Impact Timeline |
|---|---|---|---|
| High COGS and Six-Figure Price Backlash | -3.7% | Global, acute in Europe and emerging markets | Medium term (2-4 years) |
| Complex Long-Term Safety Monitoring Mandates | -2.4% | Global, most stringent in North America and EU | Long term (≥ 4 years) |
| Global Viral-Vector Capacity Bottlenecks | -2.8% | Global, concentrated impact in North America and Europe manufacturing hubs | Short term (≤ 2 years) |
| Emerging Patent Thickets on Gene-Editing Payloads | -1.9% | Global, most acute in North America and Europe with spillover to Asia-Pacific | Medium term (2-4 years) |
| Source: Mordor Intelligence | |||
High COGS and Six-Figure Price Backlash
Viral-vector batches cost USD 500,000–2 million, driving list prices such as Lenmeldy’s USD 4.25 million, provoking U.S. Senate Finance hearings and NICE rejections under GBP 100,000/QALY thresholds. Yield variability ranging from 30% to 70% per campaign forces overproduction and write-offs. Continuous-manufacturing pilots by Resilience and Fujifilm Diosynth promise a 50% cost reduction but will not reach commercial scale meaningfully before 2027. Bluebird’s 2024 withdrawal of Zynteglo from the EU, following reimbursement failures, illustrates the existential risk posed by HTA bodies' reluctance to accept prices.
Complex Long-Term Safety Monitoring Mandates
The FDA requires 15-year patient surveillance for integrating vectors, including annual to triennial visits, plus hematologic malignancy screening, which costs smaller firms USD 5-10 million per year. EMA’s risk plans further extend the burden until full marketing authorization is achieved, thereby delaying breakeven timelines. Zolgensma’s REMS and Lyfgenia’s leukemia monitoring illustrate the multi-decade post-market commitments that strain single-asset developers. ASGCT’s voluntary registry initiative could centralize data but lacks universal participation.
*Our forecasts treat driver/restraint impacts as directional, not additive. The impact forecasts reflect baseline growth, mix effects, and variable interactions.
Gene Therapy Market Segment Analysis
By Therapy Type:
Ex Vivo Platforms Accelerate on Allogeneic PotentialThe gene therapy market size for in vivo approaches accounted for 67.31% of the revenue in 2025, reflecting its dominance in liver and systemic applications. Ex vivo therapies accounted for the remainder but are projected to outpace the market at a 21.97% CAGR, fueled by CRISPR-enabled allogeneic CAR-T designs that bypass autologous bottlenecks. Allogene and CRISPR Therapeutics advanced Phase 2 trials in 2024, demonstrating rapid 14-day vein-to-vein workflows. FDA draft CMC guidance clarified batch testing and donor-screening criteria, reducing regulatory ambiguity.
Adoption hinges on cost-effective point-of-care manufacturing. Lonza and Miltenyi Biotec piloted mobile clean rooms in 2024 that slash per-dose costs by 40%, positioning hospital sites as micro-factories. In vivo programs still encounter immunogenicity; up to 50% of candidates possess neutralizing antibodies, prompting the development of engineered capsids. Neurodegenerative disorders, led by uniQure’s AMT-130, show promise where ex vivo is impractical, keeping therapeutic diversity high.


By Vector Type:
Non-Viral Systems Close Efficacy GapsViral platforms generated 74.83% of 2025 revenue, anchored by AAV’s hepatocyte tropism and LV’s integration for hematologic disorders. Non-viral vectors are expected to expand at a 23.41% CAGR, narrowing the gap through optimized lipid nanoparticles that delivered 40%-60% editing rates in Moderna and BioNTech preclinical models. MaxCyte’s electroporation supports 50+ clinical trials, offering transient expression suitable for ex vivo editing.
Within viral categories, engineered AAV-PHP.B capsids entered first-in-human studies for Parkinson’s disease, highlighting next-generation tropism for CNS delivery. Touchlight’s enzymatic DNA competes as a plasmid alternative that avoids bacterial contaminants, broadening non-viral options. The FDA non-viral guidance standardized quality expectations, aligning oversight with irreversible editing risk rather than vector category.
By Indication:
Neurology Gains MomentumOncology’s 44.15% contribution in 2025 is expected to continue as CAR-Ts advance into earlier-line settings, with Carvykti achieving 73% complete responses in multiple myeloma. However, neurology indications are forecast to grow at a 22.71% CAGR as intrathecal AAV delivery bypasses the blood-brain barrier. Successes include uniQure’s 79% huntingtin-protein knockdown and Neurocrine’s GBA1 Parkinson’s program. Ophthalmology remains a profitable niche thanks to the eye’s immune privilege, with Luxturna’s five-year durability data reinforcing payer confidence.
Rare genetic disorders continue to receive regulatory priority, with Waskyra and Itvisma obtaining approvals in 2025. Hematology stays competitive; eight hemophilia assets in late-stage development may squeeze pricing power, motivating differentiation through lower vector doses or outpatient administration settings.
By Delivery Method:
Localized Administration EscalatesSystemic infusion represented 46.36% of revenue in 2025, but localized delivery is on a 25.18% CAGR trajectory. Intrathecal approaches require one-tenth the vector dose for spinal muscular atrophy, lowering immunogenic risk. Subretinal surgical protocols standardized by Luxturna are now in operation across 150 U.S. centers, ensuring reproducible outcomes. Intravitreal delivery is under evaluation for wet AMD, potentially reducing monthly anti-VEGF injections to annual schedules. Systemic regimens still dominate hepatocyte editing but face exclusion due to the development of neutralizing antibodies, prompting ongoing redesign of the capsid.
By End User:
Academic Institutes Propel Early InnovationHospitals and specialty clinics captured 53.66% of 2025 revenue, functioning as commercial administration hubs equipped with GMP apheresis suites. Academic institutes, holding a smaller base, show a 26.64% CAGR, as 60% of active trials originate from investigator-initiated protocols. European Reference Networks exemplify cross-border harmonization, pooling cases of rare diseases for higher-powered studies. Hospital investments such as Massachusetts General’s USD 50 million cell-processing plant enhance domestic manufacturing, supporting decentralized point-of-care production.
Geography Analysis
North America Gene Therapy Market
North America maintained 41.36% of 2025 revenue, supported by 45 new RMAT designations and the CMS Access Model easing Medicaid barriers. Capacity built by Lonza, Catalent, and Resilience totaled 1.2 million liters of bioreactors, cementing the region’s supply dominance. Outcomes-based contracts now cover 40% of U.S. therapies, as exemplified by Lyfgenia’s coverage for 100 million lives. Canada trails with only two approvals in 2024, due to protracted provincial reimbursement negotiations.
APAC Gene Therapy Market
The Asia-Pacific region, projected to grow at a 28.78% CAGR, is driven by China’s NMPA approvals of Roctavian and Yescarta, as well as over 200 active clinical trials. WuXi AppTec’s plasmid facility and Samsung’s AAV plant diversify global manufacturing. Japan’s PMDA extended Sakigake's fast-track to gene therapy, and India green-lit its first CAR-T at one-tenth the U.S. price, showcasing cost innovation. Australia approved Casgevy but faces delays in reimbursement.
EMEA and South America Gene Therapy Market
Europe grapples with fragmented HTA systems. Bluebird’s Zynteglo exit following reimbursement failures exemplifies the commercial risk associated with EMA approval. Germany’s IQWiG positive Hemgenix assessment and France’s installment payments for Zolgensma are isolated wins. EUnetHTA’s 2025 joint assessments aim to harmonize evidence, yet national payers still control pricing. The Middle East & Africa, as well as South America, remain nascent but are developing regulatory frameworks, with the UAE and Brazil approving select therapies for compassionate or public hospital use.


Competitive Landscape
The gene therapy industry remains moderately fragmented; Novartis, Gilead, and Bristol Myers Squibb together generated high value from CAR-T franchises in 2024. Vertically integrated majors continue to expand their plants, whereas platform biotechs license capsids or editors more broadly. Pfizer’s Beam takeover and Novartis’s Voyager acquisition highlight consolidation around differentiated delivery technologies.
Competitive thrust in CNS disorders involves fewer than 10 late-stage candidates, leaving unmet-need white space for innovators with BBB-penetrating capsids. Allogeneic CAR-T players, such as CRISPR Therapeutics, Allogene, and Cellectis, could disrupt autologous incumbents if Phase 3 data confirm comparable efficacy and safety. Patents drive strategic alliances; the over 500 AAV capsid filings since 2020 pressure entrants to negotiate licenses or risk litigation.
Non-viral specialists Moderna, BioNTech, and Intellia leverage lipid nanoparticle know-how from mRNA vaccines to deliver editing payloads, achieving 40%-60% liver editing in preclinical models. Technology differentiation, particularly in terms of promoter selection, payload size, and organ tropism, will likely dictate deal flow and valuation more than sheer pipeline count.
Gene Therapy Industry Leaders
Amgen Inc.
Novartis AG
bluebird bio Inc.
Biogen Inc.
Gilead Sciences Inc.
- *Disclaimer: Major Players sorted in no particular order
Gene Therapy Market Companies Covered in this Report
- Amgen
- Beam Therapeutics
- bluebird bio Inc.
- Bristol-Myers Squibb
- Biogen
- CRISPR Therapeutic
- Editas Medicine
- Freeline Therapeutics
- Gilead Sciences
- Intellia Therapeutics
- LogicBio Therapeutics
- MeiraGTx
- Mustang Bio
- Novartis
- Orchard Therapeutics
- Passage Bio
- Pfizer
- Regenxbio
- Sangamo Therapeutics
- Sarepta Therapeutics
- Spark Therapeutics
- Takeda Pharmaceuticals
- uniQure N.V.
- ViGeneron

Recent Industry Developments in Gene Therapy Market
- May 2025: Japan's MHLW approved Sarepta Therapeutics' ELEVIDYS (delandistrogene moxeparvovec-rokl), a one-time AAV gene therapy for Duchenne muscular dystrophy in children aged 3–7 without specific DMD gene deletions and negative for anti-AAVrh74 antibodies. Granted under conditional approval and backed by Phase 3 EMBARK data, this is the world's first approval covering children under 4, with Chugai and Roche handling commercialization.
- May 2025: Abeona Therapeutics received FDA approval for ZEVASKYN (prademagene-zamifermin), the first autologous cell-based gene therapy for recessive dystrophic epidermolysis bullosa wounds in adults and children. Phase 3 VIITAL results demonstrated durable wound healing and pain relief following a single application, with a planned launch in Q3 2025 via specialized centers.
- February 2025: Genprex consolidated its University of Pittsburgh licenses into a single exclusive agreement for diabetes gene therapy technologies utilizing the Pdx1 and MafA genes. The company also established a wholly-owned subsidiary, Convergen Biotech, to advance GPX-002 for the treatment of Type 1 and Type 2 diabetes, to conduct IND-enabling studies by late 2025.
- October 2024: New York Governor Kathy Hochul launched the next phase of New York BioGenesis Park, a USD 430 million cell and gene therapy hub on Long Island backed by a record USD 150 million state investment. The facility aims to enhance research, manufacturing, and commercialization, thereby solidifying New York's leadership in advanced therapies.
- September 2024: Genprex announced the transfer of its diabetes gene therapy program, including GPX-002 for the treatment of Type 1 and Type 2 diabetes, to a new wholly owned subsidiary ("NewCo"). This move separates the alpha-to-beta cell reprogramming asset from the oncology pipeline to accelerate development and secure targeted funding.


Gene Therapy Market Report Scope and Research Methodology
Market Definition and Coverage
Our study defines the gene therapy market as the revenue generated from one-time or repeat administrations that insert, silence, or edit genetic material inside a patient, using viral or non-viral vectors, to correct inherited or acquired disorders across all therapeutic areas and geographies.
Scope exclusion: Treatments that solely expand or reinfuse manipulated cells without a direct genomic alteration (for example, autologous stem-cell infusions) are omitted.
Segments Covered in This Report
- By Therapy Type
- In Vivo
- Ex Vivo
- By Vector Type
- Viral Vectors
- Adeno-Associated Virus
- Lentivirus
- Adenovirus
- Retrovirus & γ-Retrovirus
- Other Viral
- Non-viral Vectors
- Viral Vectors
- By Indication
- Oncology
- Rare Genetic Disorders
- Ophthalmology
- Hematology
- Neurology
- Cardiovascular & Others
- By Delivery Method
- Systemic Administration
- Localised Administration
- By End User
- Hospitals & Specialty Clinics
- Academic & Research Institutes
- Other End Users
- By Geography
- North America
- United States
- Canada
- Mexico
- Europe
- Germany
- United Kingdom
- France
- Italy
- Spain
- Rest of Europe
- Asia-Pacific
- China
- Japan
- India
- Australia
- South Korea
- Rest of Asia-Pacific
- Middle East & Africa
- GCC
- South Africa
- Rest of Middle East & Africa
- South America
- Brazil
- Argentina
- Rest of South America
- North America
Data Sources, Market Sizing, and Validation
Primary Research
Mordor analysts interviewed regulatory reviewers, hospital gene-therapy pharmacists, vector CDMO executives, and clinical investigators across North America, Europe, and Asia-Pacific. Their insights refined real-world treated-patient counts, therapy list-to-net price spreads, and manufacturing run-rate assumptions, anchoring parameters that literature alone cannot reveal.
Desk Research
We began with open data troves such as the US FDA Cell & Gene Therapy approvals list, clinicaltrials.gov, EMA's advanced-therapy registry, and statistics from the American Society of Gene & Cell Therapy, which outline therapy launches, trial volumes, and vector capacity shifts. Industry financials from SEC 10-Ks, payer reimbursement databases, NIH funding dashboards, and peer-reviewed journals supplied pricing, prevalence, and pipeline depth, while D&B Hoovers and Dow Jones Factiva helped us size corporate revenues and track funding flows. These references are illustrative only; many additional sources supported data checks and clarifications.
Market-Sizing & Forecasting
A top-down patient-pool reconstruction mapped disease prevalence to eligible cohorts, which are then adjusted for therapy uptake, label expansions, and attrition before multiplying by blended realized prices. Selective bottom-up roll-ups of publicly disclosed revenue for approved products cross-checked totals. Key variables include: (1) annual FDA/EMA approvals, (2) treated-patient penetration curves, (3) average net selling price by vector class, (4) global AAV and LNP manufacturing capacity utilization, and (5) R&D funding outlays. We project 2025-2030 values with multivariate regression that ties these drivers to observed revenue trajectories, and gaps in bottom-up data are bridged with scenario ranges vetted by our interviewees.
Data Validation & Update Cycle
Outputs pass a multi-analyst peer review, variance tests against external benchmarks, and anomaly triggers. Reports refresh every year, with interim updates when material events, such as a new high-priced therapy approval, shift the baseline.
How Mordor Intelligence's Gene Therapy Market Size Compares to Other Published Estimates
Published estimates rarely align because firms pick differing therapy baskets, currency bases, and refresh cadences.
We flag those levers up front, so clients immediately know what is and is not inside our USD 9.74 billion 2025 figure.
Benchmark comparison
| Market Size | Anonymized source | Primary gap driver |
|---|---|---|
| USD 9.74 B (2025) | Mordor Intelligence | - |
| USD 8.85 B (2024) | Global Consultancy A | Older base year; excludes in-vivo edits gaining share |
| USD 11.07 B (2025) | Industry Publisher B | Counts CDMO service revenue and applies list prices |
These comparisons show that when scope creep and pricing optimism are stripped away, Mordor delivers a grounded, transparent baseline that decision-makers can retrace to explicit variables and repeatable steps.


Key Questions Answered in the Report
How fast is the gene therapy market expected to grow through 2031?
The sector is forecast to expand at a 20.86% CAGR, taking revenue from USD 10.04 billion in 2026 to USD 25.89 billion by 2031.
Which therapy type is projected to grow the quickest?
Ex vivo therapies exhibit the fastest 21.97% CAGR outlook, driven by allogeneic CAR-T programs that eliminate the need for patient-specific manufacturing.
Why are payers beginning to cover high-priced gene therapies?
Outcomes-based contracts and real-world evidence demonstrating durable benefit have persuaded payers that one-time costs can offset lifelong disease management expenses.
Which region is poised for the highest growth through 2031?
Asia-Pacific leads with a projected 28.78% CAGR as China, Japan, and South Korea align regulatory pathways and build manufacturing capacity.
What limits broader adoption despite regulatory momentum?
High manufacturing costs, long-term safety monitoring requirements, and viral-vector capacity constraints create cost and supply challenges that temper uptake.
Page last updated on:


