Gene Vector Market Size and Share
Market Overview
| Study Period | 2020 - 2031 |
|---|---|
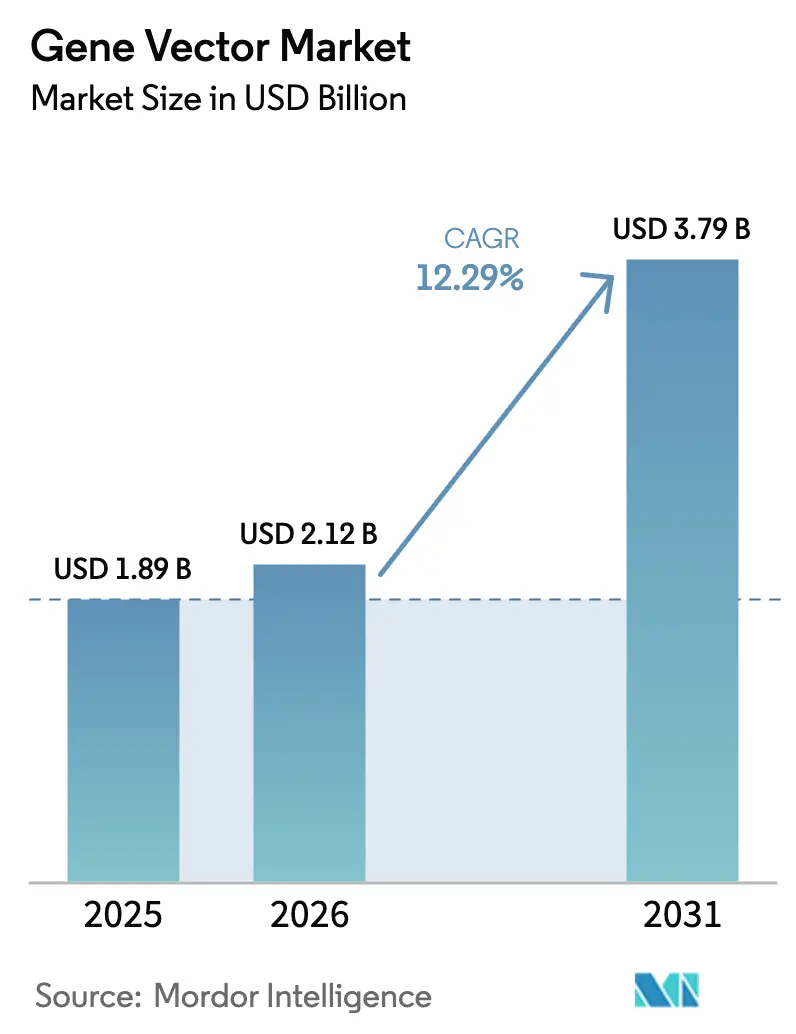
| Market Size (2026) | USD 2.12 Billion |
| Market Size (2031) | USD 3.79 Billion |
| Growth Rate (2026 - 2031) | 12.29% CAGR |
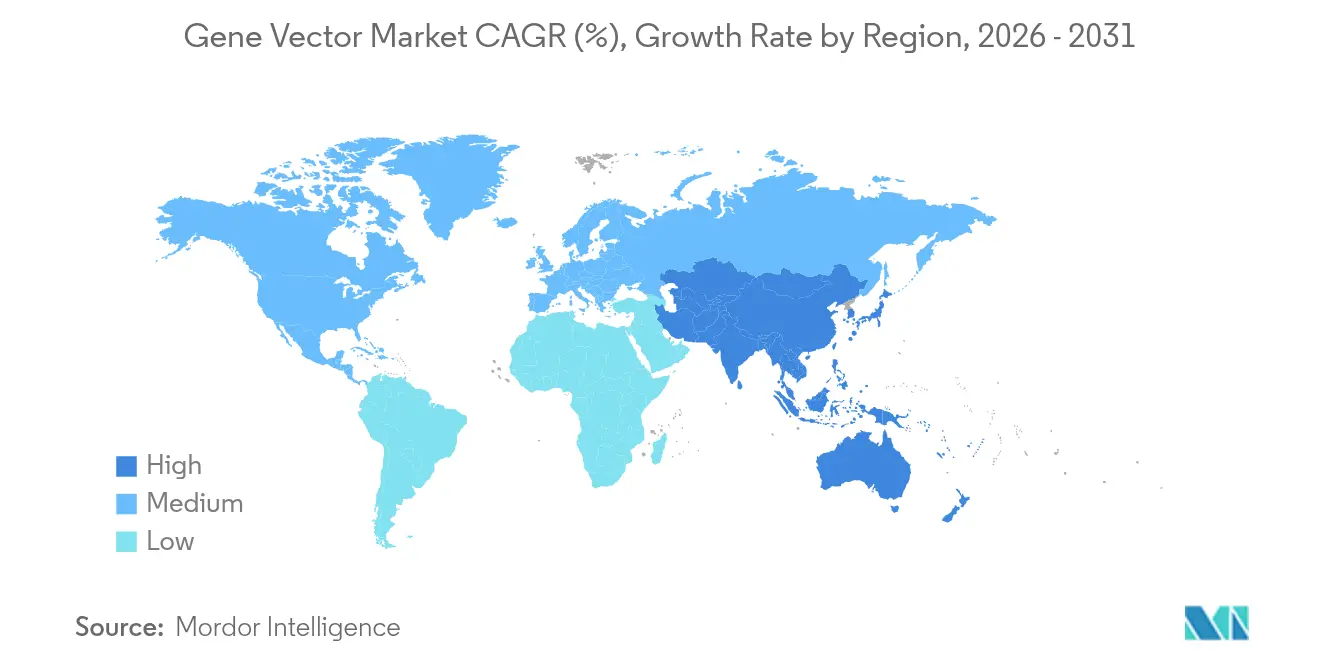
| Fastest Growing Market | Asia Pacific |
| Largest Market | North America |
| Market Concentration | Medium |
Major Players *Disclaimer: Major Players sorted in no particular order Image © Mordor Intelligence. Reuse requires attribution under CC BY 4.0. | |
Gene Vector Market Analysis by Mordor Intelligence
gene vector market size in 2026 is estimated at USD 2.12 billion, growing from 2025 value of USD 1.89 billion with 2031 projections showing USD 3.79 billion, growing at 12.29% CAGR over 2026-2031. This growth mirrors the steady rise of cell and gene therapies from experimental concepts to commercial products. Regulatory agencies granted 7 approvals in 2024 alone, signaling a global willingness to expedite novel modalities that address high-unmet clinical needs[1]International Society for Cell & Gene Therapy, “2024 Annual Report,” isctglobal.org. Market expansion is further reinforced by headline approvals such as Pfizer’s BEQVEZ for hemophilia B and Iovance Biotherapeutics’ AMTGVI for melanoma, both of which depend on reliable vector supply chains[2]U.S. Food and Drug Administration, “Approved Cellular and Gene Therapy Products,” fda.gov. Viral vectors retain a dominant role due to accumulated clinical data, yet non-viral systems attract rising investment because their production methods align more easily with industrial-scale biomanufacturing. Outsourcing trends add momentum; CDMOs captured more than half of total end-user revenue in 2024 and continue to invest heavily in new capacity.
Key Report Takeaways
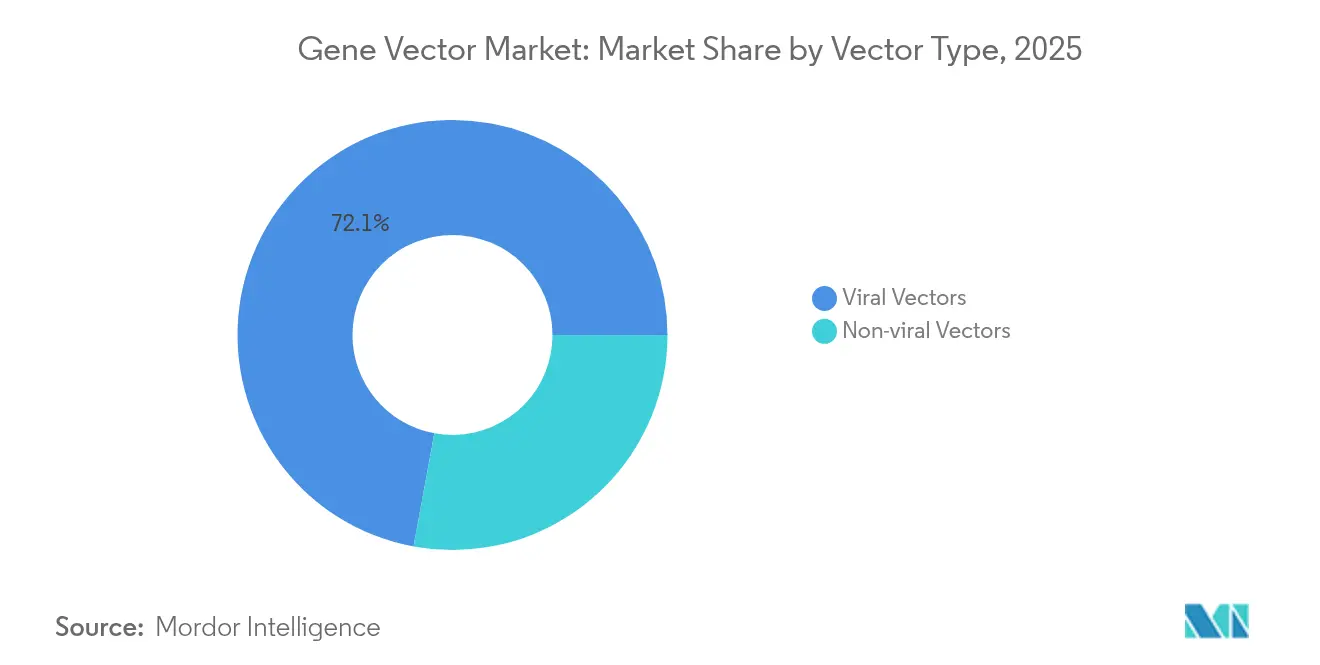
- By vector type, viral systems commanded 72.10% of the gene vector market share in 2025, while non-viral platforms expand at 14.38% CAGR to 2031.
- By delivery method, in-vivo approaches held 59.95% share in 2025; ex-vivo delivery rises fastest at 15.21% CAGR.
- By therapy area, oncology accounted for 41.12% revenue in 2025; vectors for genetic disorders grow at 14.36% CAGR through 2031.
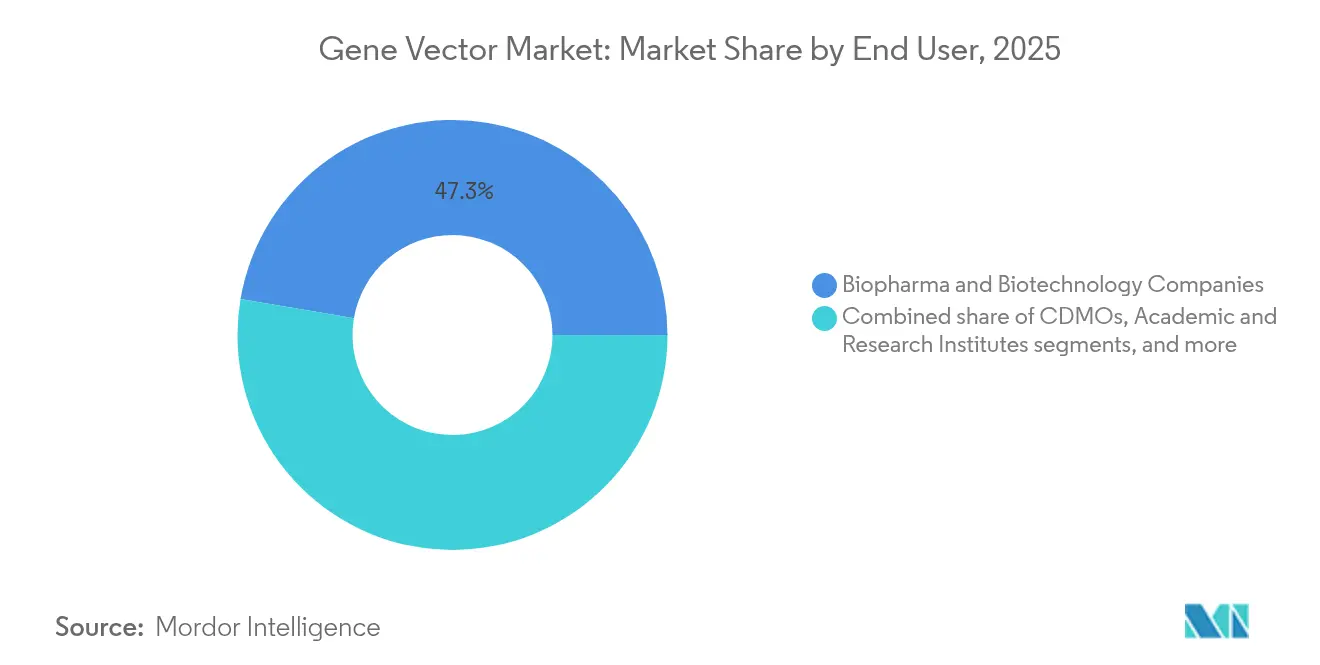
- By end user, CDMOs captured 52.67% share of the gene vector market size in 2025 and advance at 15.12% CAGR.
- By production workflow, upstream steps contributed 62.05% of 2025 revenue; downstream processing records 13.25% CAGR.
- By geographically, North America led with 38.12% revenue share in 2025; Asia-Pacific registers the fastest 13.22% CAGR to 2031.
Note: Market size and forecast figures in this report are generated using Mordor Intelligence’s proprietary estimation framework, updated with the latest available data and insights as of 2026.
Global Gene Vector Market Trends and Insights
Driver Impact Analysis*
| Driver | % Impact on CAGR Forecast | Geographic Relevance | Impact Timeline |
|---|---|---|---|
| Expanding Gene Therapy Pipeline And Approvals | +2.8% | Global, North America & EU lead | Medium term (2-4 years) |
| Strategic Collaborations And CDMO Capacity Expansion | +1.5% | Global, concentrated in North America, EU, APAC | Long term (≥ 4 years) |
| Advancements In Viral Vector Production Technologies | +1.2% | North America & EU core, spill-over to APAC | Medium term (2-4 years) |
| Growing Investment In Non-Viral Delivery Platforms | +0.9% | Global, strong APAC momentum | Long term (≥ 4 years) |
| Government Funding For Rare Disease Treatments | +0.7% | North America & EU primarily | Short term (≤ 2 years) |
| Emerging Point-Of-Care Manufacturing Models | +0.4% | North America & EU, early APAC adoption | Long term (≥ 4 years) |
| Source: Mordor Intelligence | |||
Expanding Gene Therapy Pipeline and Approvals
Regulators cleared 7 cell and gene products in 2024, triple the historical pace and a clear validation of commercial readiness. The FDA now anticipates 10 to 20 approvals every year from 2025, supported by the CoGenT Global pilot that aligns review practices across multiple jurisdictions. More than 900 active clinical trials underscore a swelling pipeline, with Asia-Pacific now matching the combined trial volume of North America and Europe. Capital flows track this enthusiasm; venture funds committed USD 3.4 billion to developers in 2023 despite broader biotech headwinds. Orphan-drug designations amplify speed to market because gene therapies address small populations that qualify for regulatory incentives.
Strategic Collaborations and CDMO Capacity Expansion
Specialized manufacturers announced more than USD 2 billion of new capacity since 2023, led by Samsung Biologics’ USD 1.46 billion program and Lonza’s USD 1.2 billion purchase of a Roche site. Outsourcing momentum reflects rising technical hurdles that exceed internal resources at most sponsors, particularly for adeno-associated and lentiviral systems that demand strict containment. Charles River and the Gates Institute formed a long-term manufacturing alliance for neglected diseases, illustrating the value of capacity that is earmarked for specific portfolios. As facilities expand, utilization risk grows, driving CDMOs to lock in multiyear commitments with developers. Consolidation—such as Novo Holdings’ USD 16.5 billion takeover of Catalent—signals a flight to scale that concentrates manufacturing expertise.
Advancements in Viral Vector Production Technologies
Machine-learning tools now enable rational capsid design that compresses iteration cycles from years to months[3]Science Magazine, “Machine-Learning-Guided Capsid Engineering,” science.org. The University of Pennsylvania demonstrated lipid-based DNA carriers that augment classic AAV systems and may bypass some scale limits. Takara Bio and Thermo Fisher co-developed a closed lentiviral line that doubles productivity per bioreactor. FDA guidance endorses decentralized CAR-T manufacturing as long as in-process controls match central-plant quality, paving the way for smaller, flexible suites near treatment centers. Technology upgrades aim to cut average cost per dose, which still exceeds USD 1 million for many commercial products.
Growing Investment in Non-Viral Delivery Platforms
Investors back non-viral start-ups because synthetic carriers sidestep the supply limits and patent thickets that challenge viral systems. Lipid nanoparticles, proven in mRNA vaccines, can be manufactured in billion-dose quantities in standard sterile fill-finish plants, widening the addressable market. VectorBuilder attracted USD 76 million in Series C funding to scale a menu-based design platform that delivers custom vectors without cell culture. The high-profile REGENXBIO–Sarepta patent case underscores royalty burdens that push developers toward open IP spaces in non-viral fields. Polymer and hybrid systems are advancing quickly under government grants that prioritize methods capable of meeting global demand.
Restraints Impact Analysis*
| Restraints Impact Analysis | (~) % Impact on CAGR Forecast | Geographic Relevance | Impact Timeline |
|---|---|---|---|
| High Manufacturing Cost And Process Complexity | –1.2% | Global, most acute in North America & EU | Medium term (2-4 years) |
| Limited Skilled Workforce And Training Gaps | –0.6% | Global, strongest in North America, EU, APAC | Medium term (2-4 years) |
| Supply Chain Constraints For Critical Raw Materials | –0.8% | Global, 75% of API suppliers outside US | Short term (≤ 2 years) |
| Intellectual Property Barriers In Novel Capsids | –0.5% | North America & EU lead, emerging in APAC | Long term (≥ 4 years) |
| Source: Mordor Intelligence | |||
High Manufacturing Cost and Process Complexity
Many therapies still cost more than USD 1 million per patient because bioreactors, plasmid supply, and aseptic fill steps remain labor-intensive. Recent FDA warning letters to Sanofi’s Genzyme site noted contamination and oversight lapses that halted operations for months. Eight in ten CDMOs have raised prices since 2022, but margin relief remains elusive in a competitive bidding landscape. European rules now require most approved products to run post-marketing studies, adding expense beyond licensure. Thermo Fisher’s 2024 exit from viral vectors underscores how cost pressure can drive even large conglomerates to retrench.
Supply Chain Constraints for Critical Raw Materials
Three-quarters of vector-grade API suppliers operate outside the United States, exposing manufacturers to geopolitical and logistics risk. In 2024, lentiviral shortages forced CAR-T producers to ration lots, delaying patient slots at several major centers. Regulatory scrutiny of animal-derived media components is rising, prompting validation cycles that slow production. Aspen Pharmacare received citations for CGMP lapses that impacted multiple downstream customers. Efforts to localize supply will require multiyear capital programs and new vendor qualifications.
*Our forecasts treat driver/restraint impacts as directional, not additive. The impact forecasts reflect baseline growth, mix effects, and variable interactions.
Segment Analysis
By Vector Type: Viral Dominance Faces Non-Viral Challenge
Viral platforms contributed 72.10% of 2025 revenue, anchoring the gene vector market with clinically validated AAV and lentiviral assets. Adeno-associated virus remains the workhorse because of its favorable safety profile, yet recent reports of insertional mutagenesis in rodents triggered deeper review of integration events. Non-viral carriers are growing at 14.38% CAGR, a sign that sponsors view synthetic chemistry and lipid formulations as the next productivity lever. The University of Pennsylvania’s lipid-DNA system highlights how hybrid designs may blend viral tropism with industrial scalability.
Manufacturers prize non-viral methods for simpler sterile filtration and the absence of replication-competent virus testing. Polymer conjugates and plasmid DNA vectors bypass cell culture, trimming lead times and easing supply constraints. Investors also note less crowded patent estates, lowering royalty drag. Taken together, viral incumbency remains strong, yet the gene vector market is widening as novel platforms prove their worth in toxicology packages and early human data.


By Delivery Method: In-Vivo Leadership Meets Ex-Vivo Innovation
In-vivo administration held 59.95% share in 2025, supported by blockbusters such as LUXTURNA and ZOLGENSMA that deliver single shots with durable expression fda.gov. Ex-vivo cell editing, however, advances at 15.21% CAGR because decentralized suites allow hospitals to engineer autologous cells without cross-border shipping. Regulatory guidance on CAR-T lot comparability stabilizes the framework for multiple sites and encourages clinics to install scalable bioreactors.
Cold-chain stress and recent AAV safety alarms draw fresh attention to ex-vivo formats where quality can be verified before reinfusion. Point-of-care pilots demonstrate that same-day releases are possible, shrinking patient waiting lists. In-vivo platforms still dominate systemic diseases, yet the balance is shifting as manufacturing hardware and digital control layers reduce the footprint required for cell processing.
By Therapy Area: Oncology Dominance Yields to Genetic Disorder Growth
Oncology captured 41.12% of 2025 sales, powered by continued approval momentum for CAR-T and tumor-infiltrating lymphocyte regimens. Genetic disorders are the fastest-rising slice, expanding 14.36% CAGR as public funding subsidizes programs for ultra-rare populations. Successful liver-directed AAV trials embolden developers to tackle metabolic dysfunctions that lack small-molecule options.
Infectious-disease work benefits from pandemic preparedness grants, although commercial clarity remains limited. Ophthalmology enjoys a proven reimbursement pathway and high clinical need, encouraging follow-on products that apply established LUXTURNA delivery principles. Cardiovascular and neurological indications present untapped potential once delivery tools reliably cross tissue barriers such as the blood-brain barrier.
By End User: Biopharma Leadership Faces CDMO Acceleration
Biopharma innovators still drew 47.33% of 2025 revenue, reflecting their ownership of approved assets and late-stage pipelines. However, CDMOs expanded fastest at 15.12% CAGR and now hold the largest single block of revenue measured by end user, underscoring the depth of outsourcing across the gene vector industry. Lonza’s purchase of a Roche site and Samsung’s greenfield build in Incheon both signal a race to dominate supply.
Academic centers leverage NIH grants to push first-in-human studies, using shared manufacturing cores as economical bridges to Phase I. Hospital-based producers are emerging in oncology as they validate point-of-care approaches. CDMOs respond with flexible cleanrooms and modular capacity, locking in multiyear supply agreements that stabilize margins and enhance bargaining power with raw-material vendors.
By Production Workflow: Upstream Dominance Meets Downstream Innovation
Upstream operations—including plasmid prep, cell banking, and transfection—accounted for 62.05% of 2025 revenue and thus form the largest slice of the gene vector market size. Yield optimization during upstream steps remains the primary determinant of final cost. Yet downstream purification and fill-finish increase at 13.25% CAGR as single-use chromatography, inline analytics, and continuous ultrafiltration gain traction.
Sanofi’s Genzyme warning letter illustrated how lapses in downstream environmental control can halt shipments despite strong upstream titers. Manufacturers now integrate predictive software to forecast impurity trends and trigger automated adjustments. Collaboration between Takara Bio and Thermo Fisher merges closed-system upstream bioreactors with high-flow tangential filtration, lowering virus carryover risk. Continuous upgrades across both workflow segments underpin the broader goal of driving therapies below the USD 500,000 price ceiling that payers increasingly demand.
Geography Analysis
North America held 38.12% of 2025 revenue, buoyed by robust venture financing, experienced talent pools, and FDA leadership in expedited review pathways. The NIH’s URGenT Network funnels targeted grants into rare-disease vectors, while the BGTC consortium underwrites academic GMP suites. Supply-chain dependence on overseas raw materials, however, prompted new policy initiatives that seek to reshore critical inputs and reduce strategic vulnerability.
Asia-Pacific posts the highest regional CAGR at 13.22% and is reshaping clinical and manufacturing maps. China’s industrial plans subsidize nucleic-acid production hubs, while Samsung Biologics’ expansion cements South Korea’s ambitions to anchor regional CDMO services. Asia now hosts 48% of global cell and gene trials, matching Western totals and providing access to genetically diverse cohorts. Local regulators in Japan and Australia align post-marketing surveillance with EMA and FDA norms, a move that eases multi-region launch sequencing.
Europe remains a vital contributor through academic research powerhouses, seasoned regulators, and a sophisticated reimbursement ecosystem. Lonza’s Swiss headquarters positions the region as a continued manufacturing stronghold. Yet divergent member-state pricing tests profitability, and Eastern markets lag in therapy uptake. Latin America and the Middle East are at earlier stages, with Brazil trial regulations and Saudi Arabia’s biocluster plans pointing to gradual regional participation.

Competitive Landscape
The field shows moderate concentration, with the five largest suppliers controlling about 35% of 2024 revenue. Novo Holdings’ USD 16.5 billion purchase of Catalent established the largest CDMO footprint and sharpened focus on vector supply. Thermo Fisher exited viral vectors, cutting 300 jobs, a decision that underscores the capital intensity and pricing pressure within this segment.
Patent litigation remains a strategic lever; the REGENXBIO-Sarepta dispute over AAV rights may reset license economics for systemic therapies. Market leaders chase vertical integration: Pfizer originally combined BEQVEZ development with internal vector lines but later divested earlier assets to AstraZeneca for USD 1 billion, illustrating shifting focus. Rising disruptors, including VectorBuilder and Genespire, rely on platform versatility and funding rounds that target chronic capacity gaps rather than single-asset risk.
Strategic alliances proliferate. Charles River’s partnership with the Gates Institute secures dedicated slots for neglected tropical disease pipelines. UniQure placed HEMGENIX supply with Genezen to hedge single-supplier risk, highlighting the premium on redundancy. Overall, success is tilting toward organizations that marry GMP expertise, regulatory credibility, and resilient sourcing frameworks.
Gene Vector Industry Leaders
Thermo Fisher Scientific, Inc.
Merck KGaA (MilliporeSigma)
Lonza Group
Catalent Inc.
Oxford Biomedica
- *Disclaimer: Major Players sorted in no particular order


Recent Industry Developments
- February 2025: Pfizer discontinued BEQVEZ for hemophilia B; AstraZeneca acquired the related discovery portfolio for USD 1 billion.
- January 2025: FDA issued a warning letter to Sanofi’s Genzyme plant for CGMP violations, spotlighting contamination controls.
- December 2024: Lonza closed a USD 1.2 billion deal for Roche’s viral vector site, expanding European capacity.
- November 2024: Novo Holdings finalized its USD 16.5 billion Catalent acquisition, creating a leading CDMO platform.
- October 2024: Samsung Biologics committed USD 1.46 billion for a new cell and gene complex in Incheon.


Global Gene Vector Market Report Scope
Gene therapy uses genetic material to treat or prevent a specific disease. The objective is to reinstate the normal function of essential proteins in the body by pursuing and counteracting genetic alterations. It aims to improve overall health and proper functioning of the host body of organisms.
The gene vector market is segmented into vector type, disease, application, end-user, and geography. By vector type, the market is segmented into lentivirus, adenovirus, adeno-associated virus (AAV), plasmid DNA, and others. Based on disease, the market is segmented into cancer, genetic disorders, infectious diseases, and others. The gene vector market is segmented by application into gene therapy, vaccinology, and others. Based on end user, the market is segmented into CDMO, CRO, scientific research, and others. By geography, the market is segmented into North America, Europe, Asia-Pacific, South America, and the Middle East and Africa. The report also offers the market sizes and forecasts for 17 countries across the region. For each segment, the market sizing and forecasts were made on the basis of value (USD).
| Viral Vectors | Adeno-associated Virus (AAV) |
| Lentivirus | |
| Adenovirus | |
| Retrovirus / Gammaretrovirus | |
| Herpes Simplex Virus | |
| Non-viral Vectors | Plasmid DNA |
| Lipid Nanoparticles (LNP) | |
| Polymer-based Vectors | |
| Hybrid Vectors |
| In-vivo Gene Delivery |
| Ex-vivo Gene Delivery |
| Oncology |
| Genetic Disorders |
| Infectious Diseases |
| Cardiovascular Diseases |
| Ophthalmology |
| Neurological Disorders |
| Others |
| Biopharma & Biotechnology Companies |
| Contract Development & Manufacturing Organizations (CDMOs) |
| Academic & Research Institutes |
| Hospitals & Clinics |
| Upstream Processing |
| Downstream Processing |
| North America | United States |
| Canada | |
| Mexico | |
| Europe | Germany |
| United Kingdom | |
| France | |
| Italy | |
| Spain | |
| Rest of Europe | |
| Asia-Pacific | China |
| Japan | |
| India | |
| Australia | |
| South Korea | |
| Rest of Asia-Pacific | |
| Middle East & Africa | GCC |
| South Africa | |
| Rest of Middle East & Africa | |
| South America | Brazil |
| Argentina | |
| Rest of South America |
| By Vector Type | Viral Vectors | Adeno-associated Virus (AAV) |
| Lentivirus | ||
| Adenovirus | ||
| Retrovirus / Gammaretrovirus | ||
| Herpes Simplex Virus | ||
| Non-viral Vectors | Plasmid DNA | |
| Lipid Nanoparticles (LNP) | ||
| Polymer-based Vectors | ||
| Hybrid Vectors | ||
| By Delivery Method | In-vivo Gene Delivery | |
| Ex-vivo Gene Delivery | ||
| By Therapy Area | Oncology | |
| Genetic Disorders | ||
| Infectious Diseases | ||
| Cardiovascular Diseases | ||
| Ophthalmology | ||
| Neurological Disorders | ||
| Others | ||
| By End User | Biopharma & Biotechnology Companies | |
| Contract Development & Manufacturing Organizations (CDMOs) | ||
| Academic & Research Institutes | ||
| Hospitals & Clinics | ||
| By Production Workflow | Upstream Processing | |
| Downstream Processing | ||
| Geography | North America | United States |
| Canada | ||
| Mexico | ||
| Europe | Germany | |
| United Kingdom | ||
| France | ||
| Italy | ||
| Spain | ||
| Rest of Europe | ||
| Asia-Pacific | China | |
| Japan | ||
| India | ||
| Australia | ||
| South Korea | ||
| Rest of Asia-Pacific | ||
| Middle East & Africa | GCC | |
| South Africa | ||
| Rest of Middle East & Africa | ||
| South America | Brazil | |
| Argentina | ||
| Rest of South America | ||


Key Questions Answered in the Report
What is the current size of the gene vector market?
The gene vector market is valued at USD 2.12 billion in 2026 and is projected to climb to USD 3.79 billion by 2031.
Which vector platform holds the largest share?
Viral systems dominate with 72.10% of 2025 revenue, mainly due to extensive clinical validation.
Why are CDMOs gaining market importance?
CDMOs captured 52.67% of 2025 revenue because drug sponsors increasingly outsource complex manufacturing to specialized providers with scale and compliance expertise.
Which region is growing fastest?
Asia-Pacific leads growth at a 13.22% CAGR through 2031, driven by large-scale capacity investments and supportive regulatory policies.
What is the biggest barrier to wider adoption of gene therapies?
High manufacturing cost and process complexity remain the top hurdle, subtracting an estimated 1.2 percentage points from forecast CAGR.
How many gene therapy approvals are expected annually?
The FDA projects 10 to 20 cellular and gene therapy approvals each year starting in 2025, signaling sustained regulatory momentum.
Page last updated on:


