Garbage Collection Vehicle Market Size and Share
Market Overview
| Study Period | 2019 - 2030 |
|---|---|
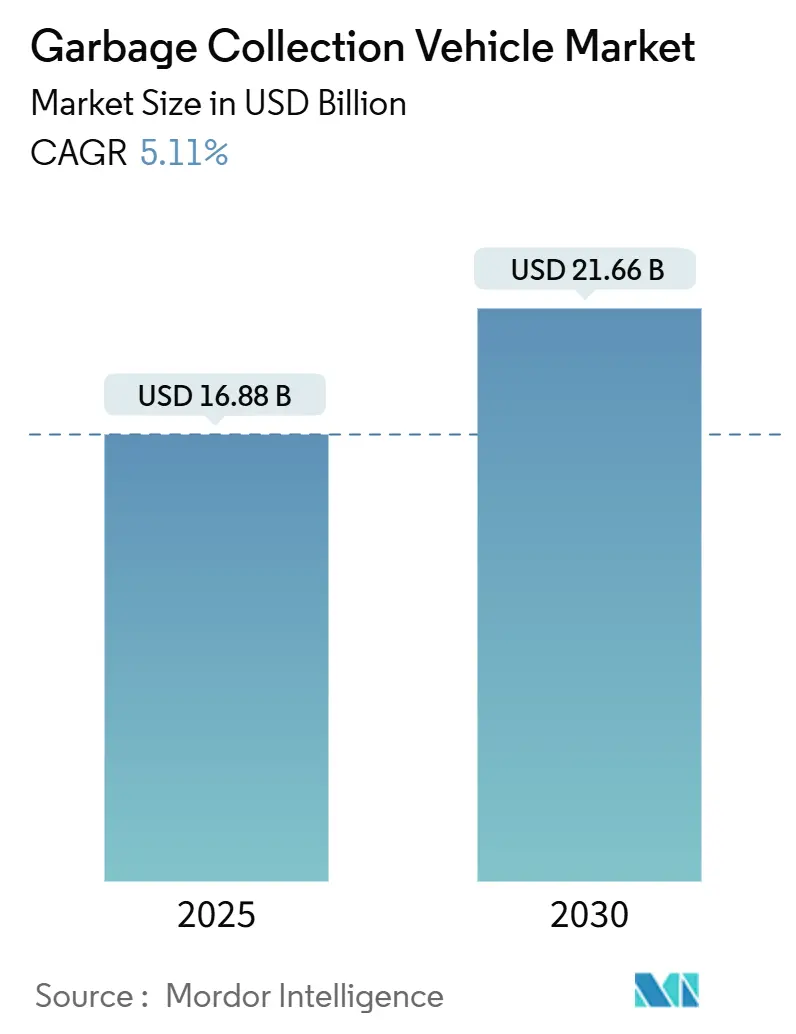
| Market Size (2025) | USD 16.88 Billion |
| Market Size (2030) | USD 21.66 Billion |
| Growth Rate (2025 - 2030) | 5.11% CAGR |
| Fastest Growing Market | Middle East and Africa |
| Largest Market | Asia Pacific |
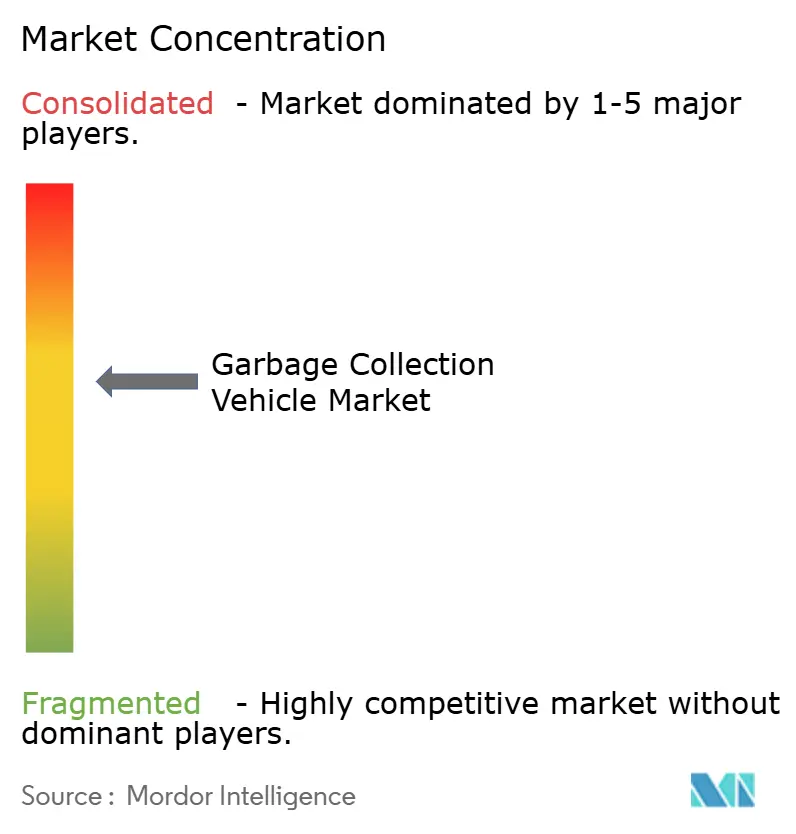
| Market Concentration | Medium |
Major Players *Disclaimer: Major Players sorted in no particular order Image © Mordor Intelligence. Reuse requires attribution under CC BY 4.0. | |
Garbage Collection Vehicle Market Analysis by Mordor Intelligence
The Garbage Collection Vehicle Market size is estimated at USD 16.88 billion in 2025, and is expected to reach USD 21.66 billion by 2030, at a CAGR of 5.11% during the forecast period (2025-2030). Rapid urbanization, tightening emissions rules, rising labor costs, and digitalization are reshaping procurement priorities and pushing municipalities toward automated, fuel-efficient, and data-rich fleets. Asia-Pacific remains the demand anchor due to large-scale urban migration and infrastructure spending. At the same time, North America and Europe set technology and regulatory pace with zero-emission mandates and landfill-diversion targets. Medium-duty chassis dominate new orders because they balance payload and maneuverability in dense street grids, and electric drivetrains are gaining share as incentives cut total lifetime costs. At the same time, constrained municipal budgets and a shortage of technicians for innovative hydraulics slow replacement cycles, producing a two-speed Garbage Collection Vehicle market in which affluent cities adopt advanced systems while cost-pressed jurisdictions extend legacy fleets.
Key Report Takeaways
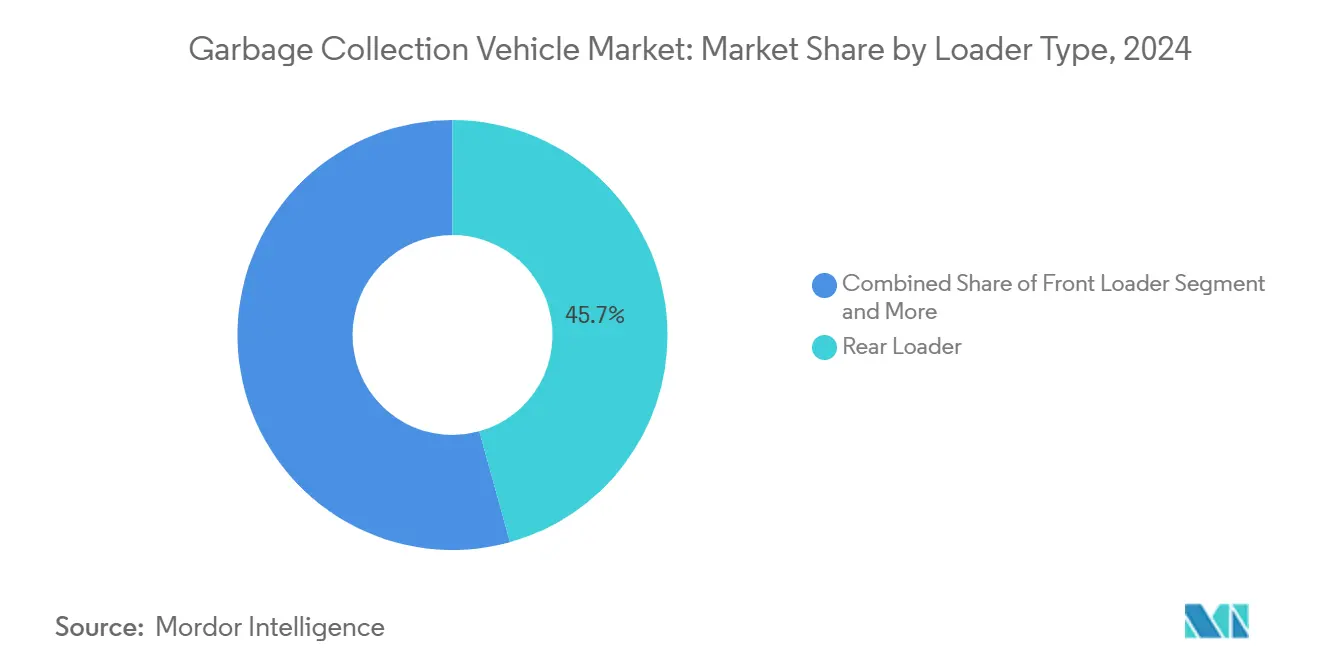
- By loader type, rear loaders led with 45.71% of the Garbage Collection Vehicle market share in 2024; automated side loaders are forecast to expand at a 5.12% CAGR through 2030.
- By technology, manual systems accounted for 56.57% of the Garbage Collection Vehicle market share in 2024, while semi-automatic technology is projected to post the fastest 5.21% CAGR through 2030.
- By vehicle type, medium-duty models accounted for 42.35% of the Garbage Collection Vehicle market share in 2024 and are projected to advance at a 5.23% CAGR between 2025 and 2030.
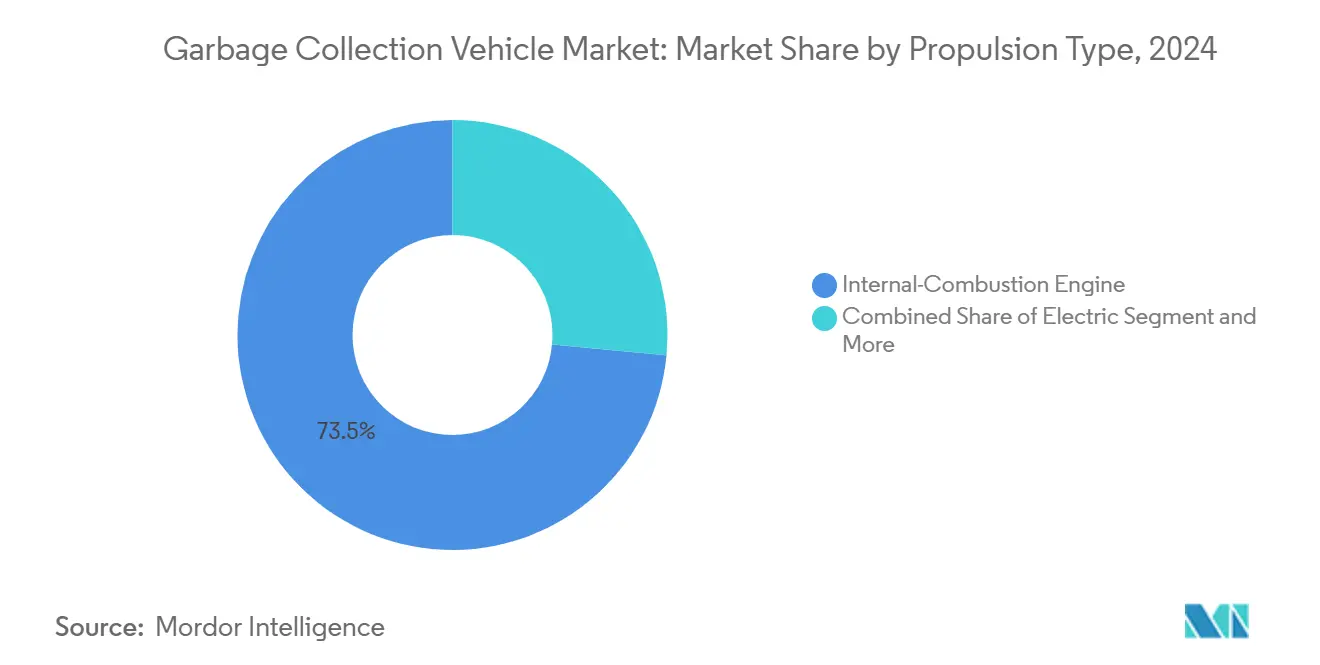
- By propulsion type, internal combustion engines held 73.48% of the Garbage Collection Vehicle market share in 2024, while electric vehicles recorded the highest projected CAGR at 5.14% through 2030.
- By application, municipal collection commanded 66.37% of the Garbage Collection Vehicle market share in 2024 and is set to grow at a 5.17% CAGR to 2030.
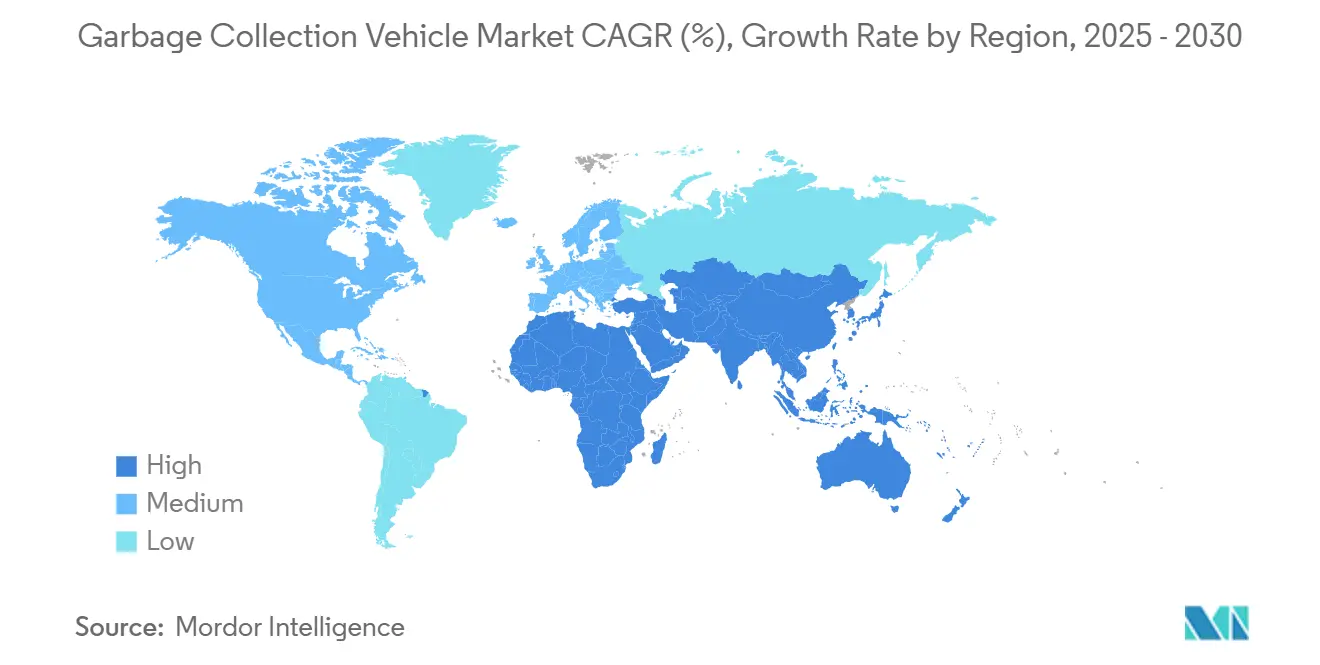
- By geography, Asia-Pacific captured 38.81% of the Garbage Collection Vehicle market share in 2024; the Middle East and Africa are expected to post the fastest regional CAGR at 5.18% through 2030.
Global Garbage Collection Vehicle Market Trends and Insights
Drivers Impact Analysis*
| Driver | (~) % Impact on CAGR Forecast | Geographic Relevance | Impact Timeline |
|---|---|---|---|
| Urbanisation-Driven Rise | +1.2% | Global, with highest impact in Asia Pacific and MEA | Long term (≥ 4 years) |
| Fleet Electrification and CNG Incentives | +1.1% | North America and EU, early adoption in select Asia Pacific cities | Short term (≤ 2 years) |
| Rapid Adoption Of Automated Side-Loader Trucks | +0.9% | North America core, spill-over to EU and Asia Pacific | Medium term (2-4 years) |
| Stringent Emissions | +0.8% | North America and EU, expanding to Asia Pacific | Medium term (2-4 years) |
| AI-Enabled Route-Optimisation | +0.7% | Global, with early gains in developed markets | Short term (≤ 2 years) |
| Circular-Economy Data Mandates | +0.6% | EU core, expanding to North America and select Asia Pacific regions | Long term (≥ 4 years) |
| Source: Mordor Intelligence | |||
Urbanization-Driven Rise In Solid-Waste Volumes
United Nations projections show cities adding many inhabitants by 2050, and waste generation climbs faster than population as income levels rise, lifting per-capita disposal from 0.8-1.2 kg in many developing cities to 2.2 kg in richer urban centers[1]“World Urbanization Prospects 2024,” United Nations, un.org. The waste-to-GDP elasticity of 0.34 seen in middle-income economies magnifies demand for collection capacity beyond head-count growth. Municipal planners, therefore, look for higher-capacity trucks and automated loaders that can finish additional stops without an extra crew. Fleet mixes shift toward medium-duty chassis that weave through congested streets yet haul larger volumes.
Fleet Electrification & CNG Incentives
Federal clean-vehicle credits of up to USD 40,000 plus state rebates leave some U.S. buyers with USD 100,000-150,000 in net subsidies per electric refuse truck[2]“Commercial Clean Vehicle Credit,” Internal Revenue Service, irs.gov . Operating savings reach three-fifths compared with diesel, and lifecycle greenhouse-gas cuts of four-fifths satisfy municipal climate plans. CNG provides a bridge solution: The maximum particulate matter is less than that of diesel, and fuel cost discounts are nearly one-fifth. Most of the amount has gone into North American CNG fueling grids since 2020[3]“Alternative Fueling Station Counts by State,” U.S. Energy Information Administration, eia.gov , helping smaller fleets lower tailpipe emissions without high-voltage depot upgrades.
Rapid Adoption Of Automated Side-Loader Trucks
Automated side loaders cut crews from three to one, easing labor shortages that affect four-fifths of U.S. waste departments. Fleet trials confirm a one-fifth productivity lift and three-fifths drop in compensation claims compared with manual rear loaders. COVID-19 accelerated uptake because automation limits human contact. Implementation needs standardized bins and re-routed loops, adding initial complexity, but once deployed, the vehicles can clear 800-1,200 households daily, doubling manual rates.
Stringent Emissions & Landfill-Diversion Regulations
California’s Advanced Clean Fleets rule requires complete zero-emission municipal fleets by 2042. Europe's forthcoming Euro 7 limits cut heavy-duty NOx to 200 mg/km from 2027. Parallel landfill diversion targets 35 U.S. states to demand diversion rates above half, driving procurement of split-body trucks for recyclables and organics. Non-compliance can cost operators USD 5,000-50,000 per vehicle per year, so cities fast-track replacements, boosting demand for compliant models even when older assets still run.
Restraints Impact Analysis*
| Restraint | (~) % Impact on CAGR Forecast | Geographic Relevance | Impact Timeline |
|---|---|---|---|
| High Capex Of Electric and Automated Vehicles | -0.9% | Global, with highest impact in cost-sensitive emerging markets | Medium term (2-4 years) |
| Tight Municipal Budgets | -0.7% | Global, particularly acute in post-pandemic municipal finances | Short term (≤ 2 years) |
| Shortage Of Technicians | -0.5% | North America and EU core, expanding to Asia Pacific urban centers | Medium term (2-4 years) |
| Cyber-Security Risks | -0.4% | Global, with highest concern in developed markets with smart fleet adoption | Long term (≥ 4 years) |
| Source: Mordor Intelligence | |||
High Capex Of Electric & Automated Vehicles
Electric refuse trucks cost three-fifths more than diesel, and automated arms add one-fourth. Charging infrastructure averages USD 50,000-100,000 per depot, and batteries may need USD 80,000-120,000 replacements after 8-10 years. Smaller towns struggle to spread those fixed costs across fewer than 15-unit fleets. Leasing offers alternatives, but monthly payments stay more than half above conventional units, straining tight operating budgets.
Tight Municipal Budgets Slow Fleet Renewal
Property-tax receipts fell slightly in 2024, leading two-thirds of cities to postpone new truck orders. The average fleet age reached 9.2 years, up from 7.8 years pre-pandemic. Maintenance expenses climb steeply after year 8, hitting USD 15,000-25,000 annually versus USD 5,000-8,000 for newer units, eroding any savings from deferral. Approval cycles lengthen to 18-24 months amid public hearings and budget reviews, delaying the adoption of cleaner, safer technology. Only a few municipalities raised collection fees above inflation in 2024.
*Our forecasts treat driver/restraint impacts as directional, not additive. The impact forecasts reflect baseline growth, mix effects, and variable interactions.
Segment Analysis
By Loader Type: Automation Reshapes Collection Efficiency
Rear loaders held 45.71% of the Garbage Collection Vehicle market in 2024, reflecting decades of operator familiarity and versatility across mixed refuse streams. Automated side loaders, though, will post a 5.12% CAGR to 2030 as cities chase single-operator models that halve labor costs and minimize ergonomic liabilities.
Productivity gaps continue widening. Automated units routinely service 1,000 or more stops per shift, twice that of manual crews, especially in grid-like neighborhoods where standardized carts speed grab-and-dump cycles. McNeilus added AI bin-detection in 2025, raising pick accuracy to almost complete and even flagging contamination in recyclable streams. Regulatory scrutiny of manual lifting under OSHA guidelines supplies further tailwinds for robotic arms.


By Technology: Smart Systems Drive Operational Intelligence
Manual trucks still command 56.57% of the Garbage Collection Vehicle market share in 2024 because retrofits are costly, and many emerging-market cities prioritize basic capacity over data capture. Combining cart tippers with entry-level telematics, semi-automatic options will expand at a 5.21% CAGR as fleet managers seek incremental gains without wholesale overhaul.
Smart Garbage Collection Vehicle market demand is climbing as IoT sensors, cloud dashboards, and predictive models cut downtime and trim fuel by one-fifth. Yet one-third of municipalities cite cybersecurity risks, pushing vendors to embed hardened gateways and secure over-the-air update protocols. Integrators that bundle hardware, software, and compliance reporting carve out premium contracts.
By Vehicle Type: Medium-Duty Vehicles Optimize Urban Operations
Medium-duty chassis captured 42.35% of the Garbage Collection Vehicle market share in 2024 and will grow at a 5.23% CAGR, benefiting from maneuverability in narrow lanes and payloads that match single-day residential routes. A typical GVWR of 26,001-33,000 lbs avoids heavy-truck restrictions and road tolls while keeping maintenance parts familiar to regional delivery fleets.
Electric entries like Battle Motors’ 150-mile rig cut fuel bills three-fifths, meeting foreseeable zero-emission timelines. Heavy-duty models still serve industrial corridors with high tonnage, but urban load limits and surface-wear penalties nudge procurement toward lighter frames. Light-duty niche trucks remain relevant for medical or alley collections yet lack scale for volume growth.
By Propulsion Type: Electrification Accelerates Despite ICE Dominance
Due to lower purchase prices and ubiquitous fueling, conventional internal combustion engines (diesel and gasoline engines) represented 73.48% of the Garbage Collection Vehicle market share in 2024. Electric trucks, though, clock the fastest 5.14% CAGR due to purchase incentives, falling battery costs, and climate-action pledges.
The total ownership math favors high-use fleets: USD 15,000-25,000 annual fuel savings pay back premiums in 7-10 years, even without subsidies. Charging-depot capex and grid upgrades remain hurdles, but state-funded infrastructure grants and public-private energy partnerships ease them. Hybrid and CNG variants provide interim steps to trim emissions and fuel expenses while using familiar drivetrains.
By Application: Municipal Dominance Reflects Public Sector Scale
Municipal contracts produced 66.37% of the Garbage Collection Vehicle market share in 2024 and will grow 5.17% annually, as service universalization and stricter diversion quotas lock in multi-year procurement calendars. Competitive tenders reward builders offering lifecycle maintenance and verified carbon savings.
Commercial routes rely on consistency and contamination management, driving uptake of split bunkers and RFID tracking. Industrial users demand bespoke bodies for bulky debris or hazardous streams, sustaining specialist up-fitters. Across segments, containerization pilots such as New York City’s 2024 curb-box program show promise, slashing pickup times by two-fifths and reducing street litter.
Geography Analysis
Asia-Pacific led with 38.81% of the Garbage Collection Vehicle market share in 2024, powered by aggressive urban growth and sizeable government infrastructure outlays in China, India, and Southeast Asia. In 2024, China produced municipal solid waste, with smart-collection pilots in Shenzhen and Shanghai shaping purchase specifications across the region. India's Swachh Bharat Mission allocated funds to waste projects, frequently incorporating technology-transfer clauses that facilitate localized assembly for international brands. Japan leads in innovation, boasting that most of its municipal trucks are equipped with telematics, a trend prompting neighboring markets to notice.
The Middle East and Africa will post the fastest 5.18% CAGR to 2030. Between 2020 and 2024, cities in the UAE poured significant investments to align with the Net Zero 2050 initiative. Meanwhile, Saudi Arabia's Vision 2030 aims for substantial waste diversion, emphasizing the need for specialists in organics and hazardous waste. As metropolitan waste volumes surge annually in Africa, cities respond with fleet upgrades funded by donors and concessions for public-private services.
North America and Europe remain mature yet tech-forward. The EU’s Circular Economy plan mandates traceable waste streams, and Low-Emission Zones bar Euro V or older trucks. U.S. and Canadian municipalities embed lifecycle carbon scoring in bids, giving electric and CNG options a procurement edge. Established financing, aftermarket support, and policy clarity underpin stable, sophisticated demand focused on automation, data, and zero-emission propulsion.

Competitive Landscape
The Garbage Collection Vehicle market is moderately fragmented. No firm controls over one-fifths of global revenue, leaving room for legacy manufacturers and disruptive entrants. Dennis Eagle leads in Britain, Heil and McNeilus dominate North America, while Zoomlion and XCMG scale production in Asia.
Strategic moves include vertical integration: Oshkosh blends refuse bodies, chassis, and electric drivelines under one umbrella, ensuring parts availability and warranty uniformity. Partnerships flourish between chassis OEMs and battery startups to accelerate zero-emission rollouts without heavy in-house R&D. Data ecosystems emerge as new battlegrounds, with vendors bundling telematics, route software, and predictive maintenance into subscription packages that deepen customer lock-in.
Terex’s purchase of Environmental Solutions Group in October 2024 shows consolidation to gain technology breadth and regional scale. Electric-only specialists such as Battle Motors use speed to market and ESG branding to win early electrification tenders in California and New York. Asian contenders leverage low-cost manufacturing and state financing to penetrate Latin America and Africa, intensifying price competition in entry-level segments.
Garbage Collection Vehicle Industry Leaders
Heil (Dover Corporation)
McNeilus (Oshkosh Corp.)
FAUN Umwelttechnik
Dennis Eagle (Terberg)
New Way Trucks
- *Disclaimer: Major Players sorted in no particular order

Recent Industry Developments
- January 2025: Oshkosh Corporation’s McNeilus division unveiled the Volterra ZFL electric front loader at CES 2025, featuring AI-enabled bin detection, electrified lifting arms, and a 200-mile range with 6-hour charging capability.
- October 2024: Terex Corporation completed the USD 2.0 billion acquisition of Environmental Solutions Group, adding Heil Environmental and Marathon Equipment brands to its portfolio and creating one of the sector’s largest integrated manufacturers.


Global Garbage Collection Vehicle Market Report Scope
| Front Loader |
| Rear Loader |
| Automated Side Loader |
| Mechanical Loader |
| Manual |
| Semi-Automatic |
| Smart Garbage Collection Systems |
| Light-Duty Vehicles |
| Medium-Duty Vehicles |
| Heavy-Duty Vehicles |
| Internal Combustion Engine (ICE) |
| Electric |
| Hybrid |
| Compressed Natural Gas (CNG) |
| Municipal Waste Collection |
| Commercial Waste Collection |
| Industrial Waste Collection |
| North America | United States |
| Canada | |
| Rest of North America | |
| South America | Brazil |
| Argentina | |
| Rest of South America | |
| Europe | United Kingdom |
| Germany | |
| Spain | |
| Italy | |
| France | |
| Russia | |
| Rest of Europe | |
| Asia Pacific | India |
| China | |
| Japan | |
| South Korea | |
| Rest of Asia Pacific | |
| Middle East and Africa | United Arab Emirates |
| Saudi Arabia | |
| Turkey | |
| Egypt | |
| South Africa | |
| Rest of Middle-East and Africa |
| By Loader Type | Front Loader | |
| Rear Loader | ||
| Automated Side Loader | ||
| Mechanical Loader | ||
| By Technology | Manual | |
| Semi-Automatic | ||
| Smart Garbage Collection Systems | ||
| By Vehicle Type | Light-Duty Vehicles | |
| Medium-Duty Vehicles | ||
| Heavy-Duty Vehicles | ||
| By Propulsion Type | Internal Combustion Engine (ICE) | |
| Electric | ||
| Hybrid | ||
| Compressed Natural Gas (CNG) | ||
| By Application | Municipal Waste Collection | |
| Commercial Waste Collection | ||
| Industrial Waste Collection | ||
| By Geography | North America | United States |
| Canada | ||
| Rest of North America | ||
| South America | Brazil | |
| Argentina | ||
| Rest of South America | ||
| Europe | United Kingdom | |
| Germany | ||
| Spain | ||
| Italy | ||
| France | ||
| Russia | ||
| Rest of Europe | ||
| Asia Pacific | India | |
| China | ||
| Japan | ||
| South Korea | ||
| Rest of Asia Pacific | ||
| Middle East and Africa | United Arab Emirates | |
| Saudi Arabia | ||
| Turkey | ||
| Egypt | ||
| South Africa | ||
| Rest of Middle-East and Africa | ||


Key Questions Answered in the Report
What is the current value of the Garbage Collection Vehicle market?
The Garbage Collection Vehicle market size is USD 16.88 billion in 2025.
How fast is the market expected to grow?
Revenue is forecast to rise at a 5.11% CAGR from 2025 to 2030.
Which loader type is growing the quickest?
Automated side loaders will post the fastest 5.12% CAGR, driven by labor savings and ergonomic benefits.
Why are medium-duty trucks so popular for waste collection?
They balance payload and maneuverability, helping fleets navigate dense streets while carrying sufficient volume and delivering lower total ownership costs.
What incentives support electric garbage trucks?
U.S. federal credits up to USD 40,000 and various state rebates can bring total subsidies to USD 150,000 per vehicle, shortening payback periods.
Which region is the fastest growing?
The Middle East and Africa are projected to expand at a 5.18% CAGR through 2030, fueled by rapid urbanization and infrastructure programs.
Page last updated on:


