Truck Market Size and Share
Market Overview
| Study Period | 2019 - 2030 |
|---|---|
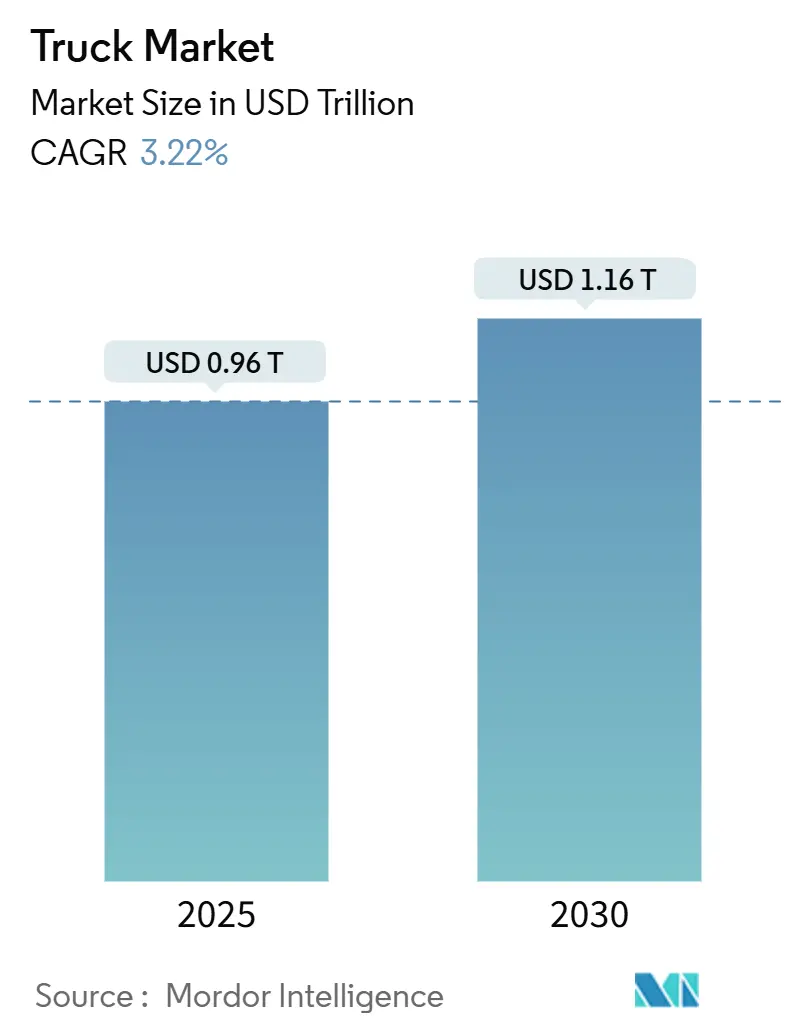
| Market Size (2025) | USD 0.96 Trillion |
| Market Size (2030) | USD 1.16 Trillion |
| Growth Rate (2025 - 2030) | 3.22% CAGR |
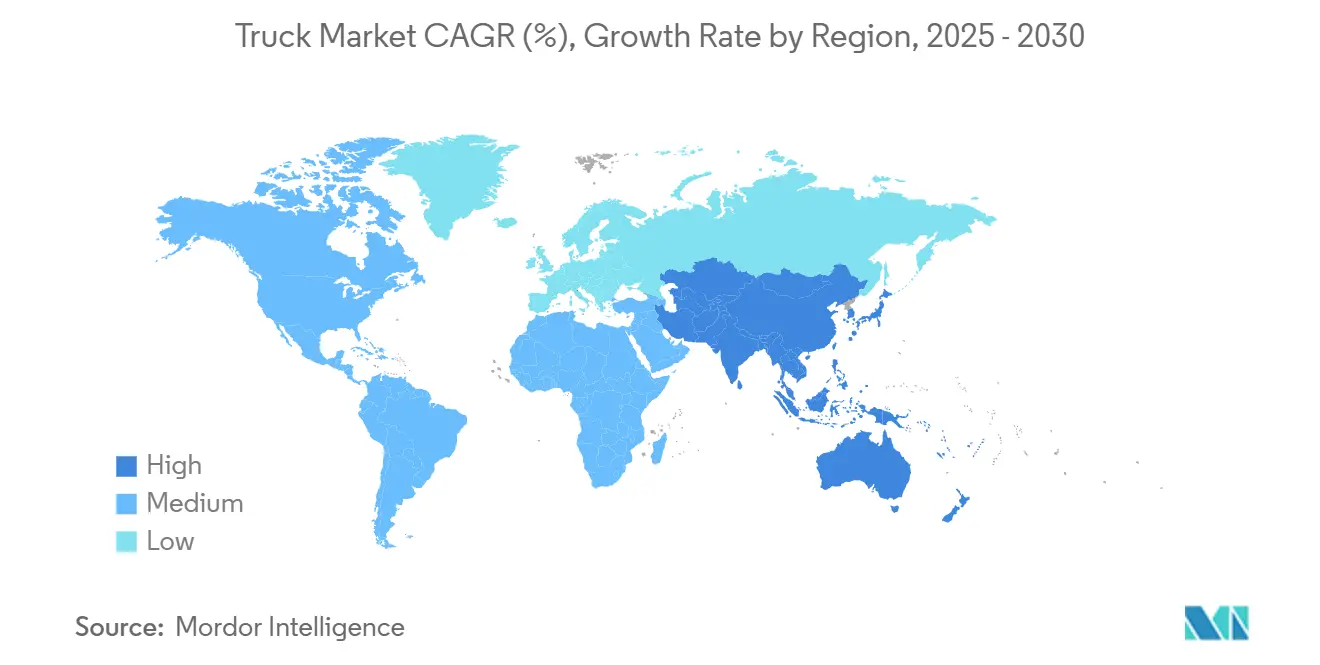
| Fastest Growing Market | Asia Pacific |
| Largest Market | Asia Pacific |
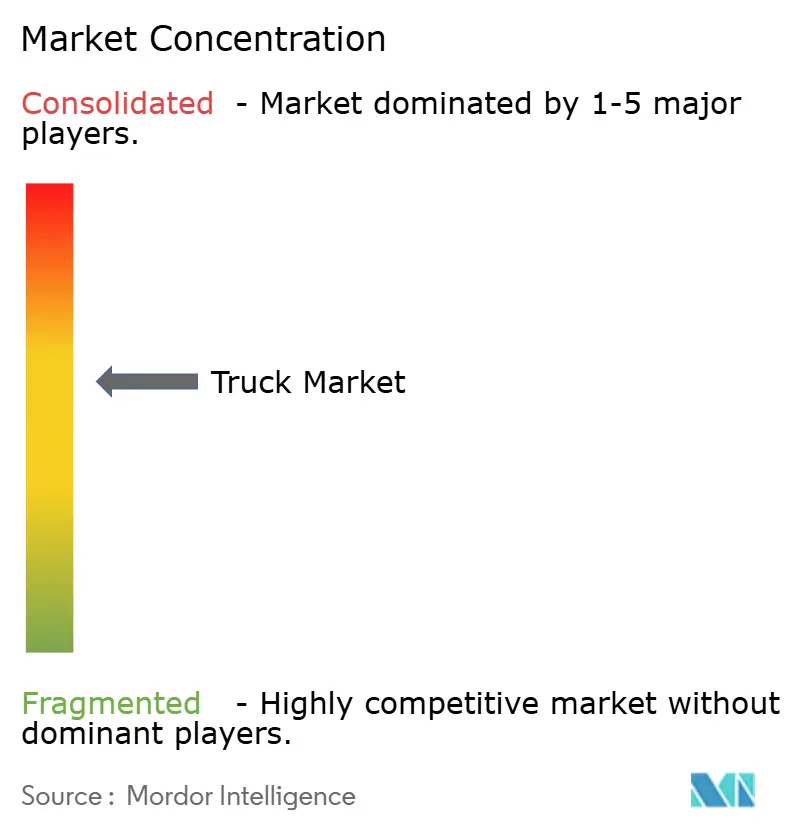
| Market Concentration | Medium |
Major Players *Disclaimer: Major Players sorted in no particular order Image © Mordor Intelligence. Reuse requires attribution under CC BY 4.0. | |
Truck Market Analysis by Mordor Intelligence
The Truck Market size is estimated at USD 0.96 trillion in 2025, and is expected to reach USD 1.16 trillion by 2030, at a CAGR of 3.22% during the forecast period (2025-2030). Demand grows as fleet operators digitize routing, adopt alternative powertrains, and deploy connected-vehicle analytics that squeeze more productivity from every mile. Electrification gains momentum once batteries hit cost parity with diesel in China and the EU, while autonomous-ready platforms shift competitive focus from engine displacement to computing power. Consolidation among professional fleets accelerates technology uptake, yet thousands of regional OEMs keep pricing competitively. Policy support for zero-emission freight and megawatt charging corridors underpins long-term investment decisions as supply-chain volatility and driver shortages test operating margins.
Key Report Takeaways
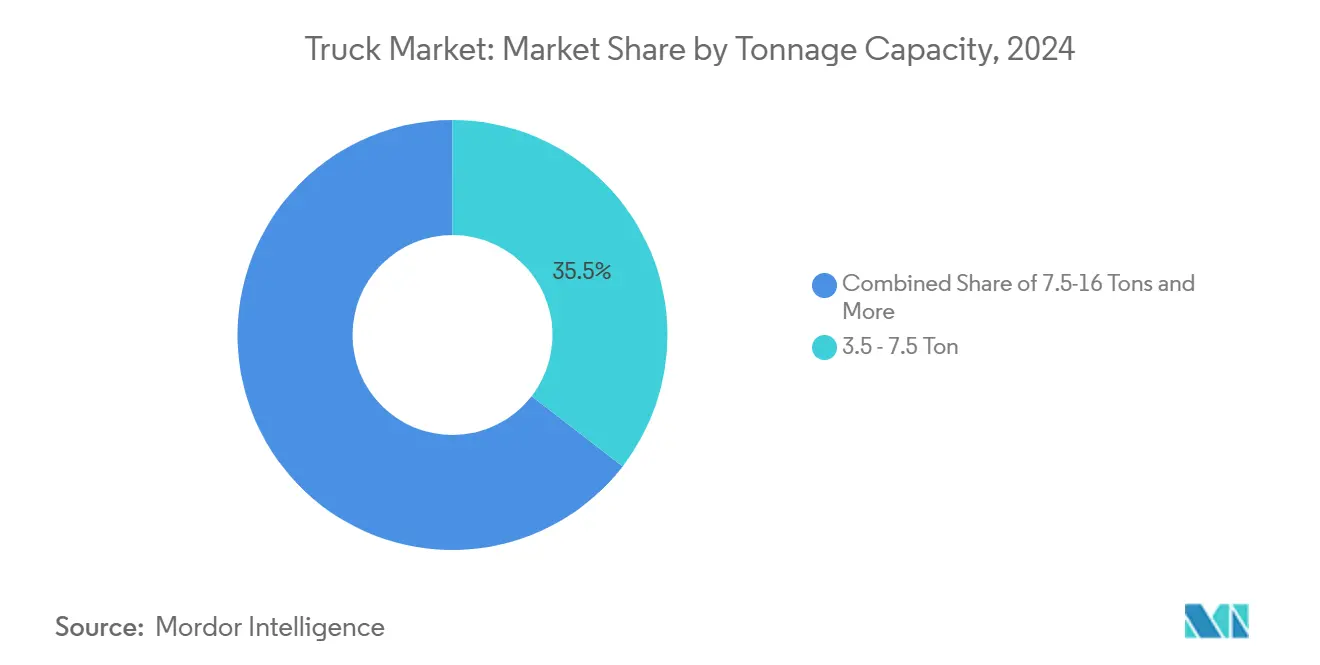
- By tonnage, the 3.5–7.5 ton class accounted for 35.47% of the share in the truck market in 2024, while the 16–30 ton segment is projected to expand at a 3.35% CAGR through the forecast period (2025-2030).
- By fuel, diesel retained an 83.21% share in the truck market in 2024; battery-electric trucks are poised for the fastest 3.25% CAGR through the forecast period (2025-2030).
- By application, logistics represented 34.48% of the share in the truck market in 2024, whereas e-commerce delivery is expected to post a 3.38% CAGR by the forecast period (2025-2030).
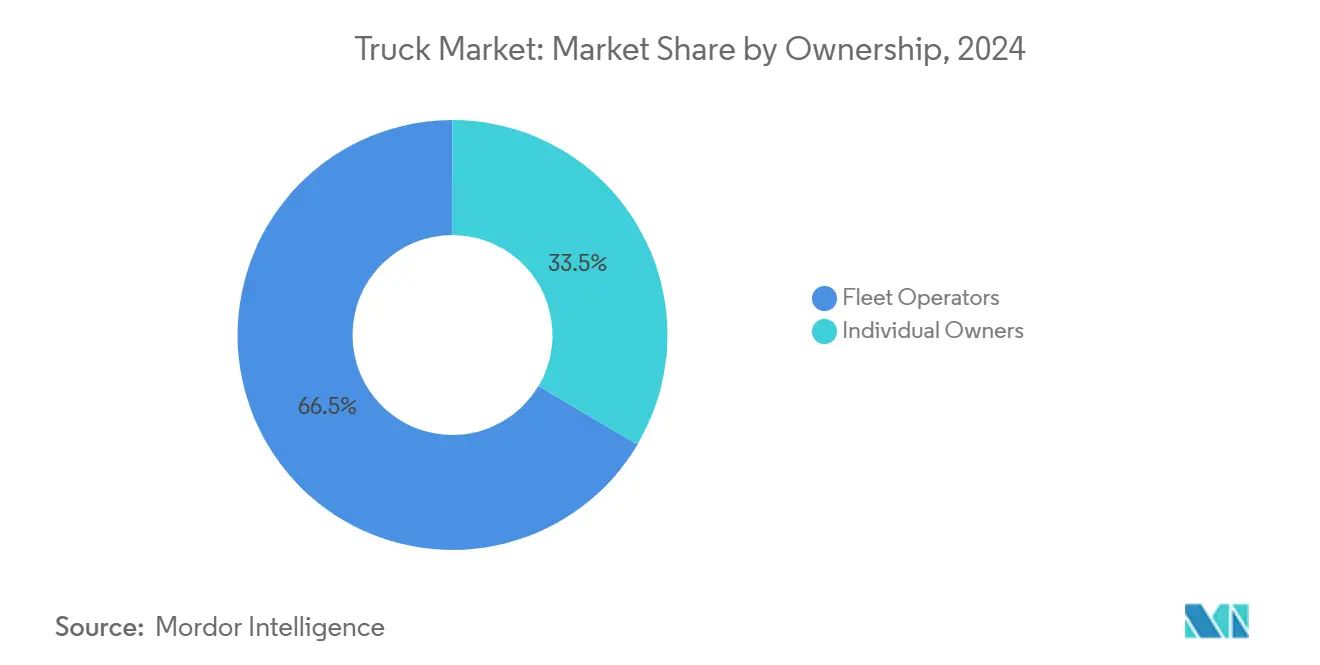
- By ownership, fleet operators held a 66.52% share of the truck market in 2024 and will grow at a 3.44% CAGR during the forecast period (2025-2030), outpacing individual owner-operators.
- By body type, box trucks captured 27.83% of the truck market's share in 2024; refrigerated units are forecast to grow at a 3.28% CAGR on cold-chain demand in the forecast period (2025-2030).
- By geography, Asia-Pacific commanded 38.71% of the truck market's share in 2024 and is expected to register the fastest 3.31% CAGR through the forecast period (2025-2030).
Global Truck Market Trends and Insights
Drivers Impact Analysis*
| Driver | (~) % Impact on CAGR Forecast | Geographic Relevance | Impact Timeline |
|---|---|---|---|
| EV Cost-Parity With Diesel | +0.8% | China, EU, North America spillover | Medium term (2-4 years) |
| E-Commerce Last-Mile Boom | +0.6% | Global, concentrated in urban centers | Short term (≤ 2 years) |
| Government Infrastructure Megaprojects | +0.5% | Global, emphasis on emerging markets | Medium term (2-4 years) |
| Mining Super-Cycle | +0.4% | Asia Pacific, Africa, Australia | Long term (≥ 4 years) |
| Megawatt Charging Corridor Build-Outs | +0.3% | North America, EU, China | Long term (≥ 4 years) |
| OEM Shift To Truck-As-A-Service Revenue Models | +0.2% | Global, led by developed markets | Medium term (2-4 years) |
| Source: Mordor Intelligence | |||
EV Cost Parity With Diesel Post-2025
As battery prices decline and diesel prices fluctuate, municipal mandates are driving the adoption of electric trucks, making them an increasingly attractive and financially viable option for urban freight operations. These factors collectively enhance the economic case for transitioning to electric trucks in urban logistics. Cities from Shanghai to Berlin restrict internal-combustion access, pushing fleets to prioritize charging compatibility and software diagnostics over mechanical durability[1]“Emission Performance Standards for Heavy-Duty Vehicles,” European Commission, europa.eu.
E-Commerce Last-Mile Boom Forces Fleet Renewal
In response to the demand for same-day delivery, truck specifications are evolving. There's a noticeable shift towards low-step, high-visibility cabs equipped with advanced telematics. These features enhance driver efficiency and safety, making them ideal for urban delivery operations. Both Amazon and regional retailers are not just upgrading their fleets every 3 to 5 years; they're also hastening the adoption of battery-electric drivetrains. These drivetrains, with their reduced per-mile costs, significantly boost profitability, especially in stop-and-start duty cycles. Additionally, the environmental benefits of battery-electric vehicles align with sustainability goals, further driving their adoption in the logistics sector. The integration of dense telematics systems also enables real-time tracking, predictive maintenance, and route optimization, which are critical for meeting the efficiency demands of same-day delivery services.
Government Infrastructure Megaprojects
Initiatives like the U.S. Infrastructure Investment and Jobs Act, India's Gati Shakti plan, and ASEAN road corridors assure the multi-year demand for concrete mixers, tippers, and low-bed trailers in the truck market. These infrastructure development programs aim to enhance connectivity, boost economic growth, and modernize transportation networks, thereby driving the need for construction equipment. Procurement clauses focusing on emissions and local content also drive the domestic assembly of alternative-fuel variants, supporting sustainability goals and fostering local manufacturing capabilities[2]“Infrastructure Investment and Jobs Act Fact Sheet,” U.S. Department of Transportation, dot.gov .
Mining Super-Cycle in Asia-Pacific & Africa
In Australia and Zambia, copper and iron-ore expansions are turning to 100-ton haulers in the truck market. These haulers test autonomous systems in remote pits, acting as proving grounds before transitioning to on-road freight. Adopting autonomous systems in these mining operations aims to enhance efficiency, reduce operational costs, and improve safety standards. For these heavy-duty OEMs, the reliability of payloads takes precedence over fuel economy, allowing them to maintain premium pricing[3]“Mineral Commodity Summary: Copper,” U.S. Geological Survey, usgs.gov .
Restraints Impact Analysis*
| Restraint | (~) % Impact on CAGR Forecast | Geographic Relevance | Impact Timeline |
|---|---|---|---|
| Nickel & Lithium Supply-Chain Volatility | -0.4% | Global, concentrated in battery production regions | Short term (≤ 2 years) |
| Driver Shortages | -0.3% | North America, Europe, developed markets | Medium term (2-4 years) |
| Geopolitical Freight-Rate Shocks | -0.2% | Global, concentrated on major trade routes | Short term (≤ 2 years) |
| Patchy LNG/CNG Refuelling Networks | -0.1% | Global, emphasis on emerging markets | Long term (≥ 4 years) |
| Source: Mordor Intelligence | |||
Nickel & Lithium Supply-Chain Volatility
Rising nickel royalties in Indonesia and surging lithium conversion costs in China are shaking up battery prices. These developments are compelling OEMs to hedge against metal price fluctuations to mitigate risks. Additionally, the uncertainty in pricing is causing delays in purchase orders for electric trucks, further impacting the supply chain and market dynamics.
Driver Shortages in North America & Europe
With a shortfall in the number of skilled drivers in the United States, wages are rising, delivery schedules are feeling the pinch, and there's a growing fascination with autonomous pilots as a potential remedy for these labor challenges in the coming decade in the truck market. This driver shortage has created significant disruptions across the logistics and transportation industry, pushing companies to explore innovative solutions. Autonomous driving technology, in particular, is being viewed as a long-term strategy to address labor shortages, improve efficiency, and reduce dependency on human drivers. Over the next decade, advancements in this technology could play a pivotal role in reshaping the industry.
*Our forecasts treat driver/restraint impacts as directional, not additive. The impact forecasts reflect baseline growth, mix effects, and variable interactions.
Segment Analysis
By Tonnage Capacity: Mid-Range Growth Acceleration
Through its flexible application profile, the 3.5–7.5 ton category held a 35.47% share of the truck market in 2024. Truck market share leadership here supports platform economies of scale for global OEMs.
Mid-range payloads match consolidation trends in distribution hubs. At the same time, 16–30 ton trucks grow by 3.35% CAGR during the forecast period (2025- 2030) as infrastructure projects raise demand for higher capacity without CDL licensing hurdles. Investments in aerodynamic cabs and direct-vision glazing anticipate EU safety rules that come into force after 2028.


By Fuel Type: Electric Transition Accelerates
Diesel’s Segment commands an 83.21% share of the truck market in 2024, narrowing yearly as urban access rules favor zero-tailpipe emission drivetrains. Electric models log a 3.25% CAGR, lifting their truck market share significantly during the forecast period (2025-2030).
Hydrogen fuel-cell pilots tackle long-haul constraints where battery weight penalizes payload. Partnerships between Daimler Truck and Paul Nutzfahrzeuge introduce a modular chassis to host battery or hydrogen storage, offering fleets hedged technology options under a common service ecosystem.
By Application: Logistics Leadership With E-Commerce Surge
Logistics services contributed a 34.48% share in the truck market in 2024, reflecting trade flows and integrated supply-chain outsourcing. E-commerce delivery grows fastest at 3.38% CAGR during the forecast period (2025-2030), pushing specialized body designs with automated parcel lockers and temperature partitions for grocery orders.
Route-planning algorithms that increase daily stops tilt the total cost of ownership in favor of electrification. At the same time, telematics confirm payload conformity and delivery punctuality to retain third-party logistics contracts.
By Ownership: Fleet Consolidation Continues
The fleet operator segment captured a 66.52% share of the truck market in 2024 as carriers leveraged volume discounts on procurement and fuel. The segment is expected to advance at a 3.44% CAGR during the forecast period (2025-2030), widening the gap with individual operators, whose share erodes under compliance and capital pressures.
Truck-as-a-Service bundles reduce upfront investment, making asset-light logistics firms more competitive. Compliance with revised Federal Motor Carrier Safety Administration safety metrics pushes telematics and drug-testing digitization that large fleets can spread over bigger asset bases.
By Body Type: Box Trucks Lead Specialization Trends
Box bodies held a 27.83% share of the truck market in 2024 due to secure, weather-proof cargo needs. Refrigerated variants post a 3.28% CAGR during the forecast period (2025-2030) as pharmaceutical cold chains globalize.
Shippers and regulators alike now rely on real-time compliance dashboards, driven by the integration of sensors that monitor payloads, control humidity, and trace temperatures. These advancements ensure enhanced visibility, improved regulatory adherence, and optimized operational efficiency across the supply chain.
Geography Analysis
Asia-Pacific controlled a 38.71% share in the truck market in 2024 and is forecast to clock a 3.31% CAGR during the forecast period (2025-2030), as China’s export machine and India’s infrastructure pipeline swell freight volumes. Electric penetration in Chinese urban fleets topped one-tenth last year, underwritten by municipal subsidies and dense charging nodes[4]“New Energy Commercial Vehicle Sales 2024,” Ministry of Industry and Information Technology, miit.gov.cn . India channels budgetary outlays into highways and dedicated freight corridors, catalyzing purchases of both light-duty delivery vans and multi-axle tipper trucks. Japan and South Korea prioritize autonomous and hydrogen prototypes, positioning regional suppliers at the technology frontier.
North America is mature yet innovation-heavy, with California’s Advanced Clean Truck rule setting de facto national benchmarks on zero-emission targets. Driver shortages tighten capacity, pushing fleets toward larger trailers and advanced safety systems that widen the vehicle utilization window. Canada’s resource projects and Mexico’s maquiladora output sustain cross-border traffic that benefits from the United States-Mexico-Canada Agreement’s harmonized equipment standards.
Europe presents high regulatory complexity and accelerated decarbonization in the truck market. Low-emission zones in 250+ cities create captive demand for electric rigids, while Euro VII draft standards will reshape diesel engine investments by 2027. Brexit-related labor frictions exacerbate driver gaps, and EU Direct Vision requirements drive cab redesigns. OEM joint ventures, such as Volvo-Daimler software tie-ups, illustrate collaborative responses to steep R&D bills for connected, autonomous, shared, electric fleets.
Mordor Intelligence provides coverage of the truck market across other key regional markets. Detailed country-level analysis extends to India and Egypt incorporating local coverage and market participation, as required.

Competitive Landscape
Global truck competition stays moderately consolidated: the top five OEMs hold roughly around three-fifths of unit shipments, which signals balanced rivalry rather than dominance. Daimler Truck and Volvo Group defend their share through service networks and captive financing, while PACCAR keeps profitability via premium long-haul models. Chinese entrants BYD and Sinotruk extend into Southeast Asia, Africa, and Europe with aggressive pricing and localized assembly incentives.
Technology forms the new battleground in the truck market. Software-defined vehicle architectures compress development cycles and enable continuous feature rollouts that mimic smartphone refresh dynamics. The proposed merger of Toyota’s Hino Motors with Daimler’s Mitsubishi Fuso aims to pool electric and connectivity investments, illustrating scale economics in R&D. Start-ups focus on battery or autonomous niches. Still, high capital intensity pushes many toward supplier or Tier 1 partnerships.
Fleet customers increasingly assess lifetime service costs, uptime guarantees, and digital integration over horsepower alone. That shift favors incumbents with established dealer footprints yet rewards agile challengers when fleets trial specialized electric or autonomous pilots unencumbered by legacy platforms. Over the forecast horizon, product roadmaps will hinge on modular chassis that accept a spectrum of propulsion systems to hedge regulatory uncertainty.
Truck Industry Leaders
Daimler Truck AG
Volvo Group
Traton SE
Dongfeng Motor Corp.
Paccar Inc.
- *Disclaimer: Major Players sorted in no particular order

Recent Industry Developments
- June 2025: Toyota’s Hino Motors and Daimler’s Mitsubishi Fuso finalize plans for a truck division merger aimed at an April 2026 listing on the Tokyo Stock Exchange.
- March 2025: Ford Trucks, the heavy commercial arm of Ford Otosan, and IVECO, a brand under Iveco Group N.V. known for its range of commercial vehicles, have inked a binding Joint Development Agreement (JDA). This collaboration focuses on designing and engineering a new cabin tailored for heavy-duty trucks
- October 2024: Volvo Group and Daimler Truck close a 50/50 venture to create a software-defined platform supporting advanced driver assistance and over-the-air upgrades.


Global Truck Market Report Scope
| Light Duty |
| Medium Duty |
| Heavy Duty |
| 3.5–7.5 Tons |
| 7.5–16 Tons |
| 16–30 Tons |
| Above 30 Tons |
| Diesel |
| Petrol |
| CNG / LNG |
| Electric |
| Logistics |
| Construction |
| Agriculture |
| Mining |
| Utility |
| Others |
| Fleet Operators |
| Individual Owners |
| Flatbed |
| Box Truck |
| Refrigerated |
| Tanker |
| Tipper |
| North America | United States |
| Canada | |
| Rest of North America | |
| South America | Brazil |
| Argentina | |
| Rest of South America | |
| Europe | United Kingdom |
| Germany | |
| Spain | |
| Italy | |
| France | |
| Russia | |
| Rest of Europe | |
| Asia Pacific | India |
| China | |
| Japan | |
| South Korea | |
| Rest of Asia Pacific | |
| Middle-East and Africa | United Arab Emirates |
| Saudi Arabia | |
| Turkey | |
| Egypt | |
| South Africa | |
| Rest of Middle-East and Africa |
| By Vehicle Type | Light Duty | |
| Medium Duty | ||
| Heavy Duty | ||
| By Tonnage Capacity | 3.5–7.5 Tons | |
| 7.5–16 Tons | ||
| 16–30 Tons | ||
| Above 30 Tons | ||
| By Fuel Type | Diesel | |
| Petrol | ||
| CNG / LNG | ||
| Electric | ||
| By Application | Logistics | |
| Construction | ||
| Agriculture | ||
| Mining | ||
| Utility | ||
| Others | ||
| By Ownership | Fleet Operators | |
| Individual Owners | ||
| By Body Type | Flatbed | |
| Box Truck | ||
| Refrigerated | ||
| Tanker | ||
| Tipper | ||
| By Geography | North America | United States |
| Canada | ||
| Rest of North America | ||
| South America | Brazil | |
| Argentina | ||
| Rest of South America | ||
| Europe | United Kingdom | |
| Germany | ||
| Spain | ||
| Italy | ||
| France | ||
| Russia | ||
| Rest of Europe | ||
| Asia Pacific | India | |
| China | ||
| Japan | ||
| South Korea | ||
| Rest of Asia Pacific | ||
| Middle-East and Africa | United Arab Emirates | |
| Saudi Arabia | ||
| Turkey | ||
| Egypt | ||
| South Africa | ||
| Rest of Middle-East and Africa | ||


Key Questions Answered in the Report
What is the projected value of the global truck market in 2030?
The truck market is expected to reach USD 1.16 trillion by 2030.
Which truck segment is growing the fastest by tonnage?
Vehicles in the 16–30 ton range are set to grow at a 3.35% CAGR through 2030.
How large is Asia-Pacific’s share of global truck sales?
Asia-Pacific held 38.71% of global sales revenue in 2024.
Why are electric trucks gaining ground in urban logistics?
Battery price declines, per-mile operating costs are lower, and city emission zones favor electric drivetrains for stop-start delivery routes.
What factor limits electric truck production growth the most?
Volatile nickel and lithium supply chains raise battery costs and constrain rollout schedules.
Page last updated on:


