Market Overview
| Study Period | 2019 - 2031 |
|---|---|
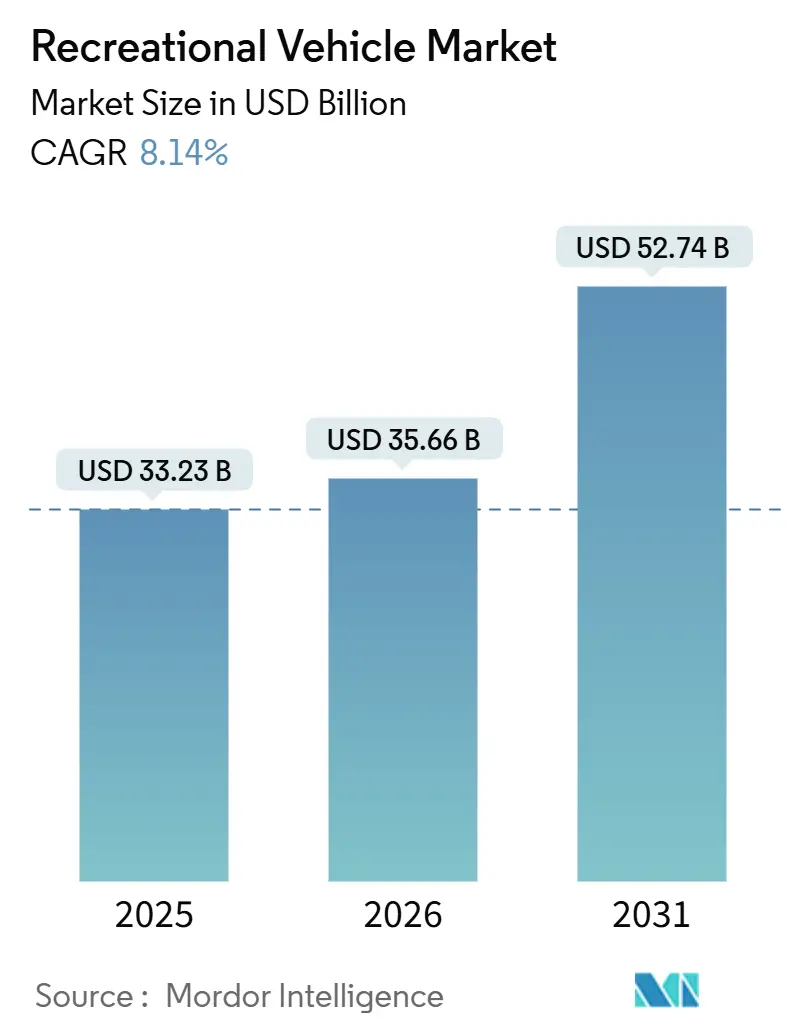
| Market Size (2026) | USD 35.66 Billion |
| Market Size (2031) | USD 52.74 Billion |
| Growth Rate (2026 - 2031) | 8.14% CAGR |
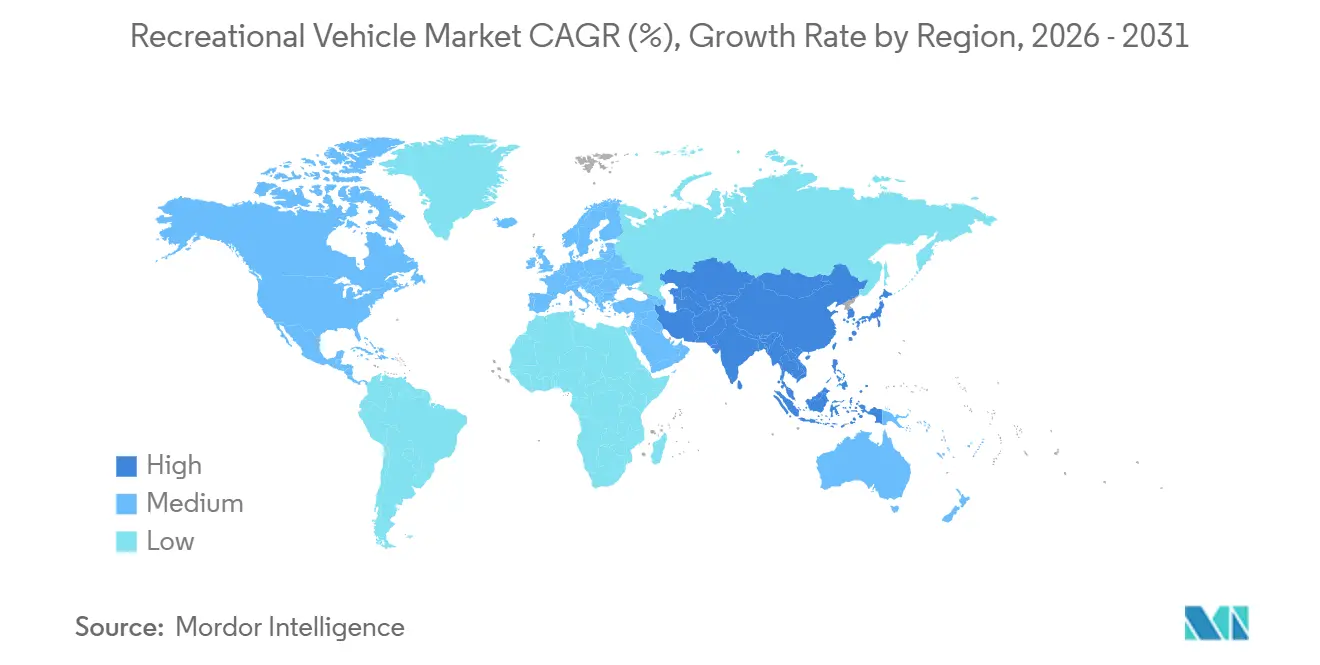
| Fastest Growing Market | Asia-Pacific |
| Largest Market | North America |
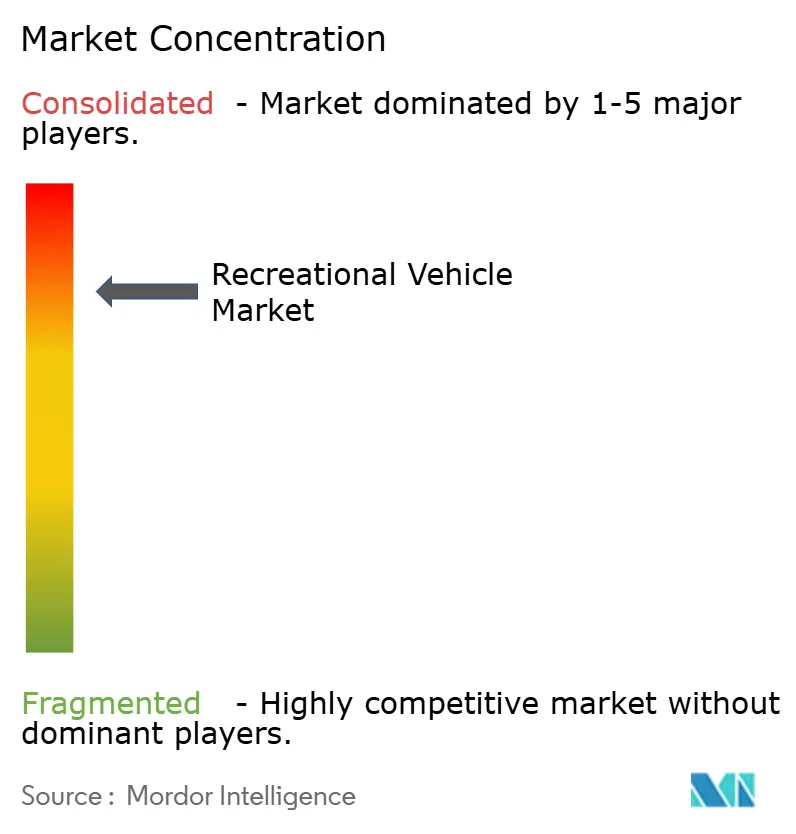
| Market Concentration | High |
Major Players *Disclaimer: Major Players sorted in no particular order Image © Mordor Intelligence. Reuse requires attribution under CC BY 4.0. | |
Recreational Vehicle Market Analysis by Mordor Intelligence
The recreational vehicle market size was valued at USD 33.23 billion in 2025 and estimated to grow from USD 35.66 billion in 2026 to reach USD 52.74 billion by 2031, at a CAGR of 8.14% during the forecast period (2026-2031). Towable units anchor present demand, yet momentum is shifting toward motorhomes as electrified drivetrains and compact Class B camper vans broaden appeal among younger first-time buyers. A resilient remote-work culture, surging domestic tourism, and expanding peer-to-peer rental platforms collectively reinforce the revenue base, while original equipment manufacturer vertical-integration moves aim to secure components and protect aftermarket profit pools. Headwinds include high interest rates that push loan APRs into the 9.5%–13.5% range, persistent chassis bottlenecks linked to semiconductor shortages, and tightening municipal rules that constrain free overnight parking in urban corridors. Notwithstanding these frictions, strategic electrification roadmaps, online direct-sales pilots, and subscription-based connectivity services position incumbents to capture fresh value streams.
Key Report Takeaways
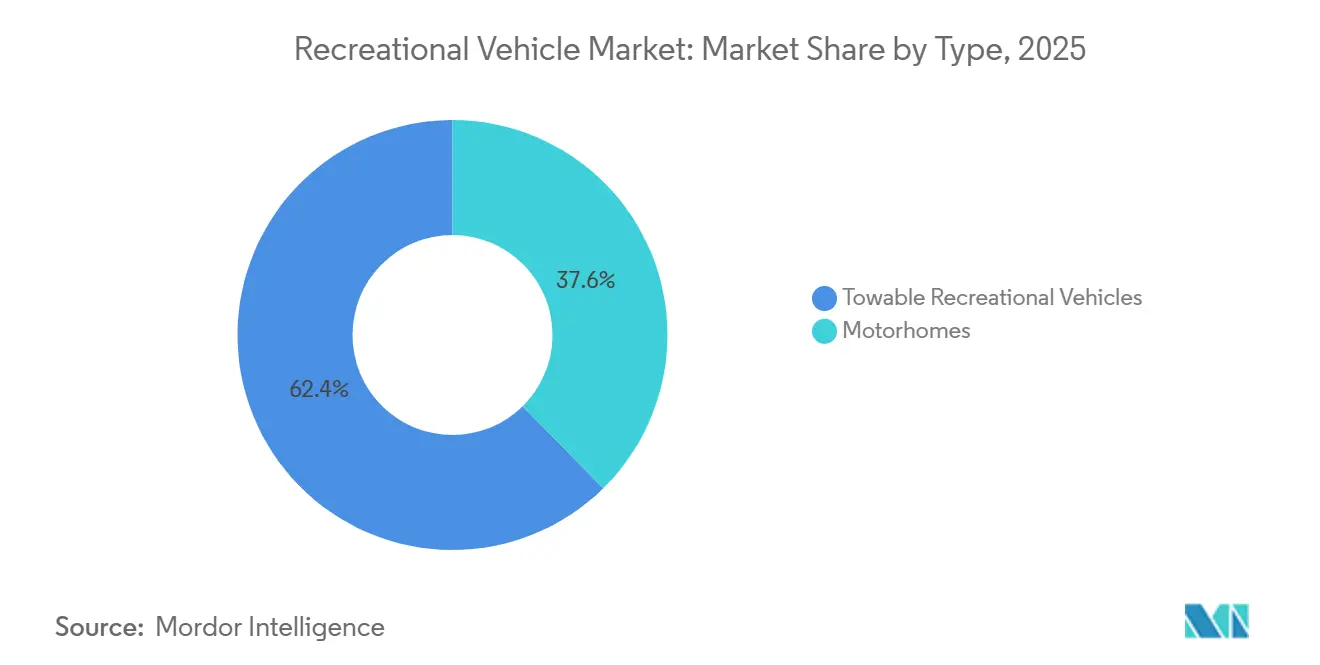
- By type, towable models led with 62.44% revenue in 2025 in the recreational vehicle market, while motorhomes are projected to log the fastest 9.26% CAGR through 2031.
- By application, domestic use held 70.63% of the recreational vehicle market share in 2025, whereas commercial deployments are set to expand at an 8.54% CAGR to 2031.
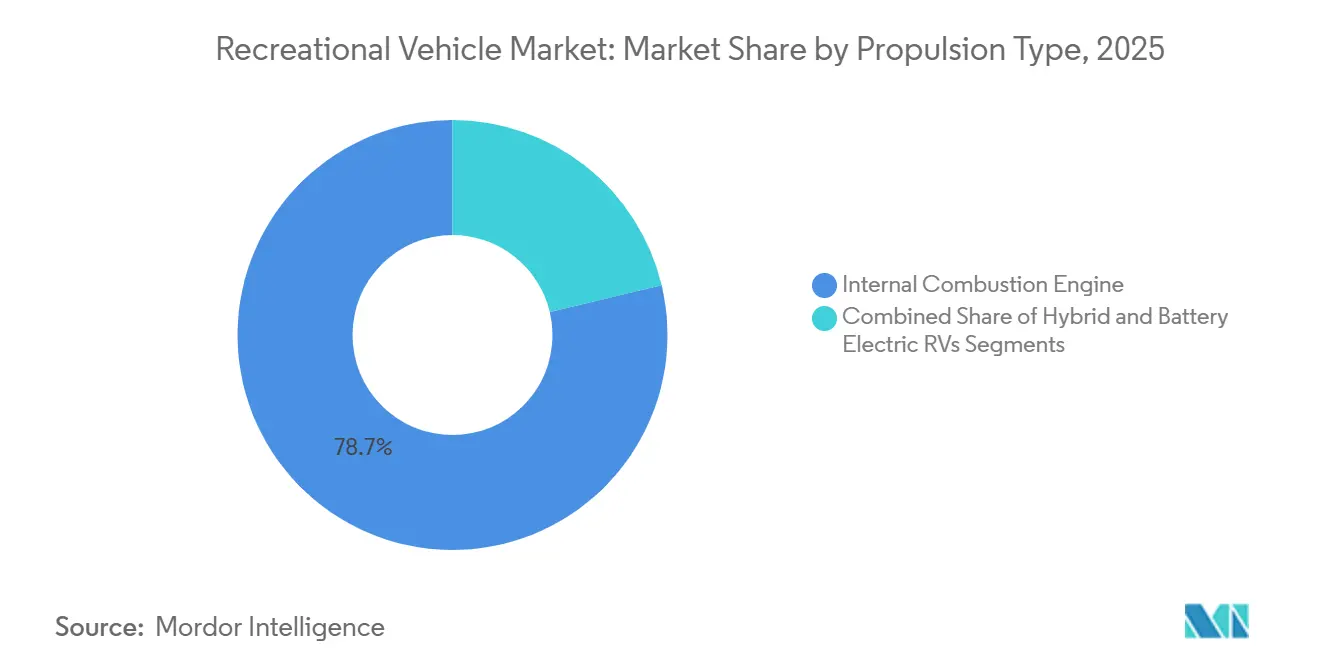
- By propulsion, the internal combustion engine retained 78.71% of segment revenue in 2025 in the recreational vehicle market, while battery-electric lines are expected to post a 23.24% CAGR over the forecast window.
- By length, 20 to 30 feet units accounted for 55.73% of the recreational vehicle market size in 2025; sub-20 ft models are on track for a 9.28% CAGR to 2031.
- By geography, North America captured 59.52% revenue in 2025, while Asia-Pacific is forecast to grow at a 9.54% CAGR to 2031.
Note: Market size and forecast figures in this report are generated using Mordor Intelligence’s proprietary estimation framework, updated with the latest available data and insights as of January 2026.
Global Recreational Vehicle Market Trends and Insights
Drivers Impact Analysis*
| Driver | (~) % Impact on CAGR Forecast | Geographic Relevance | Impact Timeline |
|---|---|---|---|
| Mobile Living Demand from Remote Work | +1.8% | Global, with concentration in North America and Europe | Medium term (2-4 years) |
| Domestic Tourism Growth | +1.5% | North America and Asia-Pacific core, spill-over to Europe | Short term (≤ 2 years) |
| RV Financing and Peer Rentals Expanding | +1.2% | Global, early gains in North America, expanding to Europe | Medium term (2-4 years) |
| OEM Zero-Emission RV Roadmaps | +0.9% | North America and Europe regulatory zones, emerging in Asia-Pacific | Long term (≥ 4 years) |
| OTA Connectivity Driving Subscriptions | +0.7% | Global, with premium segment concentration | Medium term (2-4 years) |
| Online Sales Cutting Dealer Margins | +0.5% | Global, accelerated in digitally mature markets | Short term (≤ 2 years) |
| Source: Mordor Intelligence | |||
Remote-Work Culture Sustaining Mobile Living Demand
In the recreational vehicle market, Most of the campers worked from campsites in 2025, indicating that recreational vehicles (RVs) are now doubling as hybrid offices[1]“Remote Workers Take Office on Wheels,” Emily Canal, Inc., inc.com. Younger owners gravitate toward Class B vans outfitted with LTE routers, solar arrays, and fold-down desks, prompting OEMs to add Starlink-ready mounts and 120-volt inverters as standard features on 2025 models. Campground operators responded by upgrading electrical pedestals to 50-amp service and installing fiber-optic Wi-Fi; KOA registered a 95% franchise-renewal rate as park owners reinvested to capture extended-stay bookings. The shift blurs the boundary between leisure and residential real estate, creating dependable off-season occupancy and elevating ancillary revenue from long-term site leases. However, unresolved tax guidance on depreciation deductions for mobile offices creates compliance risk that could temper adoption.
Domestic Tourism Boom and Campground Infrastructure Growth
Border closures earlier in the decade redirected leisure spending to domestic road trips, and the habit persisted as airlines reinstated fuel surcharges in 2025. Australia logged 15.3 million caravan and camping trips in 2023, generating AUD 14.3 billion (USD 9.5 billion) in spending. In the United States, state park systems collectively earmarked more than USD 200 million in 2024 for electrification and wastewater hookups, increasing suitability for larger motorhomes. Private-equity groups such as Sun Communities acquired 12 RV-resort portfolios, standardized amenities, and lifted nightly rates 8%–12% in high-demand corridors. The recreational vehicle market benefits directly from the capacity build-out, yet peak-season occupancy exceeding 95% at flagship parks funnels spontaneous travelers toward dispersed public lands where services are minimal and regulatory enforcement is inconsistent. Rising fees could spark affordability concerns for entry-level campers if wage growth lags.
Expansion of RV Financing and Peer-To-Peer Rental Platforms
Peer-to-peer networks democratize access by allowing owners to monetize idle vehicles. Outdoorsy alone passed USD 3 billion in cumulative bookings by 2024 and pays hosts an 80% revenue share. As average transaction values rise, lenders stretch terms to 120-180 months, yet a single percentage-point uptick in the federal funds rate historically trims towable originations 6%–8% within two quarters. Rental income softens ownership costs, but insurance carriers tighten underwriting on commercialized units, nudging hosts toward captive offerings such as Roamly. Buy-now-pay-later schemes for upgrades fragment billing, obscuring the total cost of ownership and raising credit-quality scrutiny. Overall, financing innovations expand the recreational vehicle market yet amplify sensitivity to broader monetary policy.
OEM Electrification Road-Maps For Zero-Emission RV Lines
Prototypes translate into production as Winnebago’s eRV2 targets a 125-mile range on a 60 kWh pack, and Thor Industries announced a hybrid Class A model on Harbinger’s electric chassis in April 2025. Early offerings carry 40%-plus price premiums, reflecting battery costs near USD 120 per kWh. Infrastructure lags: fewer than 5% of private campgrounds installed Level 2 chargers by mid-2025, and public DC fast-charging networks prohibit trailer-towing, forcing owners to unhitch. Range anxiety narrows the addressable market to urban commuters and weekend travelers, yet California’s medium-duty zero-emission targets, although excluding RVs for now, hint at future regulatory pressure. Incremental battery density improvements over the forecast horizon could unlock Class B urban-delivery chassis that migrate into RV duty cycles, expanding use cases.
Restraints Impact Analysis*
| Restraint | (~) % Impact on CAGR Forecast | Geographic Relevance | Impact Timeline |
|---|---|---|---|
| High Loan Costs | -1.4% | Global, with acute impact in North America and Europe | Short term (≤ 2 years) |
| Chassis and Component Supply Bottlenecks | -1.2% | Global, concentrated in North America and Europe manufacturing hubs | Medium term (2-4 years) |
| Used Recreational Vehicle Oversupply | -1.1% | North America core, spreading to Europe | Medium term (2-4 years) |
| Urban Parking Crackdowns | -0.8% | North America and EU urban centers, expanding globally | Long term (≥ 4 years) |
| Source: Mordor Intelligence | |||
High Interest-Rate Environment Inflating Loan Costs
Credit remains tight even as rates ease, curbing demand in price-sensitive towable categories[2]“Auto Loan Rates Show Early Signs of Cooling,” Kate Rooney, CNBC, cnbc.com. The Federal Reserve held its target rate at 5.25%–5.50% throughout 2025, pushing RV loan APRs into a 9.5%–13.5% band, adding USD 150–USD 250 to monthly payments on a USD 50,000 towable financed over 15 years. Subprime borrowers faced rates near 20%, effectively excluding them from the new-unit market and swelling demand for aging used inventory. Winnebago’s Q1 FY 2025 revenue slid 19.5% to USD 550.6 million, with floorplan interest expense squeezing dealer orders. Lenders raised minimum down payments to 15%, further dampening first-time buyer traffic. Monetary easing would provide an immediate volume catalyst, but rate volatility will keep affordability center stage.
Oversupply of Used RVs Driving Price Depreciation
Pandemic-era buying sprees flooded secondary channels as early adopters pivoted back to airline travel, expanding dealer used-unit inventories to roughly 88,000 by late 2024, 22% above historical norms. Auction consignments at Manheim and ADESA climbed 18%, while sell-through rates dipped to 62%, signaling buyer price resistance. Lower residual values undermine trade-in equity, deterring upgrades to new models and lengthening replacement cycles. Peer-to-peer rentals absorb some excess capacity, yet average host earnings of USD 8,500 barely cover loan payments at prevailing interest rates. The depreciation flywheel remains a material drag on the recreational vehicle market until retail demand fully digests the glut.
*Our forecasts treat driver/restraint impacts as directional, not additive. The impact forecasts reflect baseline growth, mix effects, and variable interactions.
Segment Analysis
By Type: Motorhomes Drive Premium Growth
Towable recreational vehicles accounted for 62.44% of 2025 shipments within the recreational vehicle market, buoyed by lower entry prices and compatibility with existing pickups. Travel trailers span 16- to 35-foot floorplans, serving everyone from minimalist couples to large families, whereas fifth-wheels attract long-haul travelers who value gooseneck stability. Folding campers and truck-bed units address garage-height or off-road constraints, broadening demographic reach.
Motorhomes are projected to outpace towables at a 9.26% CAGR through 2031, powered by compact Class B vans on Mercedes Sprinter and Ford Transit chassis that resonate with younger buyers prioritizing drivability. Folding campers cater to storage-challenged owners, but competition from micro motorhomes dampens growth prospects. THOR’s move to consolidate Entegra Coach’s diesel-pusher production under Tiffin enhances scale efficiencies and signals continued rationalization in high-price motorhome lines[3]“Hybrid Class A Launch Details,” THOR Industries, thorindustries.com. Class A luxury coaches maintain premium status but face volume pressure from high fuel costs and price tags north of USD 200,000. Class C rigs offer balanced handling and interior space, appealing to young families. Electrification and hybridization will intensify competition as OEMs repurpose delivery-van platforms into human-habitat configurations, expanding the recreational vehicle market footprint.


By Application: Commercial Segment Emerges
Domestic ownership represented 70.63% of 2025 demand, reflecting weekend camping, extended road trips, and a growing cohort of full-timers estimated at 1 million United States households. Retirees gravitate toward Class A rigs for seasonal migrations, while working families choose towables that can be parked seasonally. Fifty-four percent of remote-work households perform their jobs from an RV, blending leisure and livelihood.
Commercial deployments, advancing at an 8.54% CAGR, leverage peer-to-peer rentals, fleet hospitality at events, and mobile command centers. Cruise America and El Monte operate roughly 8,000 traditional rentals, but platform listings exceed 50,000, dispersing supply to secondary markets. Corporate users retrofit luxury coaches as boardrooms on wheels, commanding daily rates above USD 1,000. Rising commercial utilization diversifies revenue and insulates the recreational vehicle market from pure retail cycles.
By Propulsion: Electrification Accelerates
Internal combustion engine (ICE) platforms held 78.71% of 2025 revenue, underpinned by torque advantages and fueling convenience on cross-country itineraries. Yet regulatory tailwinds push battery-electric and hybrid variants to a 23.24% CAGR through 2031, nudging the recreational vehicle (RV) market toward parity with light-duty automotive electrification. Gasoline variants benefit from ubiquitous service networks, whereas diesel options deliver superior torque and range for high-mileage travelers. Hybrid powertrains remain nascent but gather interest through Thor–Harbinger collaborations targeting 300-mile ranges.
Battery-electric recreational vehicles, albeit a sub-1% niche, are forecast to post a 23.24% CAGR to 2031 as Winnebago and Grech commercialize early models. Charging gaps and payload penalties temper near-term adoption, yet falling battery costs and targeted infrastructure corridors could unlock mainstream potential mid-decade. Segment economics will hinge on the total cost of ownership once energy prices, incentives, and maintenance differentials crystallize.

By Length Category: Compact Units Gain Traction
Models measuring 20–30 feet held 55.73% share in 2025, aligning with common campground pad limits and half-ton pickup tow ratings. A 25-foot travel trailer can return 10–12 mpg when paired with a Ford F-150, balancing fuel costs and livable space. Above-30-foot luxury fifth-wheels and Class A coaches retain a 25% share among retirees seeking residential-grade amenities.
Sub-20-foot rigs—teardrops, micro trailers, and Class B vans—will log a 9.28% CAGR to 2031, aided by urban parking constraints and daily-driver aspirations. Regulatory limits in national parks often cap length at 27 feet, reinforcing demand for compact formats. As city centers tighten emissions and space restrictions, nimble footprints will gain share, extending the recreational vehicle market into previously unreachable demographics.
Geography Analysis
North America commanded a dominant 59.52% share of the global RV revenue in 2025, buoyed by 11.2 million RV-owning households in the United States and a robust network of 2,500 dealers. However, Thor Industries faced a setback, with North American sales dipping 13.4% year-over-year to USD 1.68 billion in Q1 FY 2026, primarily due to high APRs that tempered dealer orders. While dealer inventory levels shifted, other dynamics played out: used-unit depreciation and municipal parking bans in California nudged travelers towards fee-based campsites, much to the delight of campground operators. Canada's advantage lies in its closeness to the United States supply chains and the allure of currency-driven cross-border purchases. In contrast, Mexico's RV market remains a niche player, hampered by a sparse campground density.
Asia-Pacific is the fastest-growing territory at a projected 9.54% CAGR, led by Australia’s 908,513 registered caravans and motorhomes, up 21% since 2019. The country manufactured 25,185 units in 2024 but imported nearly 20,000, 95% from Chinese factories that undercut local pricing by USD 8,000–USD 12,000. China sold 14,365 units, becoming the fourth-largest national market despite infrastructure shortfalls—Guangdong hosts fewer than 20 dedicated campsites. Japanese and South Korean demand centers on micro campers based on the Toyota HiAce and Hyundai Staria platforms that navigate narrow urban streets.
Europe’s entrenched players—Trigano, Knaus Tabbert, and Hymer—face a cautious consumer backdrop: Trigano’s half-year FY 2024/25 revenue slipped 5.9% to EUR 1.56 billion (USD 1.69 billion). Germany’s emissions zones and elevated diesel prices weigh on motorhome appetite, while the United Kingdom digests post-Brexit tariff friction. Southern markets such as Spain and Portugal enjoy milder climates, sustaining off-season utilization. Eastern Europe represents untapped potential but requires campground investment and financing access to unlock demand. Collectively, Europe contributes roughly one-quarter of the recreational vehicle market, though growth lags North America and Asia-Pacific.

Competitive Landscape
Thor Industries, Forest River, and Winnebago collectively hold a significant portion of North American output, establishing a highly concentrated structure. Thor’s December 2024 purchase of Airxcel for USD 462 million secures proprietary HVAC supply and underpins margin capture in the aftermarket. Lippert Components’ acquisition of Furrion integrates smart-appliance know-how, strengthening OEM bargaining power. Chinese entrants leverage cost advantages to gain traction in Australia and probe European distribution, pressuring incumbents to emphasize build quality, dealer service, and brand equity.
Grand Design, now a Winnebago division, forced warranty-length extensions across the towable segment after standardizing a three-year structural coverage. Subscription services such as Winnebago Connect and Airstream’s AT&T broadband partnerships open recurring-revenue lanes that hedge cyclical demand. Direct-to-consumer pilots compress dealer margins, accelerating consolidation; roughly 10% of United States dealerships closed or merged in 2024. Regulatory compliance remains a barrier to entry, as meeting Federal Motor Vehicle Safety Standards requires hefty engineering budgets, yet the absence of strict emissions rules for RVs postpones a transformational shift until battery costs drop further.
New market entrants align with electrification niches: Harbinger supplies electric chassis to Thor, while Grech targets premium Class B buyers with lithium-ion-powered vans. Peer-to-peer platforms such as Outdoorsy operate asset-light models that disrupt traditional rental chains without bearing inventory risk. Strategic focus in 2026 centers on vertical integration, connected-vehicle platforms, and flexible retail models that combine online configuration with in-store service, positioning majors to defend share as the recreational vehicle market matures.
Recreational Vehicle Industry Leaders
Thor Industries Inc.
Forest River Inc.
Winnebago Industries Inc.
REV Group Inc.
Trigano SA
- *Disclaimer: Major Players sorted in no particular order

Recent Industry Developments
- May 2025: Winnebago, a recreational vehicle manufacturer with over 60 years of experience, launched the Thrive, a lightweight travel trailer that focuses on comfort and modern design.
- September 2024: THOR unveiled a hybrid Class A coach on Harbinger’s EV chassis with 500-mile range and 2025 delivery schedule.


Global Recreational Vehicle Market Report Scope
Recreational vehicles RVs are most commonly used as temporary accommodation when traveling. However, some people use them as their main residence due to benefits such as easily towable units, low fuel consumption, lower maintenance and insurance costs, and a lower depreciation value.
The Recreational Vehicle Market Report Segmented by Type (Towable Recreational Vehicles (RVs) and Motorhomes), Application (Domestic/Personal Use and Commercial (Rental Fleets, Mobile Offices, Events)), Propulsion (Internal Combustion Engine, Hybrid, and Battery Electric RVs), Length Category (Below 20 Feet, 20 to 30 Feet, and Above 30 Feet), and Geography (North America, South America, Europe, Asia Pacific, and Middle East and Afric). The Market Forecasts are Provided in Terms of Value (USD) and Volume (Units).
By Type
| Towable RVs | Travel Trailers |
| Fifth-Wheel Trailers | |
| Folding Camp Trailers | |
| Truck Campers | |
| Motorhomes | Class A |
| Class B (Camper Vans) | |
| Class C |
By Application
| Domestic/Personal Use |
| Commercial (Rental Fleets, Mobile Offices, Events) |
By Propulsion
| Internal-Combustion Engine (ICE) |
| Hybrid |
| Battery-Electric RVs |
By Length Category
| Below 20 feet |
| 20 to 30 feet |
| Above 30 feet |
By Geography
| North America | United States |
| Canada | |
| Rest of North America | |
| South America | Brazil |
| Argentina | |
| Rest of South America | |
| Europe | Germany |
| United Kingdom | |
| France | |
| Spain | |
| Italy | |
| Netherlands | |
| Rest of Europe | |
| Asia-Pacific | China |
| Japan | |
| India | |
| South Korea | |
| Australia and New Zealand | |
| Rest of Asia-Pacific | |
| Middle East and Africa | GCC |
| Turkey | |
| South Africa | |
| Nigeria | |
| Kenya | |
| Rest of Middle East and Africa |
| By Type | Towable RVs | Travel Trailers |
| Fifth-Wheel Trailers | ||
| Folding Camp Trailers | ||
| Truck Campers | ||
| Motorhomes | Class A | |
| Class B (Camper Vans) | ||
| Class C | ||
| By Application | Domestic/Personal Use | |
| Commercial (Rental Fleets, Mobile Offices, Events) | ||
| By Propulsion | Internal-Combustion Engine (ICE) | |
| Hybrid | ||
| Battery-Electric RVs | ||
| By Length Category | Below 20 feet | |
| 20 to 30 feet | ||
| Above 30 feet | ||
| By Geography | North America | United States |
| Canada | ||
| Rest of North America | ||
| South America | Brazil | |
| Argentina | ||
| Rest of South America | ||
| Europe | Germany | |
| United Kingdom | ||
| France | ||
| Spain | ||
| Italy | ||
| Netherlands | ||
| Rest of Europe | ||
| Asia-Pacific | China | |
| Japan | ||
| India | ||
| South Korea | ||
| Australia and New Zealand | ||
| Rest of Asia-Pacific | ||
| Middle East and Africa | GCC | |
| Turkey | ||
| South Africa | ||
| Nigeria | ||
| Kenya | ||
| Rest of Middle East and Africa | ||


Key Questions Answered in the Report
What is the current value of the recreational vehicle market?
The recreational vehicle market stands at USD 35.66 billion in 2026 and is projected to reach USD 52.74 billion by 2031.
How fast is the recreational vehicle market growing?
The market is set to expand at an 8.14% CAGR between 2026 and 2031.
Why are compact recreational vehicles gaining popularity?
Sub-20 ft models fit standard parking spaces, comply with urban length restrictions and appeal to first-time buyers seeking maneuverable options.
How significant is electrification for future recreational vehicle demand?
Battery-electric and hybrid models are expected to grow at a 23.24% CAGR as regulations tighten and charging networks expand.
Which region offers the strongest growth potential?
Asia-Pacific leads with a projected 9.54% CAGR, supported by rising disposable income and rapid infrastructure development.
Page last updated on:


