Market Overview
| Study Period | 2019 - 2031 |
|---|---|
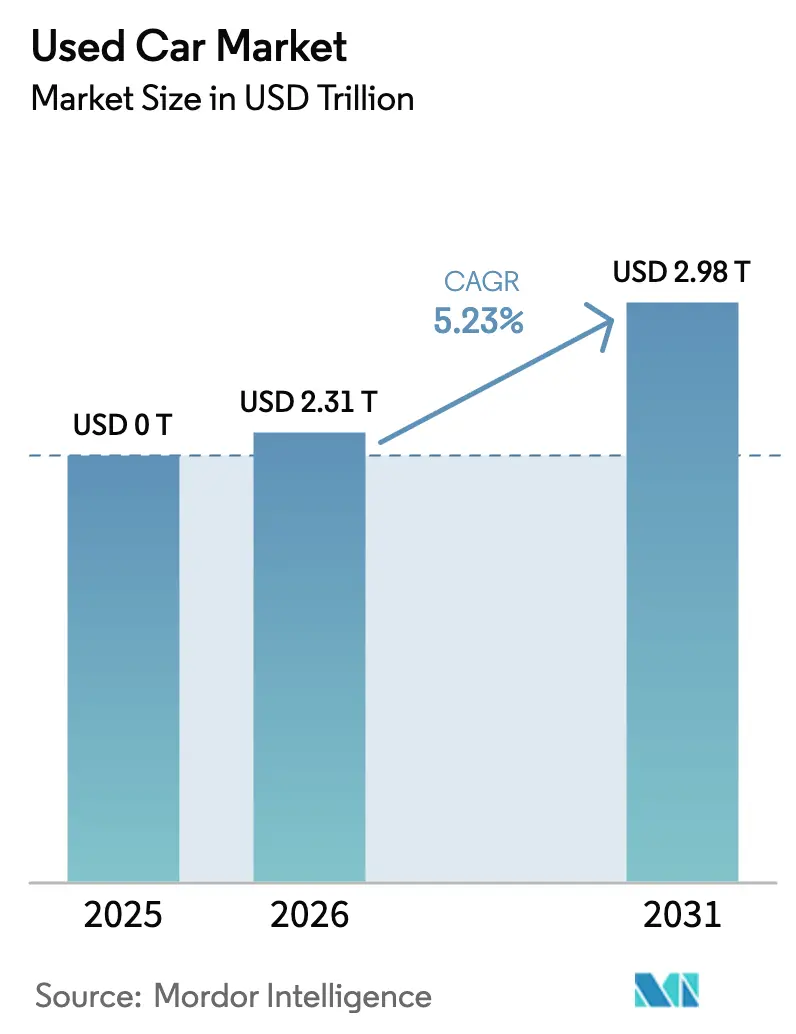
| Market Size (2026) | USD 2.31 Trillion |
| Market Size (2031) | USD 2.98 Trillion |
| Growth Rate (2026 - 2031) | 5.23% CAGR |
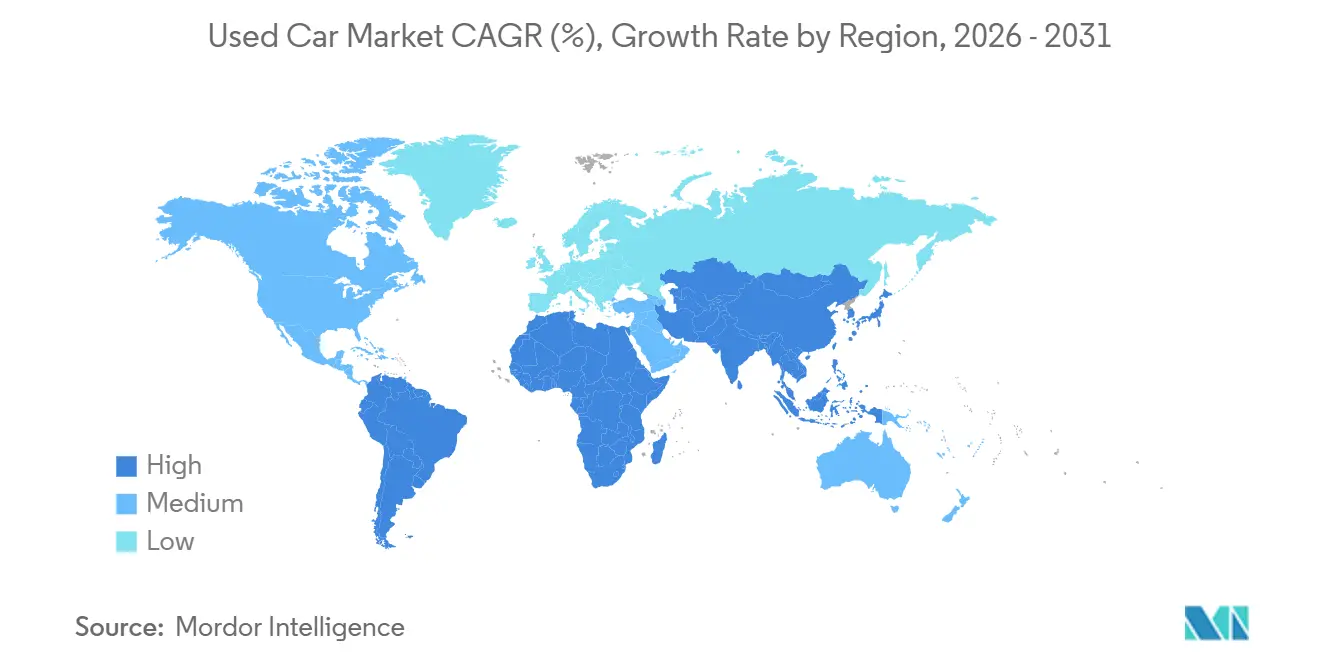
| Fastest Growing Market | Asia Pacific |
| Largest Market | North America |
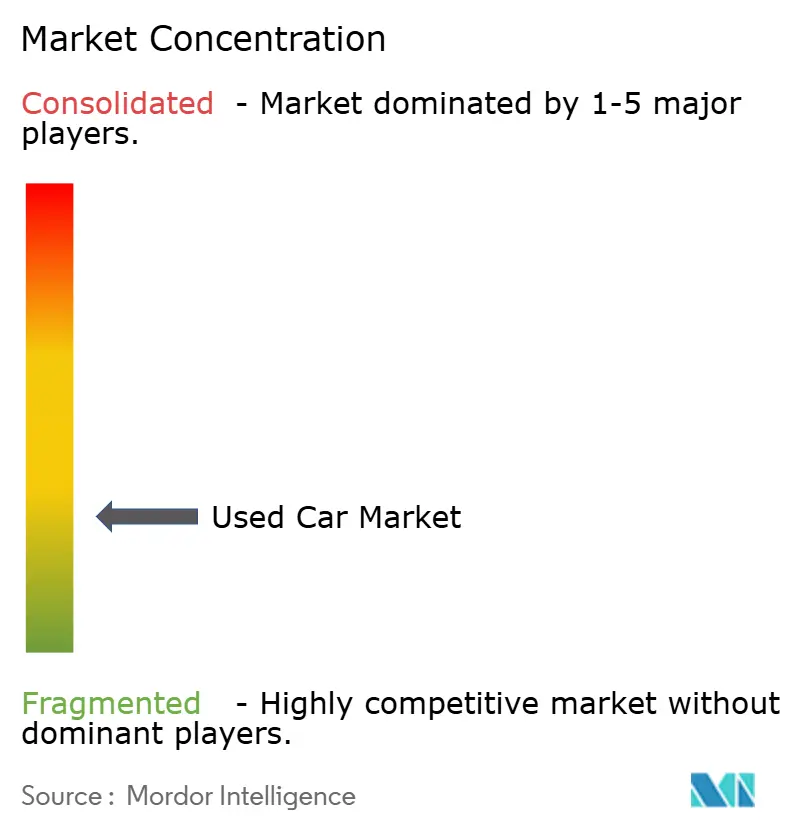
| Market Concentration | Low |
Major Players *Disclaimer: Major Players sorted in no particular order Image © Mordor Intelligence. Reuse requires attribution under CC BY 4.0. | |
Used Car Market Analysis by Mordor Intelligence
The used car market size stood at USD 2.31 trillion in 2026 and is forecast to reach USD 2.98 trillion by 2031, reflecting a 5.23% CAGR. Organized retailers are expanding volume significantly, more than double the headline pace, as warranty-backed inventory and data-driven pricing attract risk-averse buyers. Digital platforms compress bid-ask spreads and lift inventory turns, challenging the legacy dealership cost structure. New-vehicle prices that climbed in 2024 are pushing median shoppers toward three- to five-year-old stock and boosting certified pre-owned vehicle attachment rates. The Asia-Pacific region leads growth, while North America retains a dominant share of the global value, despite supply normalization that tempers pricing power.
Key Report Takeaways
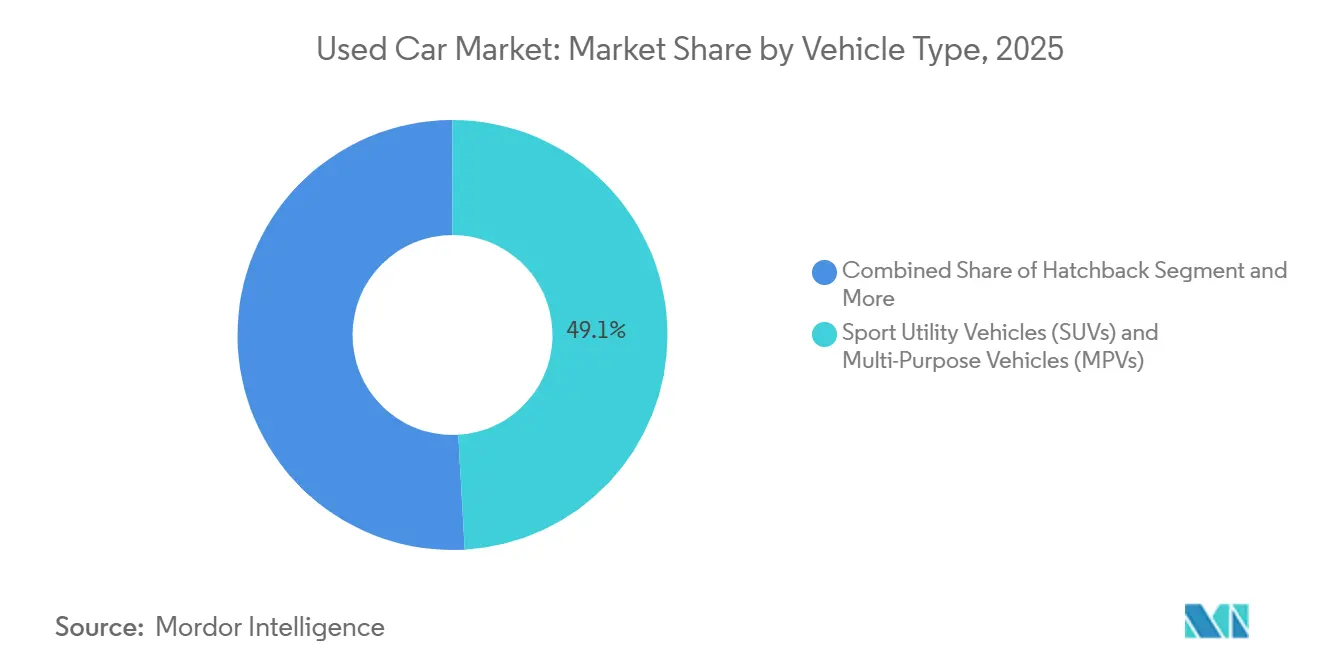
- By vehicle type, sport utility and multi-purpose vehicles captured 49.05% of transactions in 2025 and are projected to pace the segment at an 8.23% CAGR by 2031.
- By vendor type, unorganized vendors held 69.12% of the volume in 2025; however, organized channels are advancing at an 11.25% CAGR by 2031, the fastest in their class.
- By fuel type, gasoline units accounted for 66.34% of sales in 2025, while electric vehicles are projected to expand at a 15.14% CAGR by 2031.
- By sales channel, offline dealerships retained 71.23% of sales in 2025; however, online platforms are expected to scale at a 13.26% CAGR by 2031.
- By vehicle age, 3-5 year-old vehicles accounted for 39.48% of the volume in 2025, and the inventory of cars below 3 years is projected to grow at a 11.78% CAGR by 2031.
- By mileage, the 20,001 - 50,000 km segment held 42.35% of the 2025 share, while vehicles with less than 20,000 km will grow at a 9.85% CAGR by 2031.
- By price band, less than 10,000 inventory comprised 49.04% of the volume in 2025, and the above-USD 30,000 band is projected to rise at a 7.55% CAGR by 2031.
- By geography, North America commanded a 39.85% share of the used car market in 2025, while the Asia-Pacific region is forecast to lead growth at a 6.84% CAGR by 2031.
Note: Market size and forecast figures in this report are generated using Mordor Intelligence’s proprietary estimation framework, updated with the latest available data and insights as of January 2026.
Global Used Car Market Trends and Insights
Drivers Impact Analysis*
| Driver | (~) % Impact on CAGR Forecast | Geographic Relevance | Impact Timeline |
|---|---|---|---|
| Digital Retail Platforms Expanding | +1.5% | Global, led by North America and Asia-Pacific urban centers | Short term (≤ 2 years) |
| Surging Personal-Mobility Demand | +1.3% | India, China, Southeast Asia, South America | Long term (≥ 4 years) |
| Rising New-Car Prices | +1.2% | North America, Western Europe | Medium term (2-4 years) |
| Certified-Pre-Owned Penetration | +0.8% | North America, Europe, Japan | Medium term (2-4 years) |
| EV Battery-Health Certification | +0.6% | North America, Europe, China | Medium term (2-4 years) |
| OEM Buy-Back Guarantees | +0.5% | North America, Europe | Short term (≤ 2 years) |
| Source: Mordor Intelligence | |||
Expansion of Digital Retail Platforms
Carvana sold 108,651 units in Q3 2024, a 34% rise year over year, illustrating the velocity digital players bring to the used car market [1]“Q3 2024 Shareholder Letter,” Carvana, carvana.com. CarGurus attracts a significant number of monthly users and supports numerous partner dealers through its CarOffer exchange, which efficiently matches wholesale demand. Instant online appraisals reduce search costs, and home delivery eliminates showroom friction, compressing bid-ask spreads compared to offline bargaining. In India, Cars24 has successfully executed a substantial volume of transactions through mobile inspections, which aggregate supply within a short timeframe. Southeast Asia’s Carro integrates financing and after-sales services into one application, aligning with the e-commerce expectations of younger consumers.
Surging Personal-Mobility Demand in Emerging Markets
Cars24 secured USD 450 million in funding, while Spinny raised USD 283 million, fueling a network build-out that now spans 100 Indian cities. In 2024, China experienced significant trade growth, driven by the authorities' removal of barriers to inter-provincial transfers. Meanwhile, Brazil saw a notable increase in sales, supported by improved financing penetration as banks actively pursued auto loan growth. Southeast Asia remains fragmented, yet Carro’s market presence is raising service standards that could accelerate organized adoption. Growth durability hinges on digital payments, vehicle-history databases, and road infrastructure, areas where multilateral lenders are investing heavily.
Rising New-Car Prices
Average transaction prices in the United States have increased significantly over recent years, creating an affordability challenge that pushes credit-constrained shoppers toward nearly new alternatives. The value retention of three-year-old vehicles has improved notably compared to pre-pandemic levels, reducing the age premium and enhancing the appeal of certified pre-owned cars. In Europe, compliance with Euro 7 regulations is increasing list prices, steering fleets towards opting for diesels and hybrids that are grandfathered and have a two-to four-year age limit [2]“Euro 7 Proposal,” European Commission, europa.eu. Organized retailers benefit because reconditioning scales and warranty coverage de-risk purchases for price-sensitive consumers. Consumer-protection agencies are simultaneously pushing for stricter price disclosure, which further legitimizes transparent channels over informal lots.
OEM Certified-Pre-Owned Penetration
Toyota’s certified program offers 160-point inspections and one-year bumper-to-bumper coverage that transfers to future owners. Ford Blue Advantage extends powertrain protection to seven years or 100,000 miles, increasing buyer confidence in advanced driver-assistance hardware. In 2024, General Motors enhanced its Certified Pre-Owned (CPO) attachment rate within its used-unit mix. This improvement was driven by offering bundled warranties with its own financing, which provided more competitive rates compared to those offered by banks. Nissan in Japan now includes battery-health certificates for Leaf cars to stabilize residuals. ISO 9001 references in marketing reinforce quality assurance and differentiate OEM channels from informal sellers.
Restraints Impact Analysis*
| Restraint | (~) % Impact on CAGR Forecast | Geographic Relevance | Impact Timeline |
|---|---|---|---|
| Limited Used-Car Financing | -0.9% | India, Southeast Asia, South America, subprime segments globally | Medium term (2-4 years) |
| Supply Crunch of Near-New Vehicles | -0.7% | North America and Europe | Short term (≤ 2 years) |
| Stricter Import-Emission Rules | -0.6% | Middle East, South America, select Asia-Pacific markets | Short term (≤ 2 years) |
| Infotainment Data-Privacy Concerns | -0.4% | Europe, North America, China | Medium term (2-4 years) |
| Source: Mordor Intelligence | |||
Limited Used-Car Financing
In Q3 2024, average used-car loan APRs in the United States experienced a significant increase, which has disproportionately affected subprime segments. In India, penetration remains low, constrained by documentation challenges and limited bureau coverage, particularly in non-metropolitan areas. In Brazil, high rates have restricted the pool of eligible buyers to those with stronger credit profiles. Indonesian banks, which require substantial down payments and impose shorter loan tenures, are increasing the monthly financial burdens for entry-level buyers. While captive finance divisions and fintech lending collaborations are working to address these challenges, progress has been uneven.
Supply Crunch of Near-New Vehicles Post-COVID Production Slump
In recent years, North America experienced production disruptions that significantly impacted the availability of vehicles returning from lease. Lease penetration saw a decline and has only partially recovered as of now. Dealers for BMW and Mercedes are observing quicker certified pre-owned (CPO) inventory turnover compared to pre-pandemic levels, highlighting a constrained supply in the near-luxury segment. The normalization of these trends is expected to take several years, which continues to support higher residual values in the interim.
*Our forecasts treat driver/restraint impacts as directional, not additive. The impact forecasts reflect baseline growth, mix effects, and variable interactions.
Segment Analysis
By Vehicle Type: SUVs and MPVs Anchor Volume and Growth
Sport Utility Vehicles (SUVs) and Multi-Purpose Vehicles (MPVs) accounted for 49.05% of 2025 transactions and are projected to advance at an 8.23% CAGR by 2031, outpacing the overall used car market. Compact models, such as the Honda CR-V and Toyota RAV4, lead the way in terms of turnover. At the same time, crossovers provide ride-hailing and delivery fleets with the versatility that boosts resale liquidity. Sedans are now trailing because OEMs are curbing new production in favor of crossovers, thereby shrinking future sedan supply and reinforcing the SUV premium. Hatchbacks hold niche share in dense cities yet face encroachment from small electric crossovers that match footprint with zero-emission compliance. Fleet replacement cycles also mean that crossover units enter resale with documented maintenance, which reduces buyer risk.
These preferences support robust residuals that compress the total cost of ownership. Consumers in emerging markets perceive higher ground clearance as an advantage on mixed-quality roads, sustaining demand for older MPVs. OEM CPO channels prioritize SUVs to capture higher gross profit per unit. Aftermarket accessory suppliers concentrate on this body style, deepening the ecosystem that frames resale pricing. Insurers report lower total-loss ratios for midsize SUVs versus sedans, further enhancing value retention.


By Vendor Type: Organized Channels Gain Share Despite Unorganized Dominance
Unorganized vendors still controlled 69.12% of global transactions in 2025; however, organized players are growing at a 11.25% CAGR by 2031 and taking an incremental share each year. Warranty programs, transparent pricing, and integrated financing enable these retailers to charge an assurance premium that buyers are willing to accept. Investment in reconditioning centers increases throughput and shortens days-to-sale, which improves capital turnover.
The gap between models is widest in India and Southeast Asia, where mobile-first inspections help platforms like Spinny and Carro reach sellers whom small dealers often overlook. In China, mandatory inspection certification drives urban consumers toward platforms that guarantee title security. Europe’s AUTO1 leverages continental logistics to arbitrage price differentials, a capability that surpasses that of fragmented independents.
By Fuel Type: Gasoline Dominates, Electric Surges
Gasoline vehicles accounted for 66.34% of sales in 2025; however, their growth lags behind that of the used car market as emission zones expand. The diesel share continues to decline in Europe and India under the Euro 7 and Bharat Stage VI Phase 2 thresholds. Hybrids attract price-point shoppers who want lower running costs without the dependency on charging infrastructure.
Electric vehicles occupy a modest share but are growing at a 15.14% CAGR by 2031, driven by battery-health certificates that narrow valuation uncertainty. Tesla Model 3 units retain 90% of their original range after three years, bolstering confidence. Alternative fuels such as CNG and LPG remain local plays aligned with subsidized programs in Brazil and Turkey.
By Sales Channel: Offline Retains Share, Online Scales Rapidly
Offline dealerships accounted for 71.23% of 2025 sales, primarily because physical test drives and immediate delivery are important considerations for buyers of higher-value units. However, online channels are expected to compound at a 13.26% CAGR by 2031, adding convenience and price clarity that resonate with millennials. Hybrid models blur boundaries; for example, CarGurus allows digital discovery followed by local pickup. Mobile inspection units in India and Southeast Asia eliminate the need for showroom visits, compressing sales cycles from weeks to hours.
Luxury vehicles still maintain a heavier offline share because buyers prefer tactile validation, and financing complexity requires in-person documentation. The cost structure difference is material. Digital natives avoid large real-estate footprints, reallocating expense to logistics and data science. Legacy dealers respond with omnichannel investments and shorter reconditioning times to match speed expectations.
By Vehicle Age: Three-to-Five-Year Sweet Spot Leads Volume
Three- to five-year-old cars accounted for 39.48% of 2025 transactions, reflecting a balance between depreciation and remaining warranty coverage that buyers value. The below-three-year inventory, although smaller, is the fastest-growing cohort, with a 11.78% CAGR by 2031, as lease returns normalize post-pandemic.
Two-year-old units average USD 35,000 and capture buyers hunting late-model safety tech without facing new-car depreciation. Five- to eight-year inventory attracts budget-constrained households in Brazil and India, where extended loan tenures make monthly payments more manageable. Vehicles over eight years old face rising emission restrictions that curtail cross-border resale, notably in the United Arab Emirates and Argentina.
By Mileage: Mid-Range Mileage Dominates, Low-Mileage Premium Grows
Cars with 20,001–50,000 kilometers formed 42.35% of 2025 sales, aligning with warranty thresholds and CPO criteria. Units with less than 20,000 kilometers are growing at a 9.85% CAGR by 2031 and fetch a significant premium, especially in the luxury and EV classes, where mileage correlates strongly with battery health.
Higher-mileage vehicles, over 50,000 kilometers, remain staples for price-sensitive buyers and dominate sub-USD 10,000 deals. Odometer fraud risks persist in informal settings, motivating regulators to consider blockchain registries and digital odometers. Organized players invest in telematics verification to assure buyers and protect brand reputation.

By Price Band: Sub-USD 10,000 Anchors Volume, Premium Segment Grows Fastest
Inventory below USD 10,000 represented 49.04% of 2025 volume, heavily weighted toward emerging markets where financing is scarce. Organized participation is thin because inspection costs and warranty liabilities erode the slim gross profit per unit. Cash purchases dominate, and emission limits are less strictly enforced.
The USD 10,001–30,000 tier is the main battleground for organized retailers. Average transaction prices at CarMax and Carvana hover with significant gross profits. The above-USD 30,000 bracket is the fastest-growing, with a 7.55% CAGR, as buyers flee record new-car prices and capture luxury features at notable discounts.
Geography Analysis
North America contributed 39.85% of global value in 2025, buoyed by deep finance penetration, where a significant share of buyers use third-party or captive loans. In FY2024, CarMax experienced significant retail activity, while Carvana achieved notable year-over-year growth, underscoring a substantial shift towards digital channels. However, this growth remains slower than the global average, driven by normalizing inventory inflows and stabilizing wholesale prices, as reflected in recent market trends. Asia-Pacific is the fastest riser at a 6.84% CAGR. China’s removal of inter-provincial transfer limits unlocked notable trades in 2024. India’s organized sector, led by Cars24 and Spinny, continues to convert informal shares through mobile inspections and integrated financing. Regulatory divergence from China’s PIPL to Indonesia’s loan-to-value caps fragments competitive playbooks.
As per the Europe used car market report, the region relies on arbitrage and stringent environmental rules. The United Kingdom sold a significant volume of vehicles in Q3 2024, with EV share rising as battery certifications soothe residual risk. Euro 7 will soon curb older diesel imports and push supply toward compliant hybrids and EVs. GDPR and the Battery Regulation increase dealer compliance costs, yet they also enhance trust in digital channels. Brazil and Argentina stand at the forefront of South America's automotive landscape. Brazil has a significant number of transactions, with a notable finance penetration rate, although interest rates remain high. The country's dominance in flex-fuel vehicles limits its export flexibility. Meanwhile, Argentina has introduced new regulations aligned with the Eurozone, which have tightened import channels and caused local prices to rise significantly. In an effort to expand credit accessibility, digital platforms, bolstered by fintech, are emerging in both São Paulo and Buenos Aires.
Turning to the Middle East and Africa, these regions predominantly serve as import conduits. Dubai, a key player, has been a hub for re-exports, but recent regulatory changes restricting older vehicles have led to a noticeable decline in activity. In Saudi Arabia, the Vision 2030 initiative is channeling investments to formalize the automotive sector. Concurrently, South Africa is gravitating towards organized dealers, aligning with the National Automobile Dealers Association. While the African Continental Free Trade Area (AfCFTA) strives to standardize cross-border regulations, the journey remains slow.
Mordor Intelligence provides coverage of the used car market across other key regional markets, including Africa, each with their regulatory frameworks and demand patterns. Detailed country-level analysis extends to Ethiopia, Hong Kong, Finland, New Zealand, Norway, Myanmar, Switzerland, Sri Lanka, and Belgium incorporating local coverage and market participation, as required.

Competitive Landscape
The top ten operators control roughly a notable share of global value, giving the used car market a moderate concentration profile. North American publics, such as CarMax, AutoNation, and Lithia, leverage data lakes and over 200 reconditioning centers to protect their margins, yet their growth trails that of pure digital models. Carvana eliminates showroom overhead by employing machine learning to reduce reconditioning cycle time, which helped lift unit sales in Q3 2024. AUTO1 uses pan-European logistics to arbitrage regional price gaps, processing a significant number of units in 2023 [3]“Annual Report 2023,” AUTO1 Group, auto1-group.com.
Emerging-market disruptors aggregate fragmented supply. Cars24 achieved significant sales growth in FY2024 through AI-driven auctions. Carro operates across eight Southeast Asian countries, boasting a considerable valuation, and bundles finance and after-sales services into a mobile interface. Differentiation pivots on technology: CarMax invested in digital upgrades in FY2024, while smaller independents lack the capital to match.
White-space prospects cluster around sub-USD 10,000 inventory, where finance penetration is low, and around battery passports for used EVs, which are required in Europe starting from 2027. Subscription models and fintech lending in Latin America are other nascent plays. Competitive intensity will intensify as OEMs extend buy-back guarantees, capturing supply and compressing available inventory for independents.
Used Car Industry Leaders
CarMax Inc.
AutoNation, Inc.
Arnold Clark Automobiles Limited
Lithia Motors, Inc.
Penske Automotive Group, Inc.
- *Disclaimer: Major Players sorted in no particular order

Recent Industry Developments
- September 2025: Nissan Motor India and Spinny activated a nationwide exchange program that recognizes Spinny buying letters as proof of trade-in, easing paperwork for new buyers.
- August 2025: Amazon Autos began listing used and certified vehicles in Los Angeles, with plans for national expansion, giving dealers an additional high-traffic digital channel.
- May 2025: Toyota Motor Asia acquired a 40% stake in PT Astra Digital Mobil, thereby deepening its exposure to Indonesia’s fast-growing organized retail sector.
- October 2024: AUTO1 Group expanded its inventory finance program to Belgium and the Netherlands, enabling partner dealers to source cars without tying up equity.


Global Used Car Market Report Scope
The scope includes segmentation by Vehicle Type (Hatchback, Sedan, SUVs and MPVs), Vendor Type (Organized and Unorganized), Fuel Type (Gasoline, Diesel, Hybrid, and Electric, and Other Alternative Fuels), Sales Channel (Online Platforms and Offline Dealerships), Vehicle Age (Below 3 Years, 3-5 Years, 5-8 years, and Above 8 Years), Mileage (Less Than 20, 000 Kms, 20,001 - 50,000 km, and Above 50,000 km ), Price Band (Less Than USD 10, 000, USD 10,001 - USD 30,000, and Above USD 30,000), and Geography (North America, South America, Europe, Asia-Pacific, and Rest of the World). The market forecasts are provided in terms of value (USD) and volume (Units).
By Vehicle Type
| Hatchbacks |
| Sedans |
| Sport Utility Vehicles (SUVs) and Multi-Purpose Vehicles (MPVs) |
By Vendor Type
| Organized |
| Unorganized |
By Fuel Type
| Gasoline |
| Diesel |
| Hybrid |
| Electric |
| Other Alternative Fuels |
By Sales Channel
| Online Platforms |
| Offline Dealerships |
By Vehicle Age
| Below 3 Years |
| 3 - 5 Years |
| 5 - 8 Years |
| Above 8 Years |
By Mileage
| Less Than 20,000 km |
| 20,001 - 50,000 km |
| Above 50,000 km |
By Price Band
| Less Than USD 10,000 |
| USD 10,001 - USD 30,000 |
| Above USD 30,000 |
By Geography
| North America | United States |
| Canada | |
| Rest of North America | |
| South America | Brazil |
| Argentina | |
| Rest of South America | |
| Europe | Germany |
| United Kingdom | |
| France | |
| Spain | |
| Russia | |
| Rest of Europe | |
| Asia-Pacific | China |
| India | |
| Japan | |
| South Korea | |
| Rest of Asia-Pacific | |
| Middle East and Africa | Saudi Arabia |
| United Arab Emirates | |
| South Africa | |
| Egypt | |
| Turkey | |
| Rest of the Middle East and Africa |
| By Vehicle Type | Hatchbacks | |
| Sedans | ||
| Sport Utility Vehicles (SUVs) and Multi-Purpose Vehicles (MPVs) | ||
| By Vendor Type | Organized | |
| Unorganized | ||
| By Fuel Type | Gasoline | |
| Diesel | ||
| Hybrid | ||
| Electric | ||
| Other Alternative Fuels | ||
| By Sales Channel | Online Platforms | |
| Offline Dealerships | ||
| By Vehicle Age | Below 3 Years | |
| 3 - 5 Years | ||
| 5 - 8 Years | ||
| Above 8 Years | ||
| By Mileage | Less Than 20,000 km | |
| 20,001 - 50,000 km | ||
| Above 50,000 km | ||
| By Price Band | Less Than USD 10,000 | |
| USD 10,001 - USD 30,000 | ||
| Above USD 30,000 | ||
| By Geography | North America | United States |
| Canada | ||
| Rest of North America | ||
| South America | Brazil | |
| Argentina | ||
| Rest of South America | ||
| Europe | Germany | |
| United Kingdom | ||
| France | ||
| Spain | ||
| Russia | ||
| Rest of Europe | ||
| Asia-Pacific | China | |
| India | ||
| Japan | ||
| South Korea | ||
| Rest of Asia-Pacific | ||
| Middle East and Africa | Saudi Arabia | |
| United Arab Emirates | ||
| South Africa | ||
| Egypt | ||
| Turkey | ||
| Rest of the Middle East and Africa | ||


Key Questions Answered in the Report
How large is the used car market in 2026?
The used car market size is projected to be around USD 2.31 trillion in 2026, positioned on a 5.23% growth path toward USD 2.98 trillion by 2031.
Which body style sells the most in the used car space?
SUVs and MPVs lead with roughly 49% of transactions and continue to outpace overall growth at an 8.23% CAGR.
What share do online platforms hold in used car sales?
Online platforms account for close to 29% of global transactions in 2025, scaling rapidly at a 13.26% CAGR as digital convenience gains favor.
Which region is growing fastest in used vehicle demand?
Asia-Pacific leads with a 6.84% CAGR, propelled by India’s organized retail expansion and China’s deregulated inter-provincial trade.
Page last updated on:


