Free Ad-Supported Streaming TV Market Size and Share
Market Overview
| Study Period | 2020 - 2031 |
|---|---|
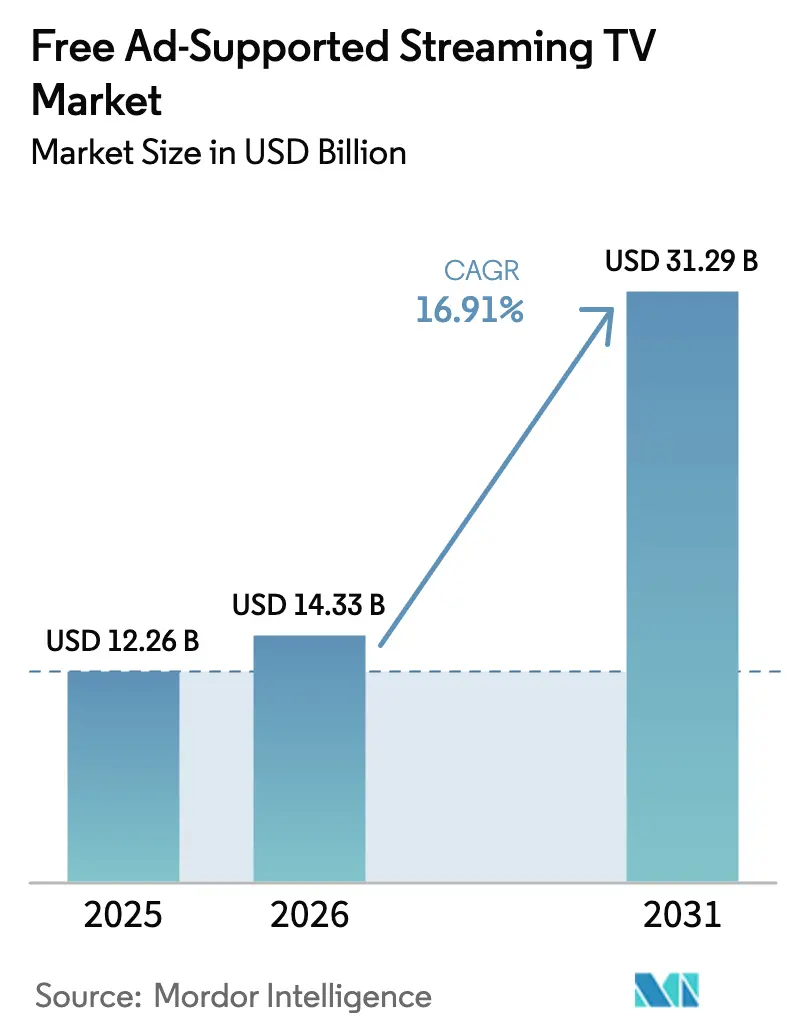
| Market Size (2026) | USD 14.33 Billion |
| Market Size (2031) | USD 31.29 Billion |
| Growth Rate (2026 - 2031) | 16.91% CAGR |
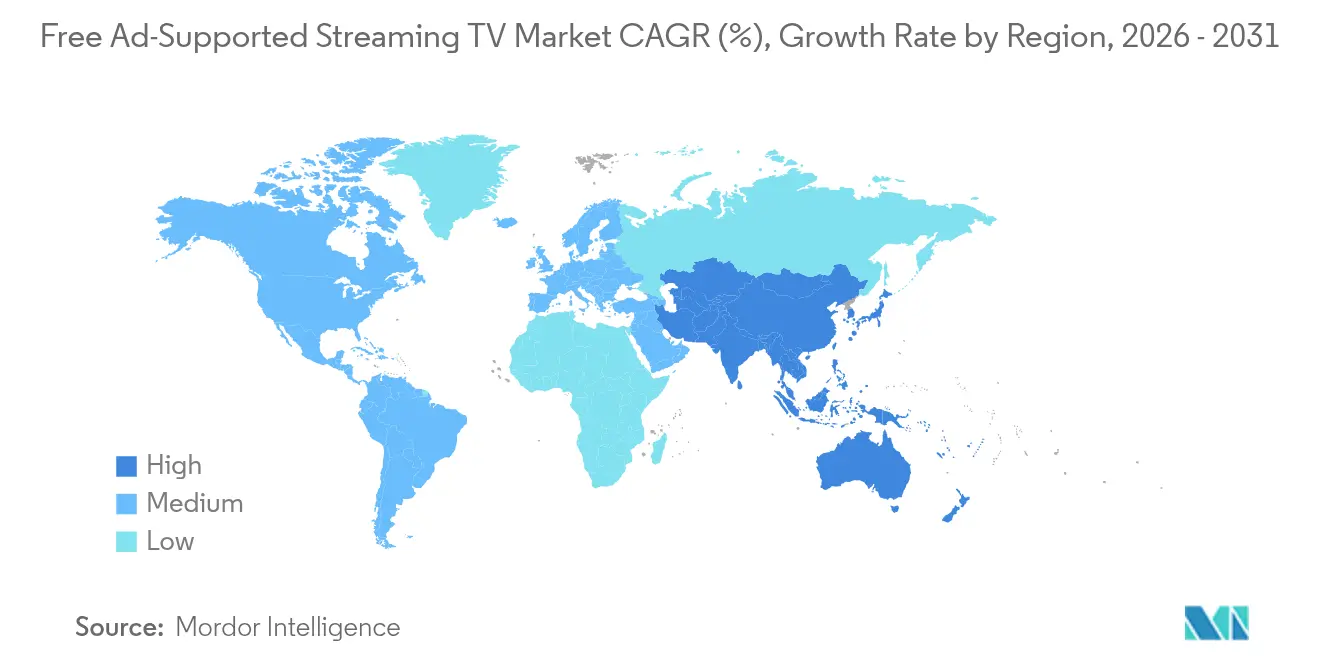
| Fastest Growing Market | Asia Pacific |
| Largest Market | North America |
| Market Concentration | Medium |
Major Players *Disclaimer: Major Players sorted in no particular order Image © Mordor Intelligence. Reuse requires attribution under CC BY 4.0. | |
Free Ad-Supported Streaming TV Market Analysis by Mordor Intelligence
Free Ad-Supported Streaming TV market size in 2026 is estimated at USD 14.33 billion, growing from 2025 value of USD 12.26 billion with 2031 projections showing USD 31.29 billion, growing at 16.91% CAGR over 2026-2031. Cord-cutting continues to accelerate as households migrate from paid cable packages to free, ad-supported environments that feel familiar yet remove subscription fees. Advertisers follow viewers, redirecting linear television budgets to programmatic connected-TV inventory that offers precise targeting, real-time optimization, and measurable outcomes. Smart-TV penetration and broadband reach provide the scale that platforms need to aggregate audiences, while shoppable and interactive ad formats improve engagement metrics that justify higher CPMs. Platforms with proprietary content libraries and first-party data analytics earn pricing power in negotiations with both viewers and advertisers. Rising programmatic fraud, licensing inflation, and privacy regulations represent structural headwinds, but ongoing OEM and telco bundling supports sustained double-digit expansion of the Free Ad-Supported Streaming TV market.
Key Report Takeaways
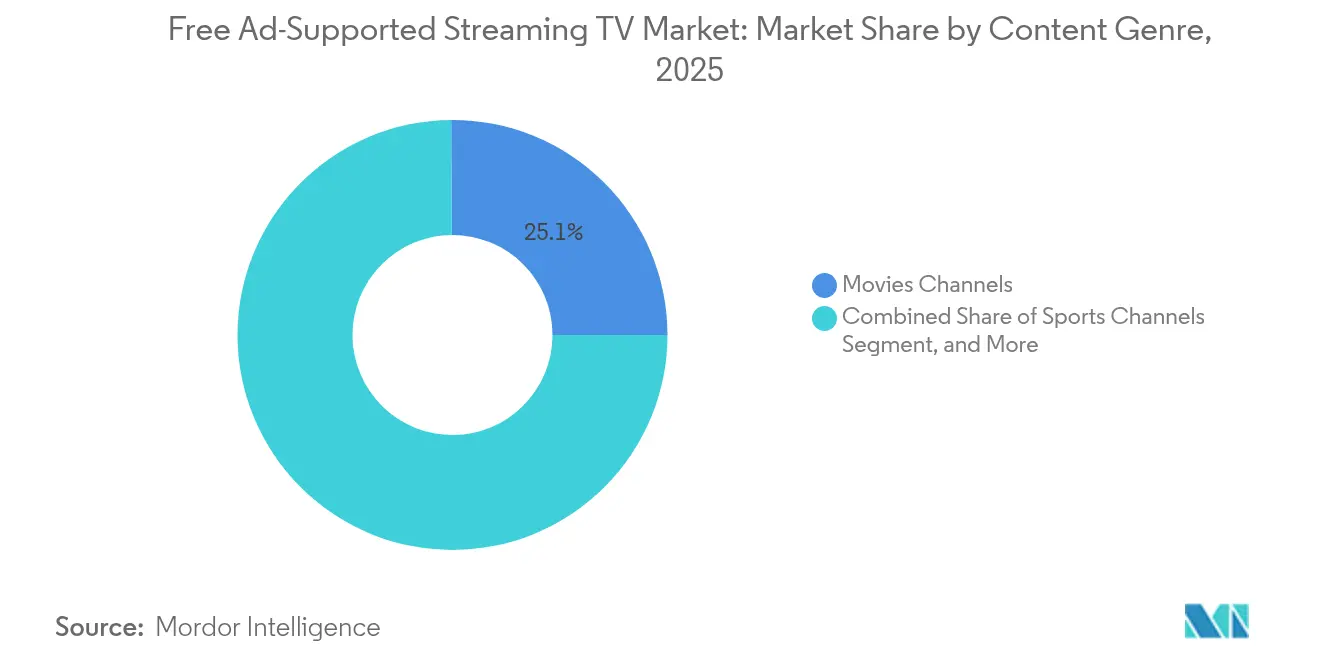
- By content genre, Movies Channels held 25.10% of the Free Ad-Supported Streaming TV market share in 2025, while Sports Channels are projected to expand at a 21.95% CAGR through 2031.
- By channel format, Linear FAST commanded 67.20% share of the Free Ad-Supported Streaming TV market size in 2025; On-Demand AVOD is forecast to grow at a 22.97% CAGR to 2031.
- By distribution platform, OEM smart-TV environments led with 41.10% revenue share in 2025, whereas telco and ISP platforms record the fastest growth at 22.50% CAGR through 2031.
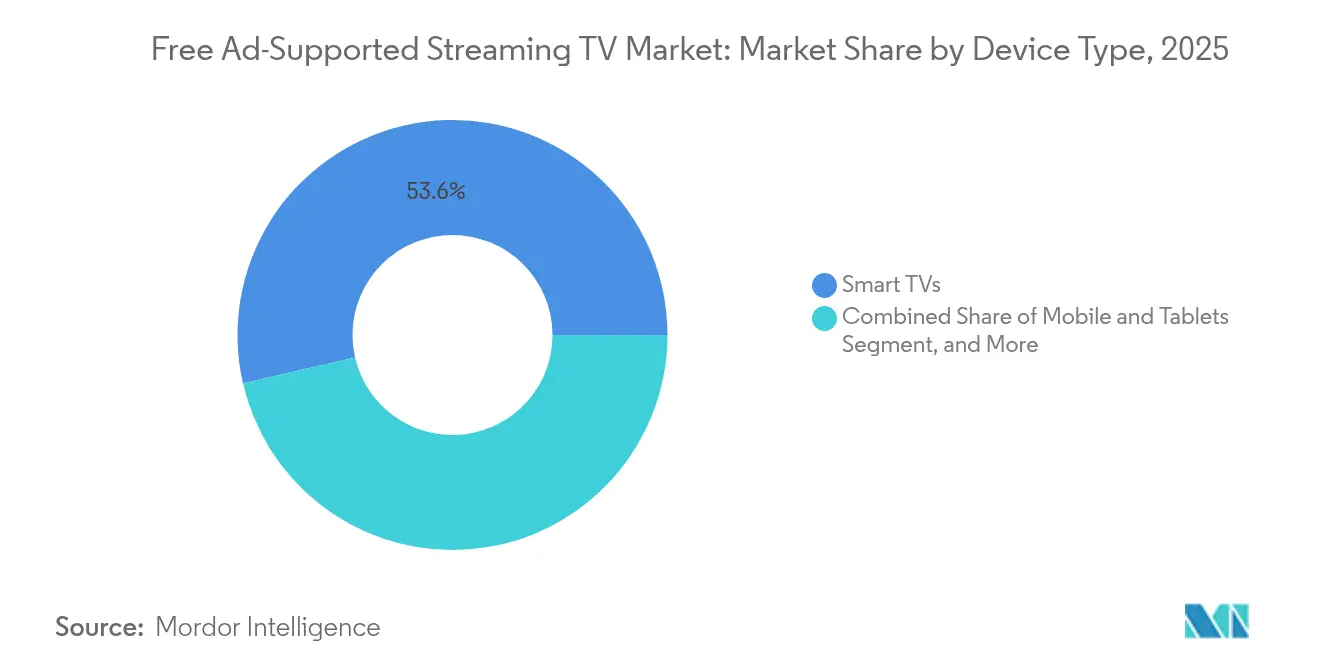
- By device type, smart TVs accounted for 53.60% of the Free Ad-Supported Streaming TV market size in 2025, and mobile and tablets are advancing at a 22.30% CAGR to 2031.
- By geography, North America captured 71.10% market share in 2025; Asia-Pacific shows the highest projected CAGR at 22.10% to 2031.
Note: Market size and forecast figures in this report are generated using Mordor Intelligence’s proprietary estimation framework, updated with the latest available data and insights as of 2026.
Global Free Ad-Supported Streaming TV Market Trends and Insights
Drivers Impact Analysis*
| Driver | (~) % Impact on CAGR Forecast | Geographic Relevance | Impact Timeline |
|---|---|---|---|
| Connected-TV household penetration surge | +4.2% | Global, strongest in North America and Europe | Medium term (2-4 years) |
| Advertiser shift from linear TV to CTV | +5.8% | North America and Europe, spreading to Asia-Pacific | Short term (≤ 2 years) |
| Monetization of dormant studio IP | +3.1% | Global content hubs in US, UK, India | Long term (≥ 4 years) |
| OEM smart-TV bundling of FAST services | +2.9% | Samsung and LG driving global deployment | Medium term (2-4 years) |
| AI-driven hyper-localization | +1.8% | Core in Asia-Pacific, expanding to Latin America, MEA | Long term (≥ 4 years) |
| Interactive and shoppable ad formats | +2.4% | North America and Europe, pilots in Asia-Pacific | Short term (≤ 2 years) |
| Source: Mordor Intelligence | |||
Connected-TV household penetration surge
Falling smart-TV prices and improving broadband infrastructure expand the addressable audience for the Free Ad-Supported Streaming TV market. Samsung TV Plus surpassed 2,400 global channels in 2024, giving OEM platforms unmatched default distribution reach. [1]Samsung Electronics, “Samsung TV Plus Global Expansion,” samsung.com Pre-installed FAST services remove download friction and amplify user acquisition at zero marginal cost. Telco and ISP partners bundle these channels with internet plans to boost retention and ARPU. As household penetration climbs, advertisers gain confidence in scale, spurring incremental demand that fuels CPM expansion. The effect is most visible in markets where cord-cutting exceeds 40% of households, positioning connected-TV growth as a medium-term driver of revenue acceleration.
Advertisers shift from linear TV to programmatic CTV.
Brands redirect budget from linear broadcasting to addressable connected-TV inventory to reach younger, cord-cutting viewers. Fox Corporation noted that Tubi advertising revenue grew 31% in Q4 2024 because of this migration. [2]Fox Corporation, “Tubi Surpasses 97 Million Monthly Active Users and 10 Billion Streaming Hours in 2024,” foxcorporation.com Programmatic pipes deliver real-time bidding, frequency capping, and closed-loop attribution that linear cannot match. Political campaigns allocate incremental dollars to FAST because impressions are cost-effective and highly targeted. The surge in demand lifts occupancy rates above 90% during peak events such as the Super Bowl, where combined FOX and Tubi ad sales exceeded USD 800 million in 2025. The short-term driver boosts the Free Ad-Supported Streaming TV market by widening the advertiser base and improving monetization yield per hour streamed.
Monetization of dormant studio IP through FAST libraries
Studios unlock incremental value from legacy catalogues by licensing episodic content into dedicated FAST channels. Lionsgate and NBCUniversal curate genre bundles that play continuously, creating always-on revenue streams without fresh production spend. The model extends the shelf life of older series, introduces them to new audiences, and improves discoverability. As more IP owners adopt this strategy, content breadth widens, viewer time spent rises, and ad inventory supply scales. The long-term impact is amplified in markets such as India and the UK, where archival libraries are deep yet underexposed in digital windows.
Interactive and shoppable ad formats boosting CPMs
Interactive formats transform passive impressions into measurable engagement. BrightLine observed engagement rates three to five times higher for tap-to-shop video than for standard pre-roll in 2024. [3]BrightLine, “Interactive CTV Ad Engagement Rates,” brightline.tv Disney integrated QR codes and remote-control prompts, enabling viewers to transact without leaving the screen. Advertisers reward higher performance with CPM premiums of 25-40%, increasing revenue per hour for platforms. AI tools personalize overlays based on demographic and behavioral signals, optimizing conversion probability in real time. Early success fuels rapid rollout, making interactive options a short-term catalyst for the Free Ad-Supported Streaming TV market.
Restraints Impact Analysis*
| Restraint | (~) % Impact on CAGR Forecast | Geographic Relevance | Impact Timeline |
|---|---|---|---|
| Rising programmatic ad-fraud rates | -2.1% | Highest in programmatic-heavy markets worldwide | Short term (≤ 2 years) |
| Escalating content-licensing costs | -3.4% | Premium content markets globally | Medium term (2-4 years) |
| Channel-discovery fatigue and churn | -1.7% | North America and Europe, emerging in mature FAST markets | Medium term (2-4 years) |
| Data-privacy regulation tightening | -1.9% | EU and California lead, global adoption rising | Long term (≥ 4 years) |
| Source: Mordor Intelligence | |||
Rising programmatic ad-fraud rates
Invalid traffic undermines advertiser trust and erodes spend potential. Fraudulent impressions inflate campaign reports, prompting agencies to demand stricter verification and to shift budgets toward certified inventory. Platforms invest in ads.txt, SSAI watermarking, and MRC-accredited third-party audits to mitigate the threat, adding compliance costs that squeeze margins. The short-term restraint cuts effective fill rates until safeguards scale globally.
Escalating content-licensing costs
Competition for marquee movies and sports pushes per-hour fees higher, pressuring operators that rely heavily on third-party libraries. Rights holders channel premium titles into their own services, creating scarcity that inflates prices for remaining catalogues. Smaller FAST channels either accept thinner margins or exit categories, leading to potential market consolidation. The medium-term drag weighs on EBIT as licensing outpaces advertising yield growth.
*Our forecasts treat driver/restraint impacts as directional, not additive. The impact forecasts reflect baseline growth, mix effects, and variable interactions.
Segment Analysis
By Content Genre: Sports channels capture premium demand
Sports programming delivered 21.95% CAGR through 2031, outpacing every other genre in the Free Ad-Supported Streaming TV market. Live contests create appointment viewing that commands CPM premiums above USD 45, about 60% higher than scripted catalog rotations. The Free Ad-Supported Streaming TV market size for sports climbed sharply after CBS Sports launched the UEFA Champions League FAST channel, which streamed to incremental audiences beyond pay-TV households. Broadcasters lock in rights that maximize ad slots while athletes gain expanded visibility in cord-cutting segments. However, licensing inflation limits smaller players from securing top-tier events, reinforcing the advantage of networks with existing rights portfolios. Sports inventory also drives co-viewing, lifting household reach metrics important to blue-chip brands.
Movies remain the volume anchor at 25.10% market share, filling off-peak dayparts with familiar titles that sustain long watch times. Genre diversity broadens advertiser categories, enticing studios to curate sub-channels by era or franchise. News, kids, and unscripted programming round out offerings that mirror traditional cable lineups while leveraging digital distribution economics. The Free Ad-Supported Streaming TV market share of each genre reflects both content costs and advertiser demand elasticity, pushing operators toward balanced slates that optimize revenue per stream.


By Channel Format: Linear legacy meets on-demand acceleration
Linear FAST channels held 67.20% of viewing in 2025 as lean-back habits carry over from broadcast TV. Predictable schedules simplify ad planning and lower rights fees because studios often sell linear-only packages. At the same time, on-demand libraries expanded at a 22.97% CAGR, highlighting shifting preferences among viewers seeking control over their schedules. Dynamic ad insertion inside on-demand streams improves targeting precision and yields CPM uplifts of 15-20%, partially offsetting higher content costs.
Hybrid models rise as platforms such as Pluto TV blend live channels with VOD shelves under a single interface. This design lengthens average session duration by allowing seamless migration from curated feeds to binge viewing. The Free Ad-Supported Streaming TV market size gains resilience because ad inventory is diversified across formats, dampening volatility in any one consumption mode. As cord-nevers age into higher-spending cohorts, linear may cede incremental share to VOD, yet a complete displacement is unlikely within the forecast window.
By Distribution Platform: OEM strength and telco momentum
OEM smart-TV ecosystems accounted for 41.10% revenue in 2025, led by Samsung TV Plus and LG Channels, which occupy premium interface real estate at device setup. Their zero-install advantage delivers audience scale that attracts top advertisers and content partners. Meanwhile, telco and ISP platforms are growing at a 22.50% CAGR as providers bundle FAST lineups with broadband plans to reduce churn. Comcast’s Xumo and Cox’s integration illustrates how connectivity incumbents can monetize existing billing relationships.
OTT-first aggregators such as Tubi and Pluto TV compete via vast catalogues and data-driven personalization. Broadcaster apps leverage brand equity and linear simulcasts to capture niche audiences. Competitive intensity drives experimentation in user interfaces, where recommendations and voice navigation battle channel-surf fatigue. As distribution pathways multiply, content owners must orchestrate rights windows across partners while safeguarding CPM integrity.
By Device Type: Living-room screens lead, yet mobile scales
Smart TVs represented 53.60% of viewing hours in 2025, maintaining leadership because families prefer large screens for communal entertainment. Voice remote shortcuts and EPG guides simplify discovery, sustaining engagement levels above 110 minutes per session. Streaming sticks retrofit older sets, extending reach among cost-conscious households. In contrast, mobile and tablets are advancing at a 22.30% CAGR as Gen Z and Gen Alpha view short-form and highlight reels on the go.
Cross-device behavior intensifies as audiences start an episode on mobile during commutes and finish on television at home, complicating frequency management for advertisers. Measurement firms deploy deterministic device graphs to link exposures across screens, preserving campaign efficiency. The Free Ad-Supported Streaming TV industry increasingly designs creative with responsive layouts that accommodate both portrait and widescreen formats without compromising brand safety.
By Advertising Inventory Type: Video dominance with interactive lift
In-stream video ads contributed 78.20% of impressions in 2025 because they map cleanly to traditional 15- and 30-second television spots that media buyers understand. Standardization by the IAB ensures seamless trafficking and measurement across supply sources. Interactive and shoppable units, while only 6.10% of inventory, are rising at 22.40% CAGR as performance marketers chase attributable actions. QR code prompts and remote control clicks reduce friction and drive conversion rates above 2%.
Overlay banners and sponsorship takeovers diversify ad load, giving brands cost-effective frequency between video pods. Programmatic auctions allocate inventory in milliseconds based on audience segment value, lifting overall yield. As creatives evolve toward personalized experiences, the Free Ad-Supported Streaming TV market unlocks incremental revenue streams without increasing total ad time per hour, protecting viewer satisfaction.
Geography Analysis
North America captured 71.10% of the Free Ad-Supported Streaming TV market in 2025, supported by mature broadband coverage and an advertising ecosystem fluent in programmatic buying. The United States election cycle drove political ad surges that filled 100% of prime FAST inventory weeks in advance, proving scalability for marquee events. Privacy statutes such as CCPA introduce compliance overhead yet foster trust that underpins premium rates. Canada mirrors trends as 46% of households shed cable in 2024, turning to FAST for cost relief.
Europe is fragmented by language and regulation, but gains traction as subscription price hikes push consumers toward free alternatives. GDPR raised data-processing costs; nonetheless, it reassures advertisers of inventory quality. AI dubbing cuts localization expense by as much as 70%, accelerating cross-border rollouts. Markets such as Germany and Spain see broadcasters partnering with device makers to pre-install national FAST services, keeping local content prominent.
Asia-Pacific posts the fastest 22.10% CAGR through 2031. Smartphone-first cultures in India, Indonesia, and the Philippines watch ad-funded drama serials that compress into lower-bandwidth proxies. South Korea champions original FAST channels exported across the region, supported by government subsidies for cultural content. Telcos bundle zero-rating data for streaming, sidestepping affordability barriers. Diverse regulatory climates demand agility, yet localization investment pays off as advertisers chase the region’s expanding middle class.

Competitive Landscape
The Free Ad-Supported Streaming TV market remains moderately concentrated, with no player controlling more than 15% of global hours. OEM platforms leverage hardware to onboard users effortlessly, creating durable moats. Content-centric aggregators differentiate on library depth and recommendation accuracy, as seen in Tubi surpassing 97 million monthly active users in 2024. Broadcasters hedge linear revenue by spinning catalogues into FAST channels, while telcos seek incremental ARPU through integrated packages.
Technology innovation shapes competitive positions. Patent filings around edge caching and vector embeddings reveal an arms race to lower latency and improve personalization. Interactive ad enablement requires proprietary SDKs, locking advertisers into ecosystems that demonstrate superior conversion. Data privacy competence becomes a selling point when forging brand partnerships under evolving regulations. Rising licensing costs incentivize vertical integration, triggering acquisitions such as Walmart’s USD 2.3 billion purchase of Vizio, which marries TV hardware, FAST services, and retail media opportunities.
White-space opportunities persist in non-English emerging markets where local content quotas create entry barriers for global incumbents. Partnerships with regional studios or governmental media boards unlock catalogues that resonate culturally. Smaller operators may consolidate or specialize in genres like telenovelas or esports to escape scale disadvantages. Over the forecast, leadership will hinge on content control, data sophistication, and multi-device user experience.
Free Ad-Supported Streaming TV Industry Leaders
Amazon.com, Inc.
Fox Corporation (Tubi, Inc.)
Paramount Global (Pluto Inc.)
Roku, Inc.
Comcast Corporation (Xumo, LLC)
- *Disclaimer: Major Players sorted in no particular order


Recent Industry Developments
- February 2025: Outbrain acquired Teads for USD 900 million to merge content recommendation with connected-TV video inventory.
- February 2025: Walmart closed a USD 2.3 billion deal for Vizio, gaining a smart-TV brand and FAST streaming foothold.
- February 2025: Fox Corporation announced Tubi reached 97 million MAUs and 10 billion streaming hours in 2024.
- February 2025: Super Bowl LIX on FOX and Tubi generated USD 800 million in combined advertising revenue.


Global Free Ad-Supported Streaming TV Market Report Scope
| Movies Channels |
| News Channels |
| Sports Channels |
| Reality and Unscripted Channels |
| Kids and Family Channels |
| Documentary and Educational Channels |
| Linear FAST Channels |
| On-Demand AVOD Libraries |
| OEM-Owned Smart-TV Platforms |
| OTT-First Aggregators (Pluto, Tubi, etc.) |
| Broadcaster-Owned Apps |
| Telco and ISP Platforms |
| Smart TVs |
| Streaming Sticks and Boxes |
| Mobile and Tablets |
| Desktops and Laptops |
| In-Stream Video Ads |
| Interactive and Shoppable Ads |
| Sponsorship / Branded Channels |
| Programmatic Overlay / Display Ads |
| North America | United States | |
| Canada | ||
| Mexico | ||
| Europe | Germany | |
| United Kingdom | ||
| France | ||
| Russia | ||
| Rest of Europe | ||
| Asia-Pacific | China | |
| Japan | ||
| India | ||
| South Korea | ||
| Australia | ||
| Rest of Asia-Pacific | ||
| Middle East and Africa | Middle East | Saudi Arabia |
| United Arab Emirates | ||
| Rest of Middle East | ||
| Africa | South Africa | |
| Egypt | ||
| Rest of Africa | ||
| South America | Brazil | |
| Argentina | ||
| Rest of South America | ||
| By Content Genre | Movies Channels | ||
| News Channels | |||
| Sports Channels | |||
| Reality and Unscripted Channels | |||
| Kids and Family Channels | |||
| Documentary and Educational Channels | |||
| By Channel Format | Linear FAST Channels | ||
| On-Demand AVOD Libraries | |||
| By Distribution Platform | OEM-Owned Smart-TV Platforms | ||
| OTT-First Aggregators (Pluto, Tubi, etc.) | |||
| Broadcaster-Owned Apps | |||
| Telco and ISP Platforms | |||
| By Device Type | Smart TVs | ||
| Streaming Sticks and Boxes | |||
| Mobile and Tablets | |||
| Desktops and Laptops | |||
| By Advertising Inventory Type | In-Stream Video Ads | ||
| Interactive and Shoppable Ads | |||
| Sponsorship / Branded Channels | |||
| Programmatic Overlay / Display Ads | |||
| By Geography | North America | United States | |
| Canada | |||
| Mexico | |||
| Europe | Germany | ||
| United Kingdom | |||
| France | |||
| Russia | |||
| Rest of Europe | |||
| Asia-Pacific | China | ||
| Japan | |||
| India | |||
| South Korea | |||
| Australia | |||
| Rest of Asia-Pacific | |||
| Middle East and Africa | Middle East | Saudi Arabia | |
| United Arab Emirates | |||
| Rest of Middle East | |||
| Africa | South Africa | ||
| Egypt | |||
| Rest of Africa | |||
| South America | Brazil | ||
| Argentina | |||
| Rest of South America | |||


Key Questions Answered in the Report
What is the current value of the Free Ad-Supported Streaming TV market?
The market is valued at USD 14.33 billion in 2026 and is on track to reach USD 31.29 billion by 2031.
How fast is sports content growing on FAST platforms?
Sports channels are expanding at a 21.95% CAGR through 2031, the highest among all genres.
Why are advertisers moving from linear TV to FAST?
Advertisers gain addressable reach, real-time optimization, and measurable outcomes, leading to higher returns than traditional broadcasting.
Which region leads in FAST adoption?
North America holds 71.10% of global revenue, aided by high smart-TV penetration and programmatic maturity.
What role do OEM smart-TV makers play in the market?
OEMs like Samsung and LG pre-install FAST services, securing 41.10% of platform revenue by leveraging default distribution on new TVs.
How do interactive ads improve revenue?
Interactive and shoppable formats lift engagement up to fivefold and command CPM premiums of 25-40%, boosting monetization for platforms.
Page last updated on:


