Television Broadcasting Service Market Size and Share
Market Overview
| Study Period | 2020 - 2031 |
|---|---|
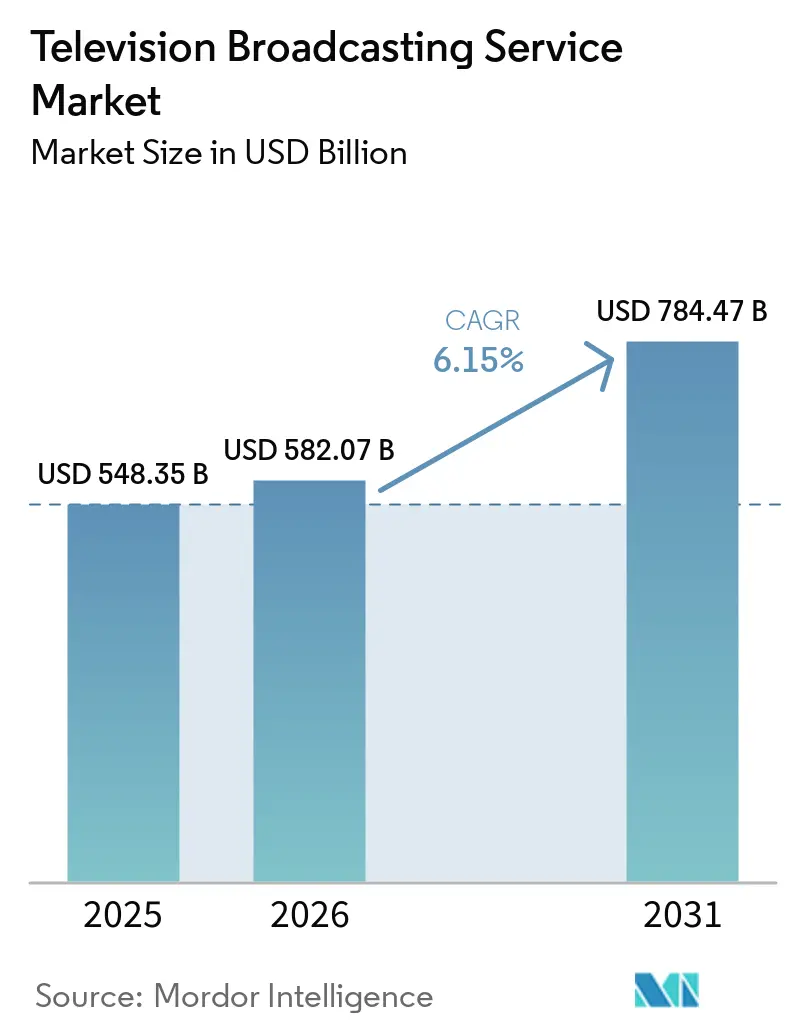
| Market Size (2026) | USD 582.07 Billion |
| Market Size (2031) | USD 784.47 Billion |
| Growth Rate (2026 - 2031) | 6.15% CAGR |
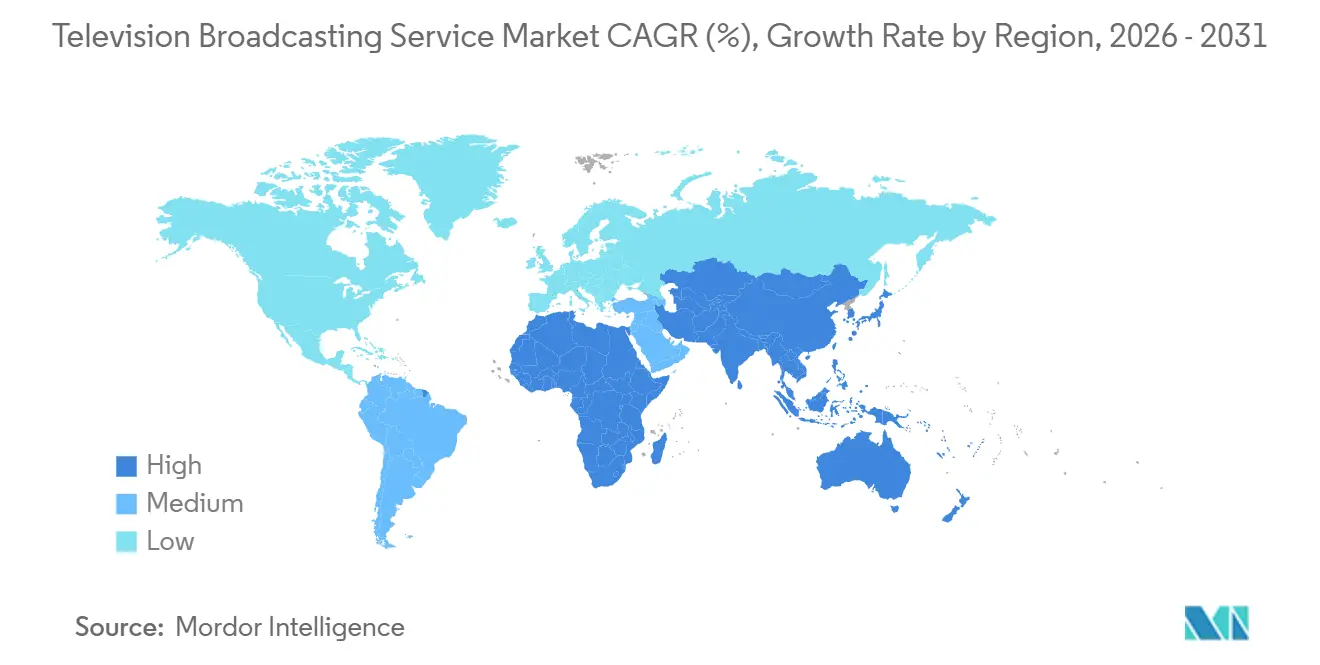
| Fastest Growing Market | Asia Pacific |
| Largest Market | North America |
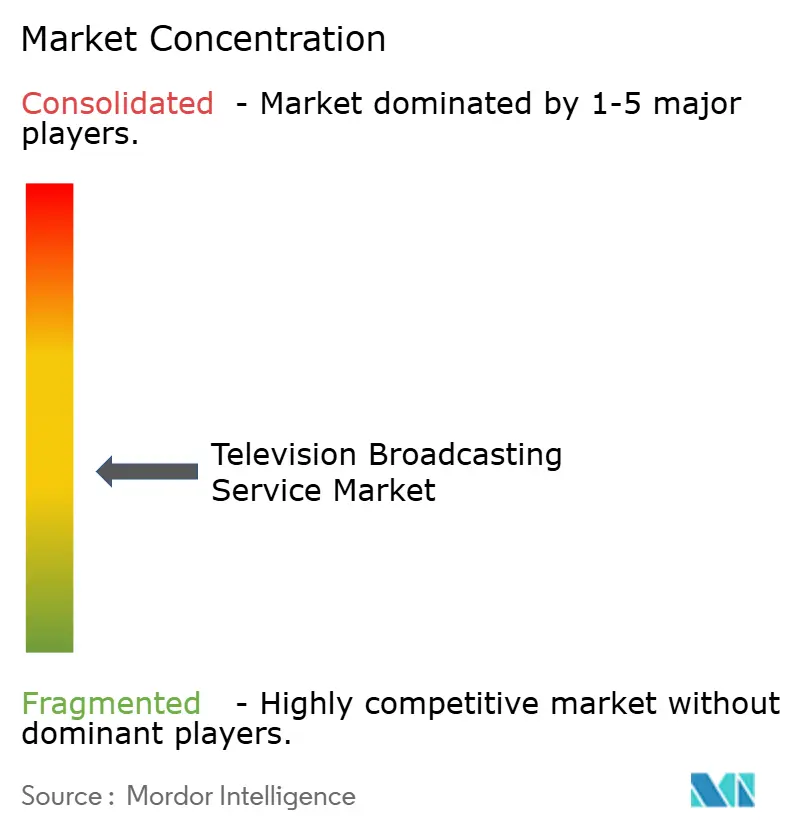
| Market Concentration | Medium |
Major Players *Disclaimer: Major Players sorted in no particular order Image © Mordor Intelligence. Reuse requires attribution under CC BY 4.0. | |
Television Broadcasting Service Market Analysis by Mordor Intelligence
The television broadcasting service market size was valued at USD 548.35 billion in 2025 and estimated to grow from USD 582.07 billion in 2026 to reach USD 784.47 billion by 2031, at a CAGR of 6.15% during the forecast period (2026-2031). Streaming captured nearly half of total viewing time in January 2026, confirming that cord-cutting has moved beyond an early-adopter phase into mass-market behavior. Advertiser migration toward connected-television inventory has restored pricing power to long-form video, lifting advertising-supported services above subscription models in annual revenue. Commercial broadcasters are refocusing capital on hybrid linear-digital workflows that allow the same content to be sold across multiple platforms, while regulatory moves to sunset legacy transmission standards free spectrum for interactive datacasting. Competitive differentiation now relies on unified technology stacks that minimize per-stream cost and on exclusive live-sports rights that anchor both audience retention and premium advertising yields.
Key Report Takeaways
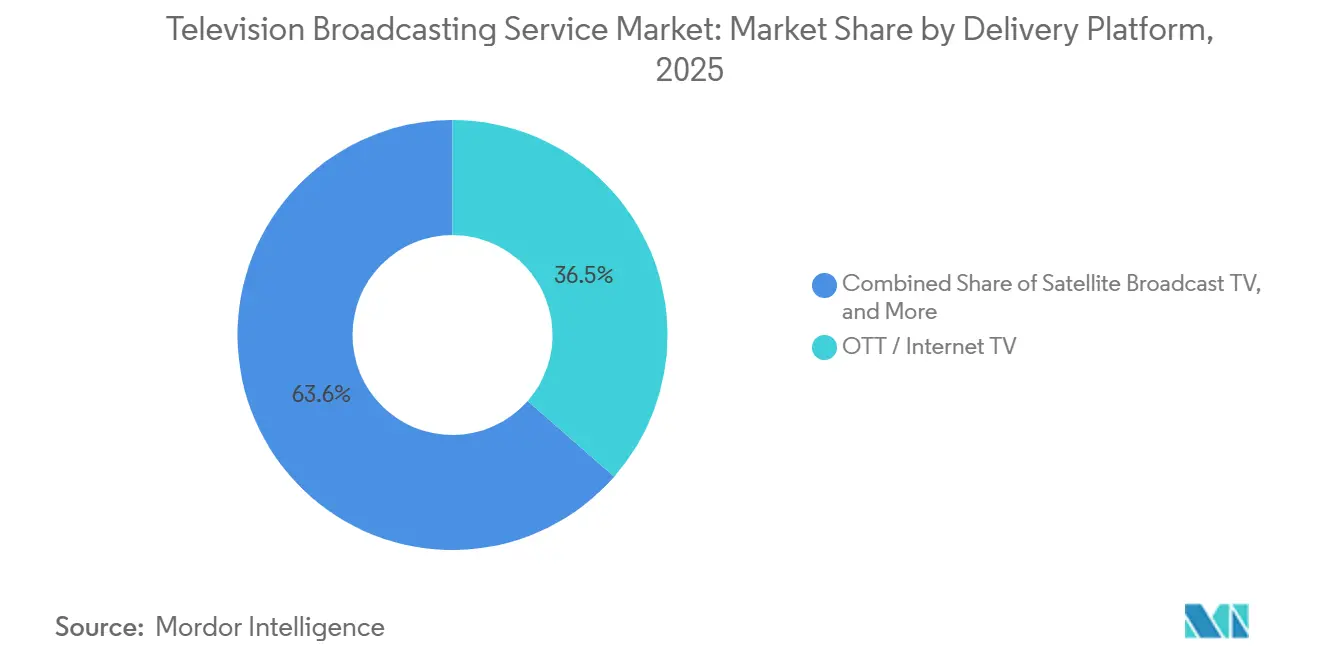
- By delivery platform, OTT and internet TV held 36.45% of 2025 revenue in the television broadcasting service market and are expanding at a 6.57% CAGR through 2031.
- By service type, advertising-supported offerings accounted for 55.78% of 2025 revenue and are projected to advance at a 6.88% CAGR through 2031.
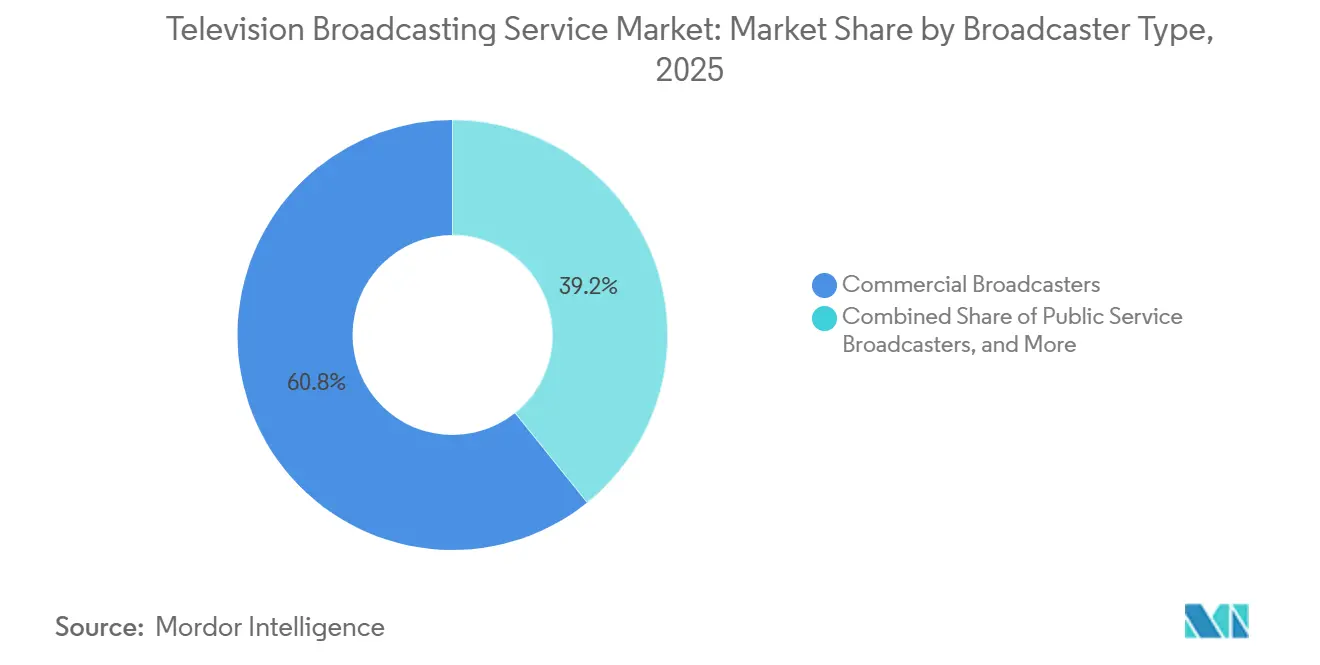
- By broadcaster type, commercial operators controlled 60.78% of 2025 revenue in the television broadcasting service market and are forecast to grow at a 7.11% CAGR to 2031.
- By content genre, sports is the fastest-growing category at a 6.22% CAGR, outpacing entertainment and drama, which nevertheless commanded the largest 31.45% revenue share in 2025.
- Asia-Pacific dominated regional performance with 32.87% of 2025 revenue, while the Middle East is set to record the highest 7.98% CAGR between 2026 and 2031.
Note: Market size and forecast figures in this report are generated using Mordor Intelligence’s proprietary estimation framework, updated with the latest available data and insights as of January 2026.
Global Television Broadcasting Service Market Trends and Insights
Drivers Impact Analysis*
| Driver | (~)% Impact on CAGR Forecast | Geographic Relevance | Impact Timeline |
|---|---|---|---|
| Cord-Cutting Pushes Adoption of OTT and Streaming TV | +1.8% | Global, led by North America and Western Europe | Medium term(2–4 years) |
| Growing Advertiser Demand for Live-Sports Inventory | +1.5% | North America, Europe, Asia-Pacific core markets | Short term(≤2 years) |
| Broadband and Smart-TV Penetration in Emerging Markets | +1.3% | Asia-Pacific, Middle East, South America | Long term(≥4 years) |
| Roll-Out of ATSC 3.0 Enabling Interactive Broadcasts | +0.7% | North America, early pilots in South Korea | Medium term(2–4 years) |
| OEM-Backed FAST Channel Ecosystems Gain Traction | +0.9% | Global, led by North America and Europe | Short term(≤2 years) |
| Cloud-Based Playout Lowers Entry Barriers for Niche Networks | +0.5% | Global, especially emerging-market entrants | Long term(≥4 years) |
| Source: Mordor Intelligence | |||
Cord-Cutting Pushes Adoption of OTT and Streaming TV
Streaming’s share of total television usage reached 47% in January 2026, a 5.4-point jump in 12 months. Households keep high-speed broadband but cancel multichannel bundles, funneling spending toward à-la-carte apps that bundle on-demand libraries with live linear channels. Comcast lost 10% of domestic linear pay-TV subscribers year-over-year in Q4 2025, yet Peacock added 12% more paid subscribers over the same period.[1]Comcast Advertising, “FAST Channels 2024: Insights and Trends,” Comcast Advertising, comcastadvertising.com Free ad-supported services accelerate churn from cable because zero subscription cost slashes switching friction; Tubi and The Roku Channel each posted mid-single-digit viewing-share gains by January 2026. Broadcasters therefore prioritize seamless app experiences and robust libraries over carriage negotiations, shifting capital toward direct-to-consumer technology.
Growing Advertiser Demand for Live-Sports Inventory
Sports rights appreciated 113% in value between 2014 and 2024, dwarfing overall advertising growth because brands prize real-time reach and high engagement. Netflix’s World Baseball Classic stream in Japan drew 31.4 million viewers, illustrating that even subscription-first platforms will pay premiums for exclusive live events. On FAST services, sports channels enjoyed 105% advertising-revenue growth and 71% higher ad recall than short-form video. Deep-pocketed streamers and national broadcasters thus lock up marquee properties, forcing regional networks to pivot toward niche sports or shoulder programming.
Broadband and Smart-TV Penetration in Emerging Markets
Fiber rollouts and cheaper smart TVs compress decades of infrastructure evolution into a five-year window. Zee5 revenue surged 73.2% year-over-year in Q3 FY26 to INR 4.2 billion (USD 50.4 million) while turning EBITDA-positive at INR 564 million (USD 6.8 million). Brazil’s Globoplay exceeded 100 million downloads by pairing live channels with on-demand telenovelas and exclusive football rights. South Korea’s TVING grew to 8 million monthly active users by October 2024 and targets 15 million by 2027, helped by ad-inventory integration with Wavve. Global streamers must localize content, pricing, and payment options or risk ceding share to these regional champions.
Roll-Out of ATSC 3.0 Enabling Interactive Broadcasts
The FCC’s October 2025 proposal to drop ATSC 1.0 simulcast rules frees spectrum for next-generation services. Pearl TV began a converter-box voucher program in April 2026 aimed at 15 million over-the-air households, replicating the 2009 digital-TV transition. ATSC A/344, published in June 2025, defines interactive triggers that let broadcasters overlay e-commerce links or real-time stats without broadband backhaul. However, receiver penetration lags because most new TVs still ship with ATSC 1.0 tuners, delaying monetization of targeted advertising and datacasting.
Restraints Impact Analysis*
| Restraint | (~)% Impact on CAGR Forecast | Geographic Relevance | Impact Timeline |
|---|---|---|---|
| SVOD Platforms Cannibalizing Linear Viewership | -1.2% | Global, strongest in North America and Western Europe | Short term (≤2 years) |
| Escalating Premium-Rights Acquisition Costs | -0.9% | Global, acute in competitive sports-rights markets | Medium term (2–4 years) |
| Local Content and Foreign-Ownership Regulation Caps | -0.6% | Europe, Asia-Pacific, Middle East | Long term (≥4 years) |
| Spectrum Refarming for 5G Reduces Terrestrial Capacity | -0.4% | North America, Europe, select Asia-Pacific markets | Long term (≥4 years) |
| Source: Mordor Intelligence | |||
SVOD Platforms Cannibalizing Linear Viewership
Warner Bros Discovery’s linear-networks revenue fell 12% year-over-year in Q4 2025 even as streaming subscribers rose to 131.6 million.[2]Warner Bros Discovery, “Quarterly Results,” Warner Bros Discovery, wbd.com Linear advertising inventory shrinks alongside audience migration, and per-viewer revenue on SVOD is lower than on scheduled broadcasts. Comcast lost 10% of domestic pay-TV households in Q4 2025, reinforcing a decade-long cord-cutting trend. Broadcasters must therefore fund duplicative infrastructure to run direct-to-consumer apps while still maintaining legacy networks, compressing margins during transition.
Escalating Premium-Rights Acquisition Costs
Rights inflation outpaces revenue growth, particularly for tier-one sports. Fuji Television’s multiyear Formula 1 deal, covering 24 races annually from 2026, exceeds USD 100 million per year based on comparable European contracts. Netflix paid Warner Bros Discovery USD 2.8 billion to exit a library agreement early so it could redirect capital to WWE and NFL events. Mid-tier broadcasters retreat to niche genres or regional content, which delivers lower ad rates and weakens cross-promotion capability.
*Our forecasts treat driver/restraint impacts as directional, not additive. The impact forecasts reflect baseline growth, mix effects, and variable interactions.
Segment Analysis
By Delivery Platform: OTT Lifts Overall Growth While Legacy Channels Stabilize
OTT and internet TV captured 36.45% of 2025 revenue in the television broadcasting service market and will rise at a 6.57% CAGR to 2031. The surge reflects smart-TV operating systems that foreground streaming apps and mobile networks that zero-rate video traffic. Cable and satellite still anchor rural and maritime distribution, yet subscriber erosion continues as low-earth-orbit broadband promises viable alternatives within three years. Terrestrial broadcast TV benefits from ATSC 3.0 interactivity, but spectrum refarming limits expansion. IPTV’s share remains confined to carrier bundles in fiber-rich geographies.
Broadcasters now deploy converged technology stacks so that one asset manifests as a linear channel, an on-demand episode, and a FAST feed with dynamic ad insertion. Paramount unified its Paramount+ and Pluto TV workflows in Q4 2025, cutting per-stream cost by 15%. This model safeguards scale economics while surfing audience preference shifts, ensuring that the television broadcasting service market size for OTT platforms grows without wholly cannibalizing legacy formats.


By Service Type: Advertiser-Funded Modes Reclaim Momentum
Advertising-supported offerings controlled 55.78% of 2025 revenue and are projected to expand at a 6.88% CAGR, exceeding subscription growth as households manage budget fatigue. Netflix’s ad tier achieved 190 million monthly active users in Q1 2026, materially boosting quarterly revenue of USD 12.25 billion. Roku’s USD 1.22 billion Q4 2025 platform revenue validates FAST economics, where higher completion rates and granular targeting lift CPMs.
Subscription services still underpin blockbuster originals but face churn spikes when catalogs stagnate. Hybrid models now dominate: a free, ad-supported on-ramp funnels users toward premium tiers, capturing willingness-to-pay across the income curve. The television broadcasting service market share mix therefore tilts back toward advertising, yet margins improve because programmatic systems automate inventory sales.
By Broadcaster Type: Commercial Operators Exploit Dual Income Streams
Commercial operators held 60.78% of 2025 revenue and will grow 7.11% annually, leveraging both advertising and subscription cash flows. Paramount+ reached 79 million subscribers in Q4 2025 while Pluto TV’s global monthly active users topped 80 million, proving that freemium ecosystems can coexist under one corporate umbrella. CJ ENM’s TVING saw advertising jump 74.7% after merging inventory with Wavve, underscoring scale advantages.
Public-service broadcasters contend with statutory caps on commercial income, and community stations depend on volunteer labor, constraining investment. Commercial players recycle linear cash flows into streaming originals and live sports, preserving the television broadcasting service market size advantage while public and community peers stagnate.
By Content Genre: Sports Accelerates While Entertainment Anchors Volume
Sports is the fastest-growing genre at a 6.22% CAGR to 2031, stimulated by advertiser demand for appointment viewing that resists time-shifting. Comcast Advertising measured 105% growth in FAST-sports ad spend and 71% higher recall versus short-form video. Entertainment and drama still command 31.45% of revenue, filling prime-time grids and binge queues.
News retains spikes during crisis events but struggles in routine cycles, prompting always-on streaming channels that remix wire feeds. Kids programming benefits from repeat viewing yet faces data-privacy scrutiny. Niche documentaries and lifestyle shows find global micro-audiences because distribution costs inside the television broadcasting service market approach zero after initial encoding.
Geography Analysis
Asia-Pacific generated 32.87% of 2025 revenue, buoyed by India’s OTT leapfrog and China’s state-funded 5G broadcast infrastructure. Zee5’s EBITDA-positive milestone at INR 564 million (USD 6.8 million) confirms unit-economics viability for regional-language platforms. South Korea’s TVING integration with Wavve boosted advertising 74.7%, and Fuji Television’s exclusive Formula 1 rights bet on premium sports loyalty.
Linear platforms in North America and Europe are witnessing a managed decline, which is being offset by the growth of streaming services. By Q1 2026, Peacock achieved a 12% increase in paid subscribers, reaching 46 million, while Comcast's linear base saw a 10% contraction. The FCC's proposed ATSC 1.0 sunset is expediting the transition to IP-centric distribution models. Meanwhile, European quotas and ownership caps are adding complexity to consolidation efforts in the region.
The Middle East is forecast to post the highest 7.98% CAGR, underwritten by sovereign wealth-fund backing of local studios and fiber-to-the-home builds that enable 4K HDR linear channels. South America pivots around Brazil’s Globoplay, exceeding 100 million downloads, leveraging Portuguese-language football rights to fend off global entrants. Africa remains nascent because broadband affordability limits mass adoption, but mobile-first models promise catch-up growth in the outer forecast years.

Competitive Landscape
The television broadcasting service market exhibits moderate concentration: the top 10 companies control roughly 40% of global revenue. Legacy conglomerates divest fading cable networks to fund streaming and collapse siloed infrastructures to one unified platform. Warner Bros Discovery delivered USD 393 million streaming EBITDA in Q4 2025 after merging Max and Discovery+ and dropping under-performing scripted shows. Paramount’s single content-management system now feeds both Paramount+ and Pluto TV, trimming per-stream cost by 15%.
Free ad-supported streaming television (FAST) is emerging as a key battleground, driven by the growing demand for cost-effective content consumption. In Q4 2025, Roku's platform revenue surged 18% year-over-year, reaching USD 1.22 billion, as brands shifted their budgets towards connected-TV formats to capitalize on the increasing viewership. Channels backed by OEMs, pre-loaded on smart-TV home screens, achieve immediate scale, sidestepping expensive user-acquisition campaigns. This approach allows advertisers to reach a broader audience while minimizing costs, making FAST an attractive option in the evolving media landscape.
Regional champions exhibit defensive strength. Zee5 leveraged cricket rights and Hindi dramas to reach profitability within a price-sensitive market. ATSC 3.0 interactivity gives local U.S. stations a personalization tool once reserved for digital natives, potentially defending advertising share against streaming in 2027-2028.[3]Advanced Television Systems Committee, “ATSC 3.0 Deployment Update,” ATSC, atsc.org
Television Broadcasting Service Industry Leaders
British Broadcasting Corporation (BBC)
Comcast Corporation
Paramount Global (formerly ViacomCBS Inc.)
The Walt Disney Company
Warner Bros. Discovery, Inc.
- *Disclaimer: Major Players sorted in no particular order

Recent Industry Developments
- April 2026: Pearl TV began distributing converter-box vouchers that fully cover hardware costs for 15 million over-the-air households, aiming to accelerate ATSC 3.0 adoption.
- January 2026: Netflix posted USD 12.25 billion Q1 revenue with a 32.3% operating margin as its ad tier hit 190 million MAUs; it also redirected USD 2.8 billion from a terminated library deal toward WWE and NFL rights.
- January 2026: Comcast recorded USD 31.457 billion Q1 revenue, with Peacock’s 46 million paid subscribers generating USD 2.1 billion; sports channels on FAST services grew 105% in ad spend.
- October 2025: The FCC proposed eliminating the ATSC 1.0 simulcast rule to free spectrum for datacasting and interactive services.


Global Television Broadcasting Service Market Report Scope
The television broadcasting service market refers to the global industry engaged in the delivery of television content through terrestrial, satellite, cable, and digital platforms, serving billions of viewers worldwide.
The Television Broadcasting Service Market Report is Segmented by Delivery Platform (Terrestrial Broadcast TV, Satellite Broadcast TV, Cable TV, IPTV, OTT/Internet TV), Service Type (Subscription-Based, Advertising-Supported, Pay-Per-View/Transactional), Broadcaster Type (Public Service, Commercial, Community/Educational), Content Genre (Entertainment and Drama, Sports, News and Current Affairs, Kids and Family, Other), and Geography (North America, Europe, Asia-Pacific, Middle East and Africa, South America). Market Forecasts are Provided in Terms of Value (USD).
| Terrestrial Broadcast TV |
| Satellite Broadcast TV |
| Cable TV |
| IPTV |
| OTT / Internet TV |
| Subscription-Based Services |
| Advertising-Supported Services |
| Pay-Per-View / Transactional |
| Public Service Broadcasters |
| Commercial Broadcasters |
| Community / Educational Broadcasters |
| Entertainment and Drama |
| Sports |
| News and Current Affairs |
| Kids and Family |
| Other Content Genre |
| North America | United States | |
| Canada | ||
| Mexico | ||
| Europe | Germany | |
| United Kingdom | ||
| France | ||
| Russia | ||
| Rest of Europe | ||
| Asia-Pacific | China | |
| Japan | ||
| India | ||
| South Korea | ||
| Australia | ||
| Rest of Asia-Pacific | ||
| Middle East and Africa | Middle East | Saudi Arabia |
| United Arab Emirates | ||
| Rest of Middle East | ||
| Africa | South Africa | |
| Egypt | ||
| Rest of Africa | ||
| South America | Brazil | |
| Argentina | ||
| Rest of South America | ||
| By Delivery Platform | Terrestrial Broadcast TV | ||
| Satellite Broadcast TV | |||
| Cable TV | |||
| IPTV | |||
| OTT / Internet TV | |||
| By Service Type | Subscription-Based Services | ||
| Advertising-Supported Services | |||
| Pay-Per-View / Transactional | |||
| By Broadcaster Type | Public Service Broadcasters | ||
| Commercial Broadcasters | |||
| Community / Educational Broadcasters | |||
| By Content Genre | Entertainment and Drama | ||
| Sports | |||
| News and Current Affairs | |||
| Kids and Family | |||
| Other Content Genre | |||
| By Geography | North America | United States | |
| Canada | |||
| Mexico | |||
| Europe | Germany | ||
| United Kingdom | |||
| France | |||
| Russia | |||
| Rest of Europe | |||
| Asia-Pacific | China | ||
| Japan | |||
| India | |||
| South Korea | |||
| Australia | |||
| Rest of Asia-Pacific | |||
| Middle East and Africa | Middle East | Saudi Arabia | |
| United Arab Emirates | |||
| Rest of Middle East | |||
| Africa | South Africa | ||
| Egypt | |||
| Rest of Africa | |||
| South America | Brazil | ||
| Argentina | |||
| Rest of South America | |||


Key Questions Answered in the Report
What is the current size of the television broadcasting service market, and how fast is it growing?
The television broadcasting service market size stood at USD 582.07 billion in 2026 and is projected to reach USD 784.47 billion by 2031, reflecting a 6.15% CAGR.
Which delivery platform is expanding the fastest?
OTT and internet TV are the fastest-growing delivery platforms, advancing at a 6.57% CAGR as smart-TV operating systems and mobile data plans prioritize streaming access.
Why are advertising-supported services gaining share over subscription models?
Brands are shifting budgets to connected-TV inventory with higher recall, and consumers facing subscription fatigue welcome free ad-supported tiers, leading to 55.78% 2025 revenue share for ad-funded formats.
Which region is expected to post the highest growth through 2031?
The Middle East is forecast to record the fastest 7.98% CAGR as sovereign wealth funds finance studio builds and fiber-to-the-home rollouts.
How are broadcasters responding to rising sports-rights costs?
Large players consolidate platforms and prioritize marquee events, while smaller broadcasters pivot to niche sports or regional content to avoid unsustainable bidding wars.
What technology shift is most likely to reshape U.S. terrestrial broadcasting?
The transition to ATSC 3.0, driven by FCC efforts to sunset ATSC 1.0 simulcasting and Pearl TV's converter-box subsidies, enables targeted advertising and interactive services aligning over-the-air broadcasting with digital-first personalization.
Page last updated on:


