Free To Air Service Market Size and Share
Market Overview
| Study Period | 2020 - 2031 |
|---|---|
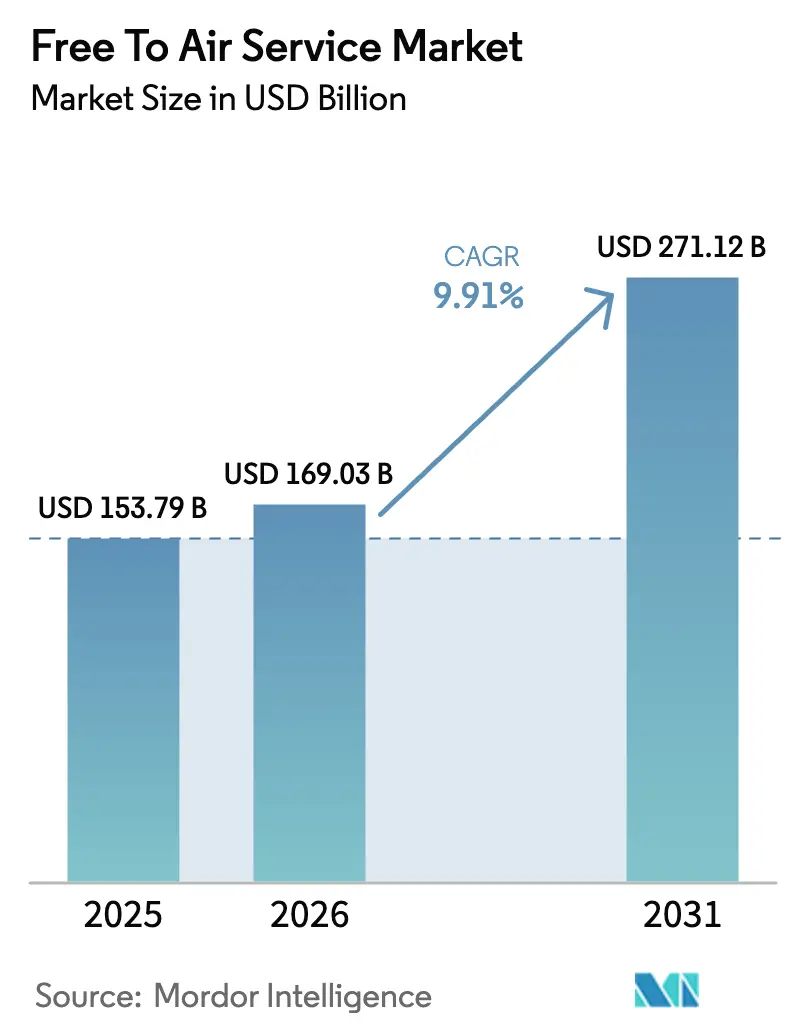
| Market Size (2026) | USD 169.03 Billion |
| Market Size (2031) | USD 271.12 Billion |
| Growth Rate (2026 - 2031) | 9.91% CAGR |
| Fastest Growing Market | Africa |
| Largest Market | Asia Pacific |
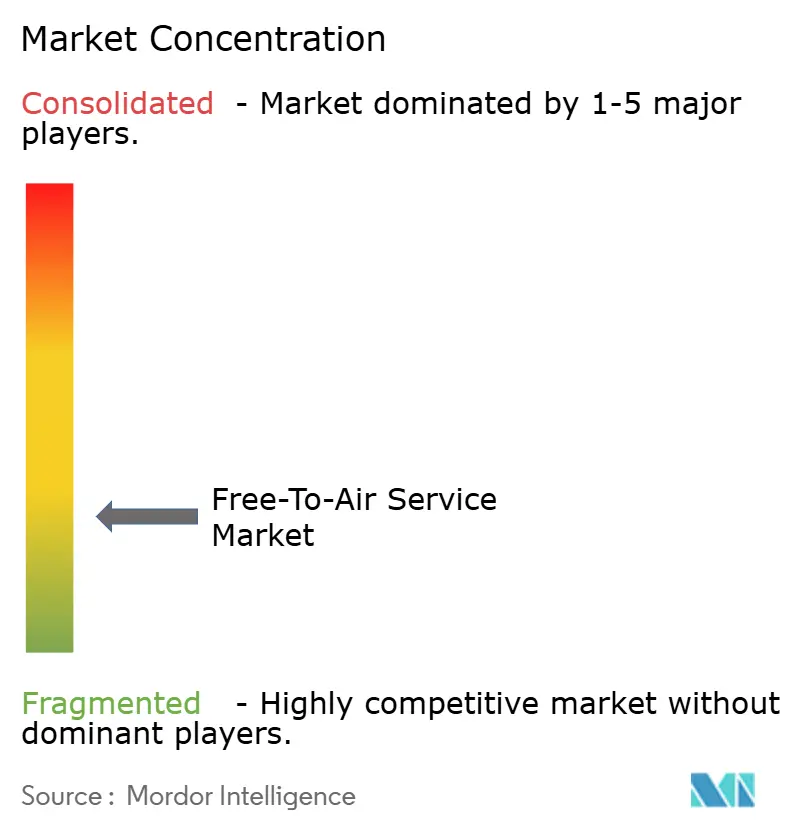
| Market Concentration | Low |
Major Players *Disclaimer: Major Players sorted in no particular order Image © Mordor Intelligence. Reuse requires attribution under CC BY 4.0. | |
Free To Air Service Market Analysis by Mordor Intelligence
The free-to-air service market size in 2026 is estimated at USD 169.03 billion, growing from 2025 value of USD 153.79 billion with 2031 projections showing USD 271.12 billion, growing at 9.91% CAGR over 2026-2031. The expansion is anchored in large-scale digital terrestrial television rollouts, hybrid broadcast-broadband convergence, and sustained advertiser interest in mass-reach, no-pay platforms. Mandated analog switch-offs in Asia Pacific and Africa, coupled with ATSC 3.0 and DVB-T2 upgrades in North America and Europe, raise spectrum efficiency and unlock 4K, interactive, and mobile reception capabilities. Advertisers accelerate programmatic spend on connected TV inventory as addressable ad tech matures, while viewers gravitate to high-definition, cost-free live sports and general entertainment. Device proliferation, especially 5G-enabled smartphones, broadens access where terrestrial gaps persist, positioning the free-to-air service market for resilient growth against subscription fatigue and macro-economic pressure.
Key Report Takeaways
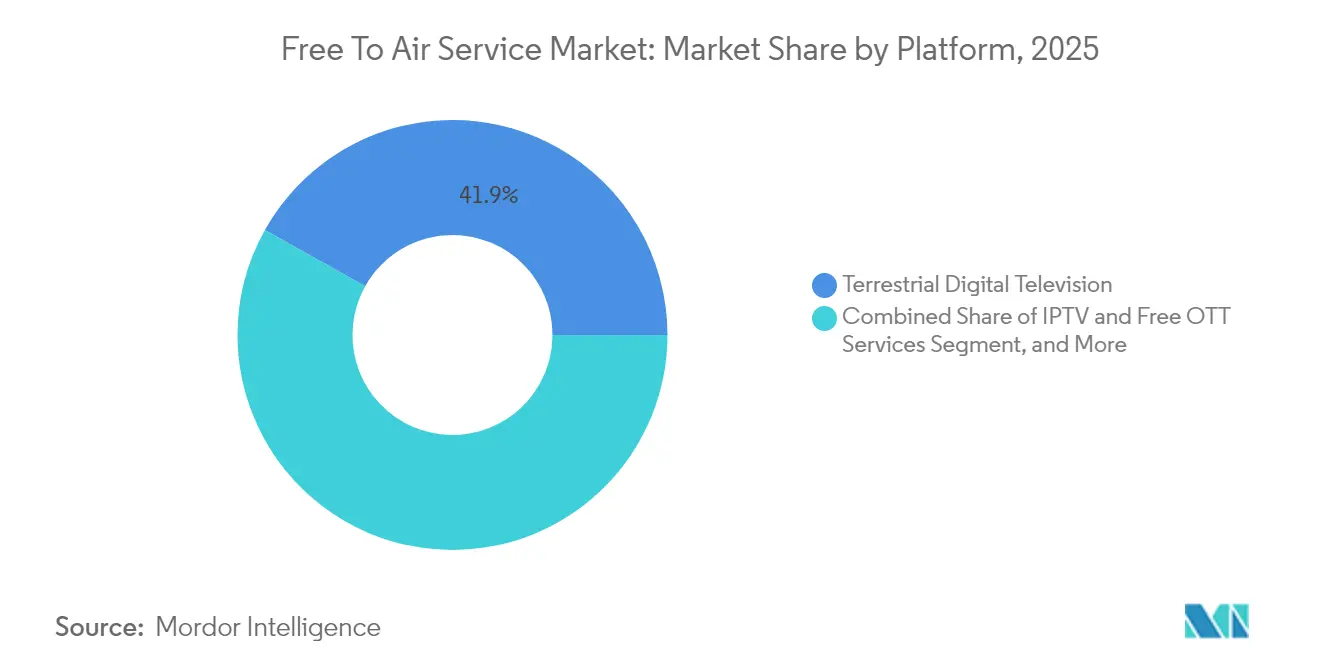
- By platform, terrestrial digital television led the free-to-air service market with a 41.88% revenue share in 2025, while IPTV and free OTT services are projected to post a 10.74% CAGR through 2031.
- By content type, general entertainment accounted for 45.10% market share of the free-to-air service market in 2025; sports content is poised for the fastest expansion, at a 10.42% CAGR through 2031.
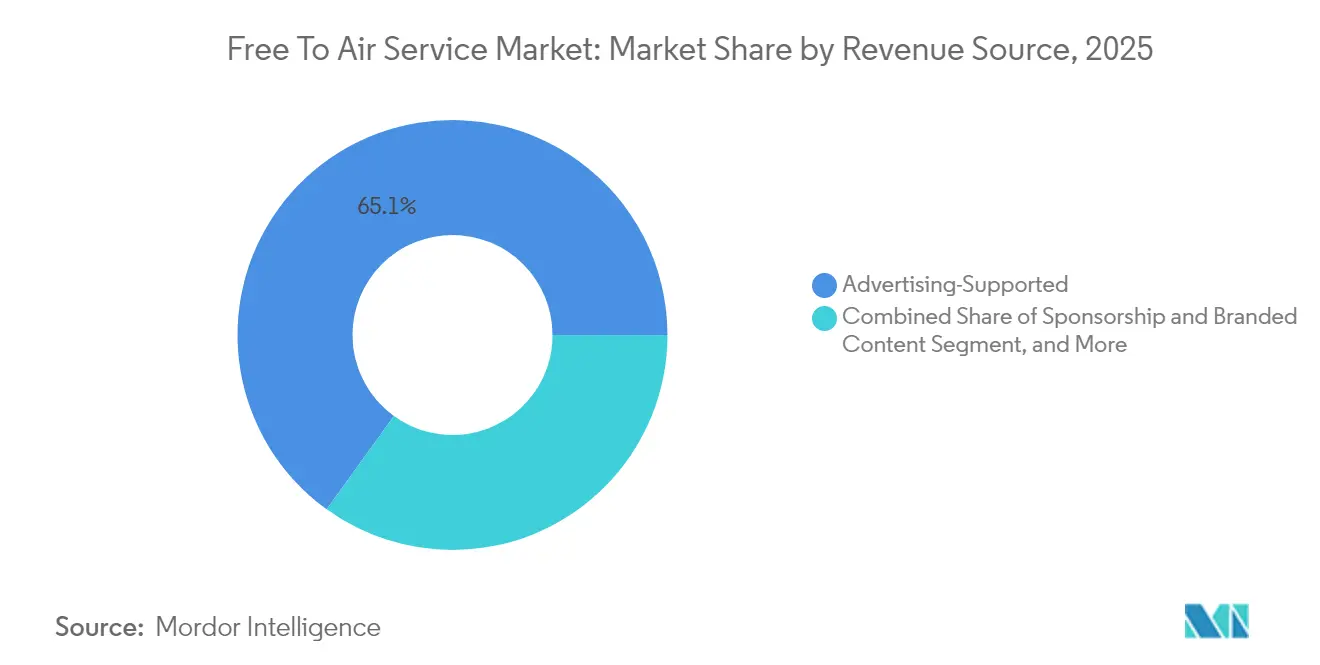
- By revenue source, advertising-supported operations contributed 65.05% market share of the free-to-air service market in 2025, whereas sponsorship and branded content are anticipated to rise at a 10.35% CAGR to 2031.
- By device type, television sets retained a 57.20% market share of the free-to-air service market in 2025; however, smartphone and tablet viewing is forecast to increase at an 10.68% CAGR through 2031.
- By geography, the Asia Pacific captured a 35.02% market share of the free-to-air service market in 2025, while Africa is expected to log a 10.31% CAGR through 2031.
Note: Market size and forecast figures in this report are generated using Mordor Intelligence’s proprietary estimation framework, updated with the latest available data and insights as of 2026.
Global Free To Air Service Market Trends and Insights
Drivers Impact Analysis*
| Driver | (~) % Impact on CAGR Forecast | Geographic Relevance | Impact Timeline |
|---|---|---|---|
| Growth in digital terrestrial television infrastructure | +2.1% | Global, concentrated in Asia Pacific and Africa | Medium term (2-4 years) |
| Rising demand for high-definition free viewing | +1.8% | North America and Europe core, expanding to Asia Pacific | Short term (≤ 2 years) |
| Advertising spend shift to free digital platforms | +1.5% | Global, led by developed markets | Short term (≤ 2 years) |
| Emergence of hybrid broadcast broadband TV standards | +1.2% | Europe primary, North America adoption accelerating | Medium term (2-4 years) |
| Low-cost direct-to-home nano-satellites enabling local FTA channels | +0.9% | Rural and remote areas globally | Long term (≥ 4 years) |
| Government spectrum reallocation incentives for public service broadcasting | +0.7% | Global with regional policy variation | Long term (≥ 4 years) |
| Source: Mordor Intelligence | |||
Growth in Digital Terrestrial Television Infrastructure
Nationwide DVB-T2 mandates in China and large-scale transmitter upgrades by India’s Doordarshan expand reach to billions of potential viewers. DVB-T2 and ATSC 3.0 compress more channels per multiplex, deliver 4K clarity, and support mobile reception, elevating free-to-air competitiveness over bandwidth-constrained streaming services. Europe’s 500 million terrestrial households now enjoy richer channel line-ups following spectrum efficiency gains, while Africa’s migration programs leverage concessional satellite backhaul for hard-to-serve regions.[1]State Administration of Radio and Television China, “Nationwide DVB-T2 Rollout Plan,” nrta.gov.cn
Rising Demand for High-Definition Free Viewing
The mass adoption of HD-ready sets prompts broadcasters to treat HD as the baseline, rather than a premium feature. Japan’s 8K showcase in 2024 underscored the reputational stakes of picture quality, spurring global upgrades. In the United Kingdom, HD signal coverage rose to 85% of terrestrial viewers, reinforcing broadcast loyalty during marquee live events where latency and clarity drive engagement.[2]Ofcom, “Television Infrastructure and Viewing Trends 2024,” ofcom.org.uk
Advertising Spend Shifts to Free Digital Platforms
Programmatic tools, dynamic ad insertion, and cross-device measurement enable broadcasters to compete for budgets historically allocated to social video. Connected TV spend increased 15% in 2024, reflecting marketers’ appetite for scale and targeted advertising. Hybrid broadcast-OTT delivery further multiplies inventory without sacrificing no-fee access, attracting cost-conscious consumers and advertisers alike.[3]Interactive Advertising Bureau, “Connected TV Ad Spend 2024,” iab.com
Emergence of Hybrid Broadcast Broadband TV Standards
HbbTV adoption, surpassing 100 million devices in Europe, converts passive screens into interactive portals. German pilots demonstrate 40% higher engagement with news when viewers can pause, restart, or vote within the broadcast environment. HbbTV 2.0 introduces companion-screen capabilities, enhancing stickiness and data capture potential that supports revenue diversification.
Restraints Impact Analysis*
| Restraint | (~) % Impact on CAGR Forecast | Geographic Relevance | Impact Timeline |
|---|---|---|---|
| Competition from subscription-based streaming services | -1.3% | Global, most acute in developed markets | Short term (≤ 2 years) |
| Decline in traditional advertising revenues | -0.8% | North America and Europe | Medium term (2-4 years) |
| Bandwidth cost inflation for 4K transmission | -0.5% | Global | Medium term (2-4 years) |
| Piracy and unauthorized re-distribution of live feeds | -0.3% | Select emerging markets | Long term (≥ 4 years) |
| Source: Mordor Intelligence | |||
Competition from Subscription-Based Streaming Services
With 260 million Netflix subscribers and 150 million Disney+ customers in 2024, streaming services erode younger audiences who prize on-demand catalogs. However, rising churn, with 47% of users canceling at least one service in 2024 due to cost, creates an opportunity for free alternatives, particularly in price-sensitive regions. Broadcasters counter by emphasizing live exclusives and integrating replay functions to replicate the convenience of time-shifting.
Decline in Traditional Advertising Revenues
Linear ad pricing softens as clients chase granular targeting, undermining prime-time incomes. Broadcasters respond with addressable ad pilots and unified audience metrics that repackage mass reach with digital accountability, slowing the revenue slide and supporting free-to-air sustainability.
*Our forecasts treat driver/restraint impacts as directional, not additive. The impact forecasts reflect baseline growth, mix effects, and variable interactions.
Segment Analysis
By Platform: Terrestrial Leads Infrastructure Modernization
The terrestrial segment accounted for 41.88% of 2025 revenues, capturing the largest share of the free-to-air service market size, thanks to mandated switch-offs and next-generation standards that enable 4K and mobile reception. Platform expansion remains buoyed by state subsidies and public-private partnerships that underwrite tower modernization and gap-filler deployments. The free-to-air service market benefits as terrestrial networks integrate with 5G broadcast modes, enabling smartphones to receive linear channels without incurring data charges, thereby cementing their relevance among digital-first viewers.
IPTV and free OTT services, expanding at an 10.74% CAGR, blend broadband personalization with broadcast reach. Operators leverage cloud playout to mirror channel line-ups online, while FAST (free ad-supported streaming TV) channels attract cord-cutters. Satellite free-to-air services remote geographies where terrestrial rollouts lag, and low-earth orbit constellations promise sub-second latency, narrowing the experience gap. Cable-free basic persists in multi-dwelling complexes where bulk agreements offer economy, yet faces attrition as consumers favor device versatility.


By Content Type: Sports Monetization Drives Growth
General entertainment held a 45.10% share of the free-to-air service market size in 2025, thanks to serial dramas, game shows, and variety formats that secure broad appeal. Localized storytelling sustains cultural linkage and advertiser affinity, underpinning stable revenue. Sports, conversely, are on a 10.42% CAGR trajectory, as rights holders value free-to-air reach for national events, illustrated by record Olympics viewership in 2024.
News maintains a trust premium during crises, where low latency and universal access override the risks associated with stream buffering. Kids and education programming gained policy support during pandemic remote-learning efforts, with broadcasters inserting curriculum blocks into daytime grids. Lifestyle and documentary strands form the long tail, monetized via sponsorships that integrate brands into contextual narratives, aligning with audience fragmentation trends.
By Revenue Source: Advertising Evolution Accelerates
Advertising-supported models accounted for 65.05% of 2025 sales, reflecting the free-to-air service market share dominance of commercials across various platforms. Programmatic tech and dynamic ad replacement elevate yield, while audience data exchanges with smart TV makers refine targeting precision. Sponsorship and branded content, growing 10.35% annually, embeds messages within storylines, offsetting ad-skip behavior on connected devices.
Public funding and license fees stabilize public service operators, although political scrutiny fosters efficiency drives and promotes transparency in audience reporting. Syndication and licensing revenues rise as hit formats migrate internationally, de-risking domestic production spend and diversifying income channels.
By Device Type: Mobile Viewing Transforms Access
Television sets remained the primary screen, with a 57.20% share in 2025; however, smartphone and tablet viewing is projected to register an 10.68% CAGR through 2031. Free-to-air portals and HbbTV companion apps enable viewers to transition seamlessly between living-room and mobile screens without authentication paywalls, thereby sustaining reach among younger demographics. PCs and laptops serve catch-up consumption at work or study locations, while smart speakers introduce voice-activated news and sports score flashes, extending the linear brand into audio.
Ambient screen proliferation necessitates adaptive bitrate streams and responsive graphics packages so that identical feeds satisfy 4-inch phones and 75-inch 4K sets. This technical alignment raises capex but deepens engagement length, reinforcing the free-to-air service industry’s long-term advertiser value.
Geography Analysis
The Asia Pacific delivered 35.02% of 2025 revenues, as China’s USD 2.8 billion DVB-T2 project blanketed 99% of its citizens, and India’s Doordarshan expanded rural high-power transmitters to achieve 95% population coverage. Japan’s 8K broadcasts and South Korea’s 5G broadcast trials are shaping global standards, while ASEAN regulators coordinate spectrum plans, thereby accelerating cross-border equipment scale economies.
Europe hosts mature public service ecosystems, yet streaming fragmentation pressures audience share. The European Broadcasting Union harmonizes HbbTV, enabling cross-market interactive services. Germany and France digitize archives and adopt cloud playout to cut opex, reinvesting savings in local drama co-productions that uphold cultural mandates.
Africa is the fastest-growing region, with a 10.31% CAGR, driven by the rollouts of satellite platforms and declines in smartphone prices, which democratize content access. Nigeria’s terrestrial expansion targets the continent’s largest youth cohort, and Kenya’s free-satellite initiative exemplifies leapfrog strategies that bypass cable infrastructure. North America and South America show steady gains as broadcasters pivot toward 4K simulcasts, ATSC 3.0 mobile reception, and addressable advertising.


Competitive Landscape
The free-to-air service market is moderately fragmented, with public broadcasters dominating their home territories through funding frameworks, while private rivals and tech entrants intensify competition. The costly transitions to ATSC 3.0 and DVB-T2 encourage channel-sharing alliances and backend mergers. Broadcasters prioritize exclusive sports rights, serialized local dramas, and original news programming to retain mass audiences, while adopting cloud automation to streamline operations.
Technology convergence spurs cross-industry deals, as chipset vendors partner with networks to preload tuner apps and satellite firms collaborate with broadcasters on direct-to-device delivery. AI-driven personalization pilots surface individualized content rails without subscription fees, mimicking SVOD interfaces to curb youth attrition. Regulatory bodies monitor media pluralism as the consolidation wave gathers pace.
Early adopters of addressable advertising secure premium CPMs, leveraging smart TV ACR data to fuse linear and digital metrics. Sustainability commitments are emerging as a brand differentiator, with European networks pledging renewable energy targets across their transmitter sites.
Free To Air Service Industry Leaders
British Broadcasting Corporation
China Central Television
National Broadcasting Company LLC
Australian Broadcasting Corporation
Nippon Hoso Kyokai
- *Disclaimer: Major Players sorted in no particular order

Recent Industry Developments
- October 2025: Brazil’s Ministry of Communications approved a USD 1.2 billion fund to accelerate the country’s analog switch-off by 2027, allocating grants for DVB-T2 transmitter upgrades and set-top-box subsidies.
- July 2025: South African Broadcasting Corporation partnered with SpaceX to trial low-earth-orbit direct-to-cell television beams, expanding free-to-air coverage to remote rural provinces.
- April 2025: India’s Prasar Bharati completed the first phase of its 5G broadcast pilot across Delhi and Mumbai, proving mobile reception of Doordarshan free-to-air channels without data usage.
- January 2025: European Broadcasting Union launched the pan-European HbbTV 3.0 certification lab in Geneva, enabling faster compliance testing for broadcasters and device manufacturers.


Global Free To Air Service Market Report Scope
| Satellite-Based Free-To-Air |
| Terrestrial Digital Television |
| Cable Free-Basic |
| IPTV and Free OTT Services |
| General Entertainment |
| Sports |
| News |
| Kids and Education |
| Other Content Type |
| Advertising-Supported |
| Public Funding and License Fee |
| Sponsorship and Branded Content |
| Syndication and Licensing |
| Television Sets |
| Smartphones and Tablets |
| PCs and Laptops |
| Smart Speakers and Radio Sets |
| North America | United States | |
| Canada | ||
| Mexico | ||
| Europe | Germany | |
| United Kingdom | ||
| France | ||
| Russia | ||
| Rest of Europe | ||
| Asia-Pacific | China | |
| Japan | ||
| India | ||
| South Korea | ||
| Australia | ||
| Rest of Asia-Pacific | ||
| Middle East and Africa | Middle East | Saudi Arabia |
| United Arab Emirates | ||
| Rest of Middle East | ||
| Africa | South Africa | |
| Egypt | ||
| Rest of Africa | ||
| South America | Brazil | |
| Argentina | ||
| Rest of South America | ||
| By Platform | Satellite-Based Free-To-Air | ||
| Terrestrial Digital Television | |||
| Cable Free-Basic | |||
| IPTV and Free OTT Services | |||
| By Content Type | General Entertainment | ||
| Sports | |||
| News | |||
| Kids and Education | |||
| Other Content Type | |||
| By Revenue Source | Advertising-Supported | ||
| Public Funding and License Fee | |||
| Sponsorship and Branded Content | |||
| Syndication and Licensing | |||
| By Device Type | Television Sets | ||
| Smartphones and Tablets | |||
| PCs and Laptops | |||
| Smart Speakers and Radio Sets | |||
| By Geography | North America | United States | |
| Canada | |||
| Mexico | |||
| Europe | Germany | ||
| United Kingdom | |||
| France | |||
| Russia | |||
| Rest of Europe | |||
| Asia-Pacific | China | ||
| Japan | |||
| India | |||
| South Korea | |||
| Australia | |||
| Rest of Asia-Pacific | |||
| Middle East and Africa | Middle East | Saudi Arabia | |
| United Arab Emirates | |||
| Rest of Middle East | |||
| Africa | South Africa | ||
| Egypt | |||
| Rest of Africa | |||
| South America | Brazil | ||
| Argentina | |||
| Rest of South America | |||


Key Questions Answered in the Report
How fast will advertising-supported revenues grow in the free-to-air service market between 2026 and 2031?
Sponsorship and branded content leads growth at a 10.35% CAGR, while traditional spot advertising modernizes through addressable formats, sustaining overall ad-led expansion.
Which platform will add the most new viewers by 2031?
IPTV and free OTT services, expanding at an 10.74% CAGR, will attract incremental audiences by combining broadcast channels with broadband personalization.
Why is Africa the fastest-growing region for free-to-air services?
Satellite investments and affordable smartphones close coverage gaps, driving a 10.31% CAGR as consumers opt for cost-free content in bandwidth-constrained markets.
What role does ATSC 3.0 play in the United States market outlook?
ATSC 3.0 enables 4K and mobile reception, letting U.S. broadcasters match streaming video quality and launch targeted advertising that boosts revenue potential.
How are broadcasters mitigating competition from streaming services?
They secure exclusive live sports, deploy HbbTV interactivity, and leverage programmatic ad tech to deliver free, high-quality content without subscription fees.
Page last updated on:


