TV White Space Spectrum Market Size and Share
Market Overview
| Study Period | 2020 - 2031 |
|---|---|
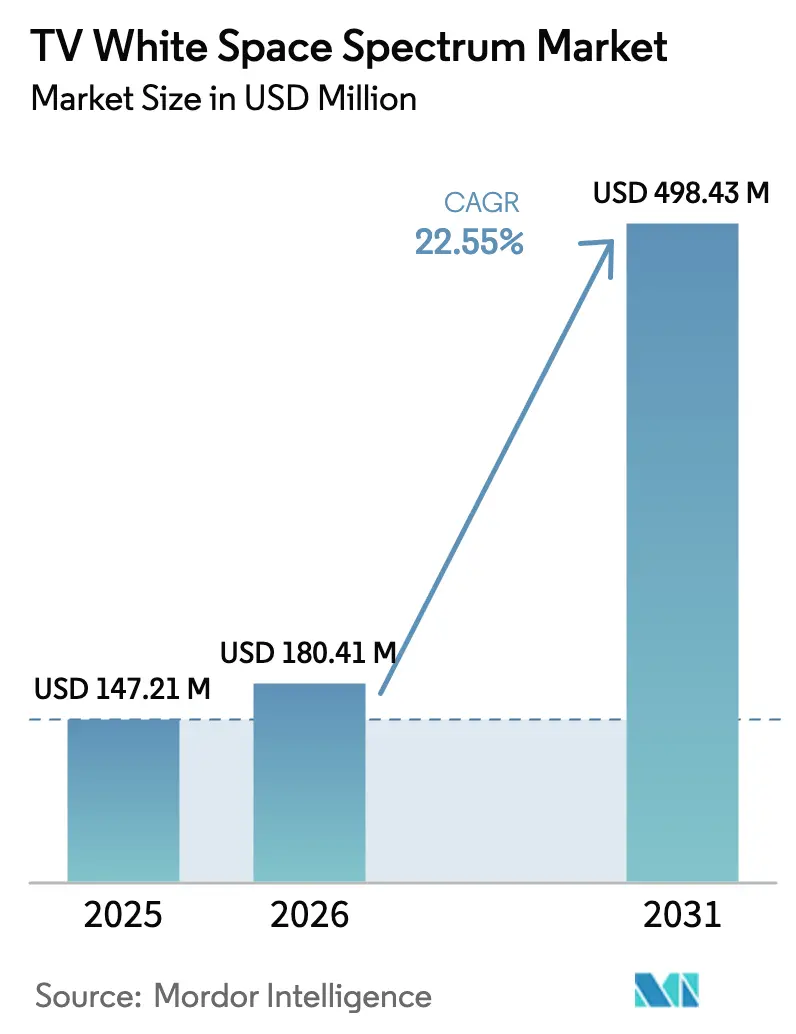
| Market Size (2026) | USD 180.41 Million |
| Market Size (2031) | USD 498.43 Million |
| Growth Rate (2026 - 2031) | 22.55% CAGR |
| Fastest Growing Market | Asia Pacific |
| Largest Market | North America |
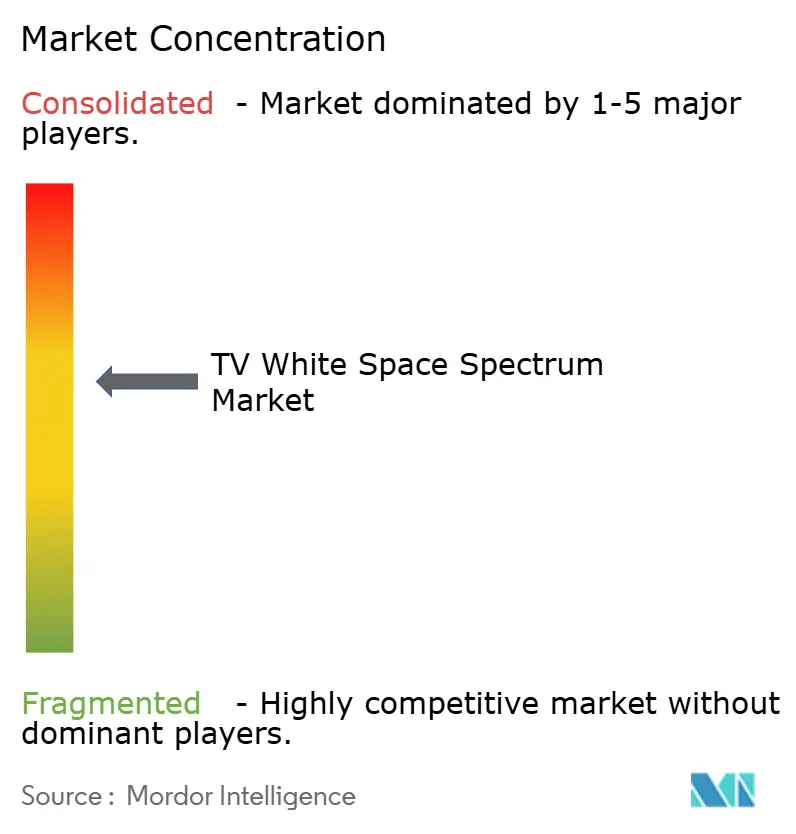
| Market Concentration | Medium |
Major Players *Disclaimer: Major Players sorted in no particular order Image © Mordor Intelligence. Reuse requires attribution under CC BY 4.0. | |
TV White Space Spectrum Market Analysis by Mordor Intelligence
The TV white space (TVWS) spectrum market size is expected to grow from USD 147.21 million in 2025 to USD 180.41 million in 2026 and is forecast to reach USD 498.43 million by 2031 at 22.55% CAGR over 2026-2031. Government-funded rural broadband programs, the increasing adoption of precision agriculture, and the growing demand for cost-efficient sub-GHz connectivity are the primary drivers behind this expansion. Early adopters continue to post favorable total-cost-of-ownership metrics compared with licensed spectrum alternatives, prompting new entrants to accelerate field trials. Cloud-managed spectrum databases have lowered engineering barriers, allowing small internet service providers to activate links in weeks rather than months. Meanwhile, established cellular operators increasingly treat TVWS)as a complementary overlay for hard-to-reach zones, a shift that supports equipment scale-out and price erosion.
Key Report Takeaways
- By device type, fixed TVWS base stations led with a 45.62% market share of the TV white space spectrum in 2025, while IoT modules are projected to advance at a 23.88% CAGR through 2031.
- By application, broadband access and rural connectivity accounted for a 56.64% share of the TV white space spectrum market size in 2025, and smart agriculture is slated to expand at a 24.05% CAGR through 2031.
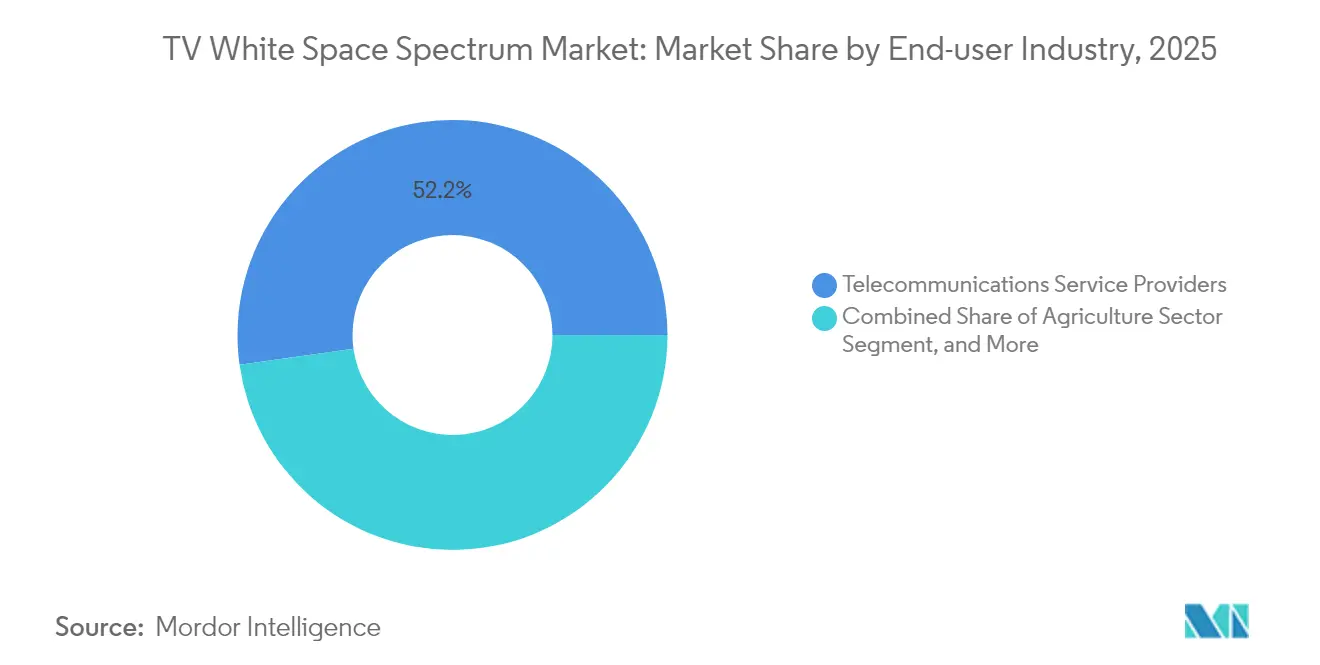
- By end-user industry, telecommunications service providers held a 52.21% revenue share in 2025, whereas the agriculture sector is forecast to record the highest CAGR of 25.63% from 2025 to 2031.
- By frequency band, UHF captured a 70.62% revenue share in 2025, but VHF is poised for the fastest growth, with a 25.20% CAGR over the forecast period.
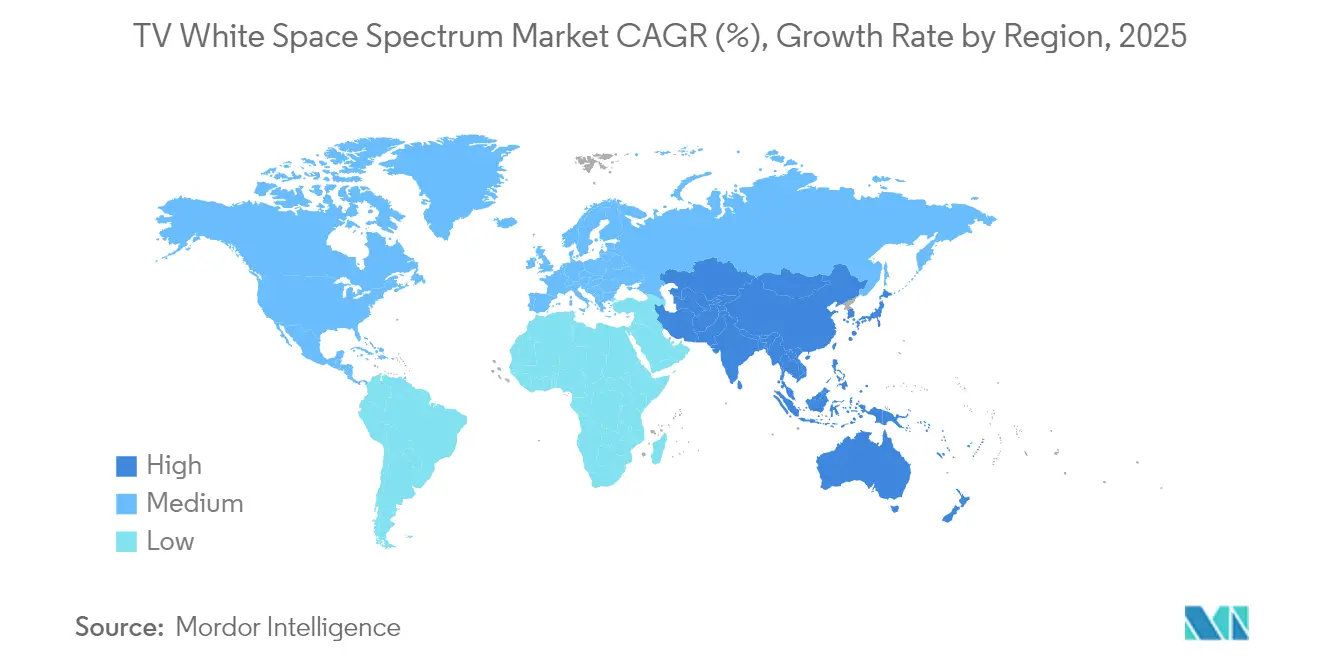
- By geography, North America dominated with a 37.92% share in 2025, and Asia-Pacific is projected to grow at a 26.02% CAGR through 2031.
Note: Market size and forecast figures in this report are generated using Mordor Intelligence’s proprietary estimation framework, updated with the latest available data and insights as of 2026.
Global TV White Space Spectrum Market Trends and Insights
Drivers Impact Analysis*
| Driver | (~) % Impact on CAGR Forecast | Geographic Relevance | Impact Timeline |
|---|---|---|---|
| Government-backed rural-broadband mandates | +4.20% | Global, with concentrated impact in North America and Asia-Pacific | Medium term (2-4 years) |
| Accelerated roll-out of smart-agriculture pilots | +3.80% | Global, particularly strong in North America, Europe, and Asia-Pacific agricultural regions | Medium term (2-4 years) |
| Cost-advantage vs. licensed spectrum for ISPs | +5.10% | Global, with highest impact in emerging markets and rural areas | Long term (≥ 4 years) |
| Rapid progress of cloud-managed spectrum databases | +2.90% | Global, with early adoption in North America and Europe | Short term (≤ 2 years) |
| Millimeter-wave congestion pushing sub-GHz alternatives | +3.40% | Global, concentrated in urban and suburban areas with high spectrum utilization | Medium term (2-4 years) |
| Green-field private-network demand in emerging markets | +4.00% | Asia-Pacific, Africa, and Latin America primarily | Long term (≥ 4 years) |
| Source: Mordor Intelligence | |||
Government-backed rural broadband mandates
Federal and regional authorities are directing multi-year capital toward last-mile connectivity, and TVWS presents one of the few sub-GHz paths with zero spectrum license costs. The United States Rural Digital Opportunity Fund earmarked USD 20.4 billion for broadband build-outs, incentivizing operators to combine fiber backhaul with TVWS access points to cover sparsely populated areas.[1]Federal Communications Commission, “Rural Digital Opportunity Fund Overview,” FCC, fcc.govThe European Union’s Digital Decade blueprint aims for full coverage of gigabit services by 2030, and member states are testing TVWS as an interim technology for remote areas. African regulators have taken it a step further by subsidizing white-space radios to reduce the number of base stations required for each rural cluster. These mandates compress payback periods for service providers, motivating hardware vendors to streamline installation kits that non-specialist contractors can deploy.
Accelerated roll-out of smart-agriculture pilots
Precision-farming projects increasingly rely on wide-area telemetry to optimize irrigation, fertilization, and autonomous machinery. Because farm plots frequently exceed 1,000 hectares, operators gravitate toward TVWS links that extend 10 kilometers or more without line-of-sight, a range seldom possible at 2.4 GHz or 5 GHz. United States Department of Agriculture pilots reported a 40% cut in per-acre connectivity cost when adopting TVWS for soil-sensor uplinks.[2]United States Department of Agriculture, “Precision Agriculture Programs,” USDA, usda.gov Japan’s Society 5.0 farming program demonstrated a similar outcome, registering higher crop-yield predictability after densifying sensor grids with TVWS backhaul. As agribusiness platforms collect finer-grained field data, connectivity resilience has become as vital as throughput, further elevating unlicensed sub-GHz links in procurement criteria.
Cost advantage versus licensed spectrum for ISPs
Every MHz-pop of licensed spectrum incurs recurring fees, regulatory filings, and sometimes auction premiums. Many rural economies cannot support that overhead, given that customer revenue per user remains below USD 15 per month. By contrast, TVWS leverages guard bands built into broadcast allocations, so ISPs face no access payments. Field studies in Kenya’s Mawingu project demonstrated a 70% cut in five-year cash outlay when substituting TVWS for licensed microwave backhaul.[3]Council for Scientific and Industrial Research, “Kenya Mawingu TVWS Trials,” CSIR, csir.co.zaSimilar comparisons in the United States show that spectrum acquisition costs exceed infrastructure hardware costs in low-density counties, reversing the typical spending profile of urban carriers. As more regulators approve dynamic databases, those savings will likely compound, as operators will need fewer manual propagation studies.
Rapid progress of cloud-managed spectrum databases
White-space equipment no longer comes bundled with static look-up tables. Instead, radios query cloud services that integrate terrain data, atmospheric conditions, and live broadcast schedules. The Federal Communications Commission certified machine-learning-enhanced databases in 2024, increasing effective capacity by reducing protection margins by 30%. Singapore’s Infocomm Media Development Authority has launched a national database that dynamically adjusts transmission power in real-time, enhancing spectral efficiency by 25%.[4]Infocomm Media Development Authority, “Enhanced TVWS Regulatory Framework,” IMDA, imda.gov.sg Because the algorithms auto-update firmware, small ISPs gain enterprise-grade interference safeguards without hiring full-time RF engineers, materially lowering the skills threshold for market entry.
Restraints Impact Analysis*
| Restraint | (~) % Impact on CAGR Forecast | Geographic Relevance | Impact Timeline |
|---|---|---|---|
| Incumbent broadcast-license lobbying | -2.80% | Global, with strongest impact in North America and Europe | Medium term (2-4 years) |
| Fragmented global regulatory frameworks | -3.20% | Global, particularly affecting cross-border deployments | Long term (≥ 4 years) |
| Limited chipset availability and higher BOM costs | -2.10% | Global, with supply chain concentration in Asia-Pacific | Short term (≤ 2 years) |
| Perceived interference-risk versus LTE-NB-IoT | -1.90% | Global, strongest in markets with established cellular IoT infrastructure | Medium term (2-4 years) |
| Source: Mordor Intelligence | |||
Incumbent broadcast-license lobbying
Television networks have invested heavily in legacy spectrum and view unlicensed encroachment as revenue dilution. Lobby groups routinely argue that higher TVWS power levels could degrade over-air reception, even though peer-reviewed trials show minimal impact. In 2024, the National Association of Broadcasters petitioned the FCC to delay the implementation of expanded power limits, introducing procedural hurdles that slowed down deployments.[5]National Association of Broadcasters, “Comments on TVWS Power Limits,” NAB, nab.org European broadcast associations have coordinated similar campaigns, pressing regulators to tighten geolocation accuracy standards, which would increase the complexity and cost of radio. Such resistance extends project timelines, adding uncertainty that deters conservative investors.
Fragmented global regulatory frameworks
No single body harmonizes TVWS rules across the Americas, Europe, Africa, and the Asia-Pacific region. Power ceilings, antenna-height limits, and database protocols vary by jurisdiction, obliging vendors to offer multiple SKU variants. Equipment suppliers must certify each model country by country, a process that may last 6-12 months per target market. The European Telecommunications Standards Institute publishes one baseline, whereas the FCC maintains another, and each demands unique lab test suites.[6]European Telecommunications Standards Institute, “Harmonized Standard for TV White Space Devices,” ETSI, etsi.org Fragmentation restricts manufacturing scale and slows the price curve, limiting adoption in budget-sensitive regions until policy alignment improves.
*Our forecasts treat driver/restraint impacts as directional, not additive. The impact forecasts reflect baseline growth, mix effects, and variable interactions.
Segment Analysis
By Device Type: IoT integration accelerates base-station evolution
The fixed-station category generated 45.62% of the TV white space spectrum market size in 2025, reflecting its role as the anchor asset for rural broadband build-outs. Operators typically position these units on towers 20 meters high, achieving 8-15 kilometer radii that collapse backhaul costs in low-density zones. Vendor roadmaps now pair fixed platforms with modular antenna arrays, letting service providers repurpose hardware for sector splitting as subscriber density rises.
IoT modules, although currently accounting for only a small revenue slice, are projected to have a 23.88% CAGR, which could help close the gap within a decade. Semiconductor makers have begun embedding database query logic directly into chip firmware, trimming bill-of-materials cost by 30% relative to first-generation dongles. As agriculture and environmental-monitoring customers scale sensor counts into the thousands, penny-per-bit cost declines should accelerate unit shipments. Portable devices and miscellaneous backhaul links round out the mix, benefiting from software-defined radio cores that switch among TVWS, Wi-Fi, and LoRa in the same enclosure.


By Application: Smart agriculture transforms rural connectivity economics
Broadband access and rural connectivity applications delivered 56.64% of revenue in 2025, cementing their position as the bellwether for commercial adoption. Subsidized household plans rely on data rates between 10 and 100 Mbps, which current TVWS radios can maintain over line lengths far exceeding traditional fixed wireless.
Smart agriculture, however, holds the momentum, advancing at a 24.05% CAGR as farms digitize field operations. Multi-sensor nodes relay soil moisture, microclimate, and livestock position in near real-time, all over sub-GHz links that thrive under foliage where millimeter-wave links fail. Municipalities also deploy white-space gateways for smart lighting and public safety networks, although those segments lag behind agriculture in both deployment scale and funding velocity.
By End-user Industry: Agriculture sector disrupts traditional telecom models
Telecommunications service providers retained a 52.21% share during 2025, primarily because they own tower sites and fiber lines that feed base stations. Their multi-service bundles permit cross-subsidy of low-margin rural areas with profitable urban business, giving them an acquisition cost advantage over green-field challengers.
Yet the agriculture sector records the quickest expansion, charting a 25.63% CAGR and capturing budget from precision-input suppliers eager to bundle connectivity with analytics platforms. Utility firms and energy producers are layering white-space radios onto smart-grid and remote monitoring assets, banking on the long-range and foliage-penetration benefits unavailable in cellular NB-IoT bands. Government agencies round out demand, relying on white-space trailers for disaster recovery communications when terrestrial lines go dark.
By Frequency Band: VHF adoption accelerates despite UHF dominance
UHF commands 70.62% of installations because it enjoys global regulatory clarity and plentiful silicon. The band couples favorable propagation with respectable throughput, enabling 5-20 Mbps plans that satisfy most rural households.
VHF, though still niche, is the growth story, moving at 25.20% CAGR as spectrum scarcity pinches UHF inventories. VHF carriers travel farther and hug terrain, letting one mast cover 40% more ground than an equivalent UHF cell. Equipment cost remains 20-30% higher due to smaller shipment volumes, but database support and antenna manufacturing are improving, pointing to price convergence in the second half of the decade.
Geography Analysis
North America leads the TV white space spectrum market, accounting for 37.92% of the revenue in 2025, driven by synchronized spectrum policy, federal subsidies, and a fertile vendor ecosystem. The Rural Digital Opportunity Fund disburses staged payments as coverage milestones are met, lowering credit risk for smaller operators. Canadian regulators follow similar patterns, and Mexico’s telecom watchdog has initiated consultations to align database protocols with U.S. standards, suggesting a potential contiguous North American equipment block. The region’s agriculture giants in the Midwest and Prairie Provinces further anchor demand through precision farming rollouts that exceed 1 million connected hectares.
The Asia-Pacific region is the fastest riser, advancing at a 26.02% CAGR to 2031, as population density gradients create both rural and urban use cases. India’s Department of Telecommunications green-lit statewide pilots that cover villages spread across diverse terrain, and early evidence shows 50% lower deployment capital compared with last-mile fiber. China is integrating TVWS into its rural revitalization program, even as it builds 5G in cities, while Japan and South Korea are exploiting the band for smart-factory and agricultural IoT links. Southeast Asian nations, such as Singapore, Malaysia, and Indonesia, are harmonizing spectrum fees and database access, providing manufacturers with a contiguous market of over 650 million people.
Europe, South America, and the Middle East and Africa trail in immediate share but offer long-run upside. The European Telecommunications Standards Institute has intensified its efforts to standardize protocols; however, country-by-country licensing regimes still hinder commercial launches. Brazil and Colombia are evaluating pilot data before finalizing rules, and African regulators are leaning on public-private partnerships in which NGOs donate equipment to schools and clinics. Once harmonization tightens, pent-up demand across these continents could lift the global total well beyond current forecasts.

Competitive Landscape
The field remains moderately concentrated, with the top five vendors controlling a significant portion of shipments through a combination of proprietary base-station platforms and cloud database services. Microsoft’s Airband initiative integrates spectrum management with edge compute, giving it leverage when courting state governments that value turnkey solutions. Carlson Wireless and Adaptrum differentiate through software-defined radios capable of re-tuning across global channel plans, a must-have for operators seeking cost leverage via common hardware.
Strategic moves center on vertical integration. Database providers partner with chipset makers to embed query stacks directly in silicon, ensuring lock-in as board builders cannot swap out database vendors without re-certification. Midsize players target agricultural OEMs by bundling white-space modules within sensor arrays, enabling farmers to buy connectivity by default. Patent activity rose 18% in 2024, primarily focused on adaptive beam-forming and AI-driven interference prediction; such filings create moats but also increase royalty burdens for late entrants.
Pricing trends are downward; the average selling price for fixed base stations decreased by 12% in 2024, as volume reached 30,000 units. Yet margins remain stable because operators pay annual database service fees, a revenue model that insulates vendors from the commoditization of hardware. With international regulatory alignment still patchy, incumbents utilize their compliance teams to hinder smaller rivals that lack region-specific legal expertise.
TV White Space Spectrum Industry Leaders
Microsoft Corp. (Airband Initiative)
Alphabet, Inc. (Project Taara)
Adaptrum, Inc.
Carlson Wireless Technologies, Inc.
6Harmonics, Inc.
- *Disclaimer: Major Players sorted in no particular order

Recent Industry Developments
- August 2025: Innonet teamed with CSIR South Africa to donate USD 120,000 worth of base stations and antennas for Western Cape pilots, aiming to seed demand that progresses into commercial orders once performance proofs conclude.
- June 2025: Microsoft expanded its Airband coverage in Kenya by adding TVWS links managed through Azure cloud databases, a move that couples connectivity with its software ecosystem and locks in downstream cloud revenue.
- April 2025: The FCC finalized new database certification rules that cut protection margins, effectively freeing more usable channels per county, which boosts the equipment addressable market without extra spectrum auctions. Vendors that already embed machine-learning predictions in firmware gain a first-mover advantage.
- February 2025: Singapore’s Infocomm Media Development Authority raised maximum EIRP limits for agricultural IoT, widening single-cell coverage areas by 40% and lowering infrastructure count for farm operators, which is expected to accelerate module purchases.


Global TV White Space Spectrum Market Report Scope
| Fixed TVWS Base Stations |
| Portable TVWS Devices |
| IoT Modules |
| Other Device Types |
| Broadband Access / Rural Connectivity |
| IoT and M2M Communications |
| Smart Agriculture |
| Smart City and Public Safety |
| Telecommunications Service Providers |
| Utilities and Energy |
| Agriculture Sector |
| Public Safety and Government |
| VHF (54 - 216 MHz) |
| UHF (470 - 698 MHz) |
| North America | United States | |
| Canada | ||
| Mexico | ||
| South America | Brazil | |
| Argentina | ||
| Rest of South America | ||
| Europe | Germany | |
| United Kingdom | ||
| France | ||
| Italy | ||
| Spain | ||
| Russia | ||
| Rest of Europe | ||
| Asia-Pacific | China | |
| Japan | ||
| India | ||
| South Korea | ||
| South-East Asia | ||
| Rest of Asia-Pacific | ||
| Middle East and Africa | Middle East | Saudi Arabia |
| United Arab Emirates | ||
| Turkey | ||
| Rest of Middle East | ||
| Africa | South Africa | |
| Nigeria | ||
| Rest of Africa | ||
| By Device Type | Fixed TVWS Base Stations | ||
| Portable TVWS Devices | |||
| IoT Modules | |||
| Other Device Types | |||
| By Application | Broadband Access / Rural Connectivity | ||
| IoT and M2M Communications | |||
| Smart Agriculture | |||
| Smart City and Public Safety | |||
| By End-user Industry | Telecommunications Service Providers | ||
| Utilities and Energy | |||
| Agriculture Sector | |||
| Public Safety and Government | |||
| By Frequency Band | VHF (54 - 216 MHz) | ||
| UHF (470 - 698 MHz) | |||
| By Geography | North America | United States | |
| Canada | |||
| Mexico | |||
| South America | Brazil | ||
| Argentina | |||
| Rest of South America | |||
| Europe | Germany | ||
| United Kingdom | |||
| France | |||
| Italy | |||
| Spain | |||
| Russia | |||
| Rest of Europe | |||
| Asia-Pacific | China | ||
| Japan | |||
| India | |||
| South Korea | |||
| South-East Asia | |||
| Rest of Asia-Pacific | |||
| Middle East and Africa | Middle East | Saudi Arabia | |
| United Arab Emirates | |||
| Turkey | |||
| Rest of Middle East | |||
| Africa | South Africa | ||
| Nigeria | |||
| Rest of Africa | |||


Key Questions Answered in the Report
What is the current valuation of the TV white space spectrum market?
The market is valued at USD 180.41 million in 2026 and is projected to hit USD 498.43 million by 2031.
Which segment leads device sales?
Fixed TVWS base stations held 45.62% share in 2025, topping the device landscape.
Which application is expanding quickest?
Smart agriculture posts the fastest growth, advancing at a 24.05% CAGR through 2031.
Why is Asia-Pacific growing so fast?
National programs in India, China, and Southeast Asia subsidize rural broadband and precision-agriculture pilots, lifting adoption at a 26.02% CAGR.
How do TVWS economics compare with licensed spectrum?
Operators save up to 70% on five-year capital outlay because TVWS incurs no spectrum-license costs and requires fewer towers.
What regulatory trend favors adoption?
Cloud-managed databases approved by bodies like the FCC automate interference control, cutting protection margins and freeing extra channel capacity.
Page last updated on:


