Advertising Based Video On Demand (AVOD) Market Size and Share
Market Overview
| Study Period | 2020 - 2031 |
|---|---|
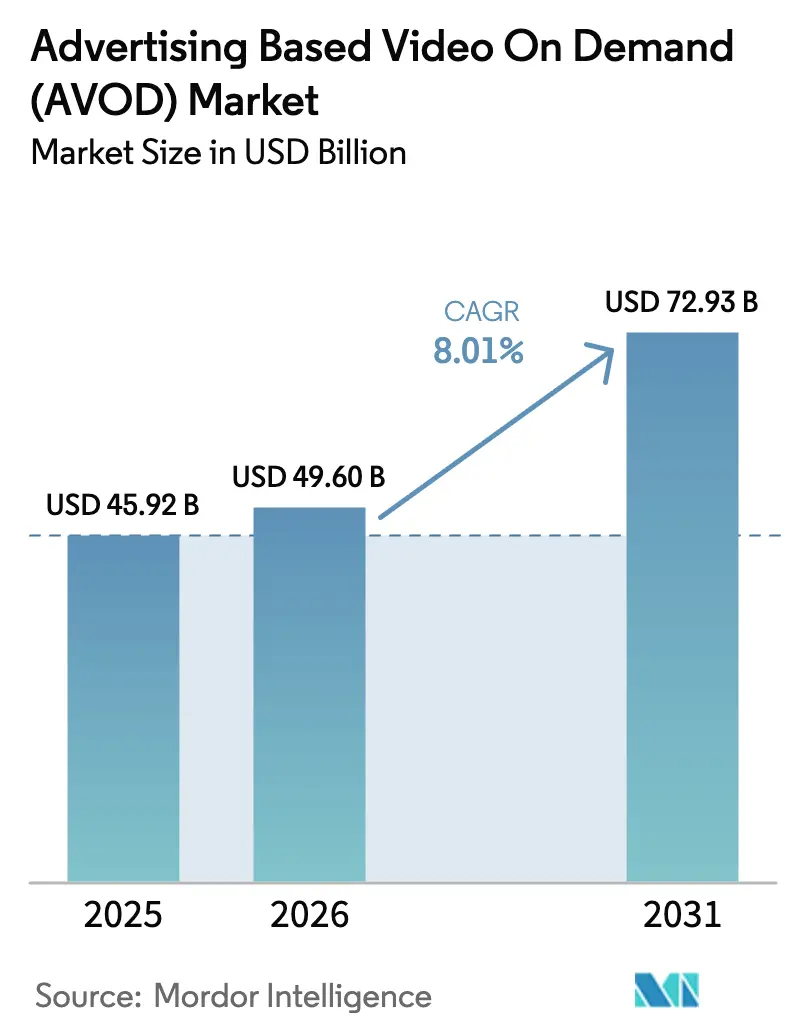
| Market Size (2026) | USD 49.6 Billion |
| Market Size (2031) | USD 72.93 Billion |
| Growth Rate (2026 - 2031) | 8.01% CAGR |
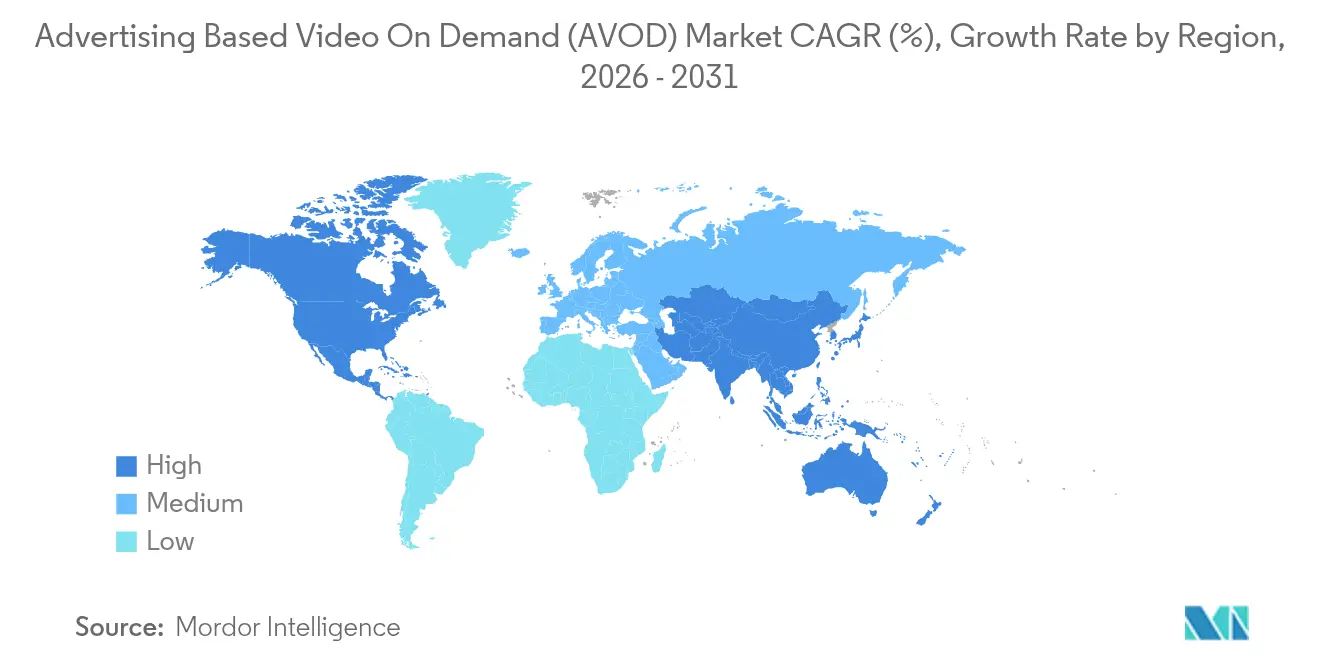
| Fastest Growing Market | Asia Pacific |
| Largest Market | North America |
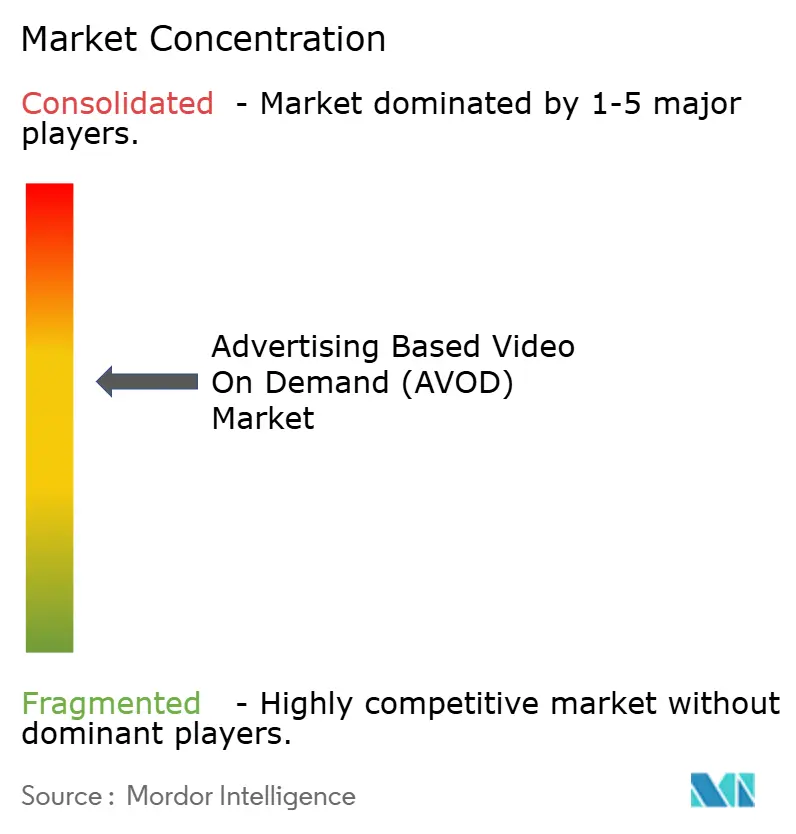
| Market Concentration | Medium |
Major Players *Disclaimer: Major Players sorted in no particular order Image © Mordor Intelligence. Reuse requires attribution under CC BY 4.0. | |
Advertising Based Video On Demand (AVOD) Market Analysis by Mordor Intelligence
The advertising-based video on demand market size is expected to grow from USD 45.92 billion in 2025 to USD 49.6 billion in 2026 and is forecast to reach USD 72.93 billion by 2031 at 8.01% CAGR over 2026-2031. Viewers are tiring of subscription stacking, advertisers are chasing authenticated reach, and telecom upgrades are pushing high-definition streams deep into rural pockets. Large platforms that once relied almost entirely on subscriptions now see higher lifetime value from users who accept ads, as demonstrated by a leading global streamer that doubled advertising revenue in 2024 and is on pace for another doubling in 2025. Connected-TV (CTV) viewing now exceeds cable and broadcast combined, ensuring that prime-time budgets follow audiences rather than schedules. In parallel, interactive and shoppable ad formats shorten the path from awareness to purchase, a draw for retailers eager to capture impulse buys inside living-room screens. North America still delivers the biggest revenue pool, while Asia-Pacific provides the steepest growth curve thanks to mobile-first behaviour and accelerating 5G and fibre roll-outs.
Key Report Takeaways
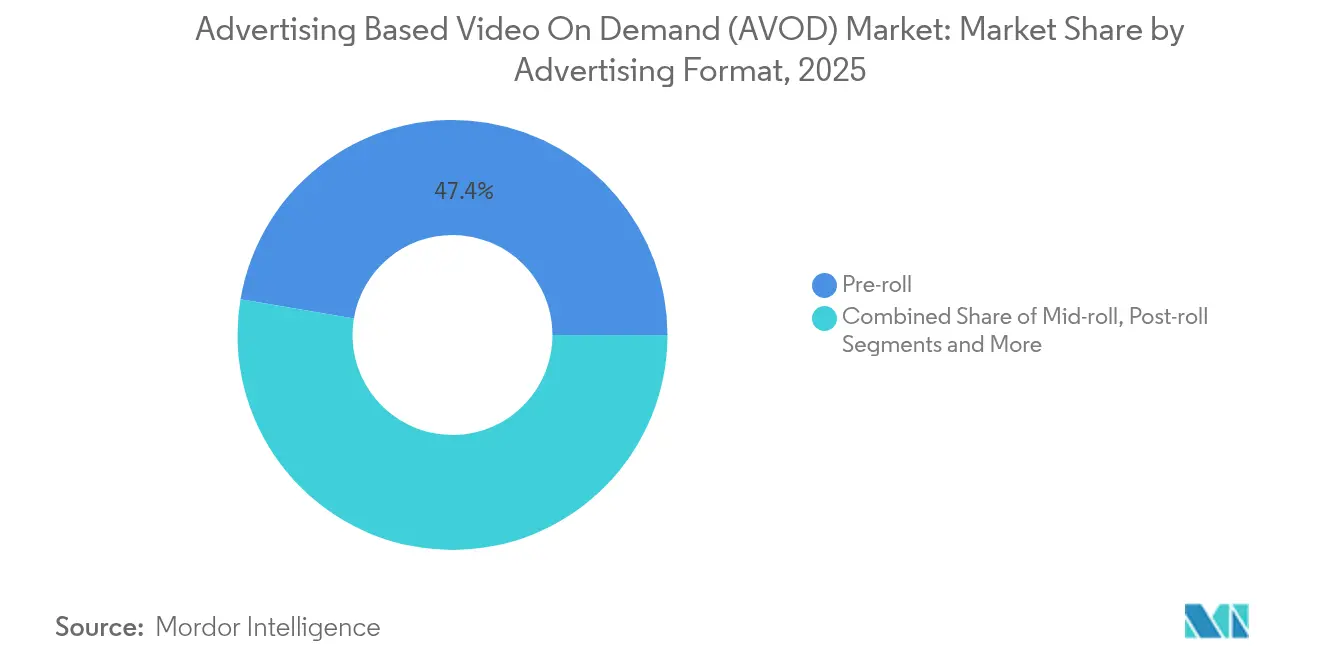
- By advertising format, pre-roll spots commanded 47.35% of revenue in 2025, while interactive and shoppable ads are forecast to grow at a 18.62% CAGR to 2031.
- By device type, connected TV captured 52.42% of the advertising-based video on demand market share in 2025 and is expanding at a 16.4% CAGR through 2031.
- By end-user industry, media and entertainment generated 41.10% of spend in 2025, while retail and e-commerce advertising is growing fastest at a 15.2% CAGR through 2031.
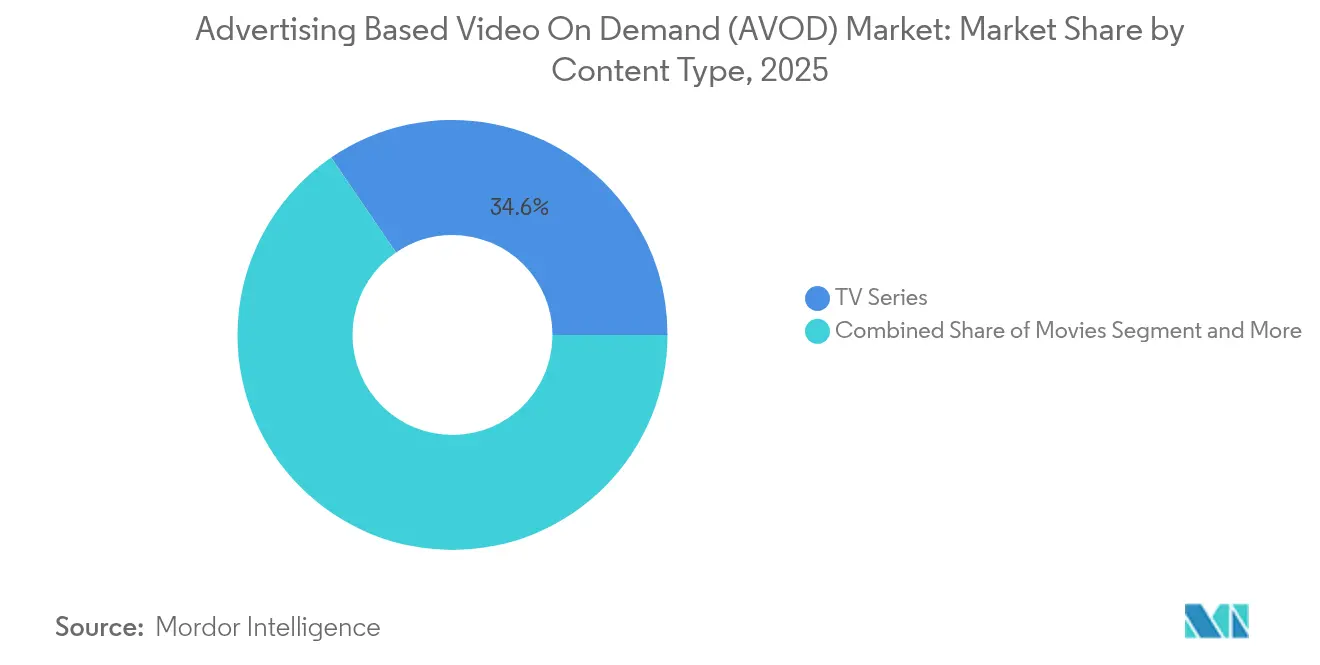
- By content type, TV series delivered a 34.55% share in 2025, whereas live sports and esports streams are pacing for an 17.9% CAGR through 2031.
- By business model, free AVOD services accounted for 45.30% of revenue in 2025, while hybrid subscription-plus-ads tiers are set to expand at a 20.15% CAGR through 2031.
- By geography, North America held 41.60% of 2025 revenue, whereas Asia-Pacific is projected to climb at a 14.4% CAGR through 2031.
Note: Market size and forecast figures in this report are generated using Mordor Intelligence’s proprietary estimation framework, updated with the latest available data and insights as of 2026.
Global Advertising Based Video On Demand (AVOD) Market Trends and Insights
Drivers Impact Analysis*
| Driver | (~) % Impact on CAGR Forecast | Geographic Relevance | Impact Timeline |
|---|---|---|---|
| Accelerating shift of CTV ad budgets from linear TV | +2.1% | North America, Asia-Pacific | Medium term (2-4 years) |
| 5G and fibre deployment broadening mobile video reach | +1.8% | Asia-Pacific core, spill-over to EMEA | Long term (≥ 4 years) |
| Advertisers’ requirement for incremental reach and first-party data | +1.5% | Developed markets worldwide | Short term (≤ 2 years) |
| Brand-safety advances unlocking FMCG ad budgets | +0.9% | North America, European Union | Medium term (2-4 years) |
| Retail-media networks powering shoppable video commerce | +1.4% | Predominantly North America | Short term (≤ 2 years) |
| Streaming-exclusive live sports rights elevating premium inventory | +1.0% | Global premium markets | Long term (≥ 4 years) |
| Source: Mordor Intelligence | |||
Accelerating CTV Budget Shift
Brands now see household-level targeting, automated buying, and clear measurement as reasons to reallocate large blocks of linear-TV spend toward the advertising-based video on demand market. A major independent ad-tech provider’s 2024 launch of an operating system built specifically for CTV simplified access to fragmented inventory and reduced make-goods, encouraging even conservative advertisers to test streaming screens. Because CTV now commands the plurality of total TV viewing minutes, media buyers who remain in linear risk missing reach targets, and that fear of missing audiences keeps the CTV flywheel turning.
5G and Fibre Fuel Mobile Reach
Standalone 5G roll-outs paired with fibre backhaul enable 4K streams on smartphones and affordable fixed-wireless bundles in rural zones, putting the advertising-based video on demand market in front of previously unreachable households. U.S. fixed-wireless access collected nearly nine-tenths of net broadband additions in 2024, underscoring how last-mile constraints are easing. In dense Asian markets, low-latency connections let shoppable overlays load instantly, elevating CPMs and time-spent metrics for publishers that embrace interactivity.
Advertisers Need Incremental Reach and Data
The crumble of third-party cookies shifts budgets toward partners that own deterministic first-party data. Streaming services can tie exposure to registrations, in-platform behavior, and merchant checkouts, giving brands clear lift curves that the walled-garden social networks once monopolized. Retailers syndicate their commerce data into video ad platforms, and when advertisers see closed-loop conversion reports they double down, reinforcing the flywheel that propels the advertising-based video on demand market.
Brand-Safety Tools Open FMCG Wallets
AI-based content-scanning and deepfake detection reassure cautious consumer-goods advertisers that their spots will not run beside misinformation. The introduction of silicon-level watermarks and real-time video authentication in early 2025 allowed global beauty and beverage brands to pull dollars out of long-tail social feeds and redirect them to premium AVOD streams where compliance thresholds are higher. Safer adjacency translates into materially larger spend commitments, adding another tailwind to overall growth.
Restraint Impact Analysis*
| Restraint | (~) % Impact on CAGR Forecast | Geographic Relevance | Impact Timeline |
|---|---|---|---|
| Subscription tiers cannibalising ad inventory | –1.2% | Global, strongest in mature markets | Short term (≤ 2 years) |
| Ad-load fatigue driving churn | –0.8% | Global, premium demographics | Medium term (2-4 years) |
| Browser-level ad-blocking on smart-TV OSs | –0.6% | Developed markets | Long term (≥ 4 years) |
| AI-generated deep-fake ads eroding viewer trust | –0.4% | Global, varies by regulation | Medium term (2-4 years) |
| Source: Mordor Intelligence | |||
Subscription Tiers Cannibalizing Ad Inventory
When a global streamer introduced an ad-free premium bundle, some users upgraded and thereby reduced available impressions. While ARPU improved, small publishers felt the competitive squeeze as ad pricing tightened. Maintaining healthy tier ratios becomes critical; otherwise, total market inventory shrinks and dampens growth potential.
Ad-Load Fatigue Driving Churn
Binge viewers report switching services after two consecutive heavy ad pods. Attention-tracking studies find that recall deteriorates sharply beyond three minutes of ads per half-hour, so publishers face a delicate balance: push frequency high enough to boost revenue but low enough to safeguard retention. Failure to find the sweet spot can erode the advertising-based video on demand market size as churn outpaces acquisition.
*Our forecasts treat driver/restraint impacts as directional, not additive. The impact forecasts reflect baseline growth, mix effects, and variable interactions.
Segment Analysis
By Advertising Format: Interactive Commerce Outpaces Traditional Placements
Interactive units turn passive viewing into active shopping, and this engagement shift is reflected in both wallet share and projected growth. The format delivers the fastest 18.62% CAGR through 2031, even though pre-roll still owns a 47.35% slice of the advertising-based video on demand market share in 2025. Pre-roll’s dominance comes from buyer familiarity and the ease of transposing linear TV creative into streaming, yet growth lags as advertisers pivot toward formats that drive attributable sales events. Mid-roll and post-roll maintain utility in longer narratives, but their trajectory remains moderate because audience drop-off never fully recovers after the first break.
Retailers see interactive overlays as a new end-cap, and measured lift figures—such as a 378% jump in engagement during a premium broadcaster’s 2024 holiday run—validate higher CPMs. Commerce APIs embedded in large OTT apps position the advertising-based video on demand market size for the format to keep expanding as frictionless checkout becomes a standard feature. Publishers that master server-side ad insertion alongside real-time shoppable modules stand to capture disproportionate revenue growth, especially as trade-marketing dollars migrate into video.


By Device Type: Connected TV Consolidates Viewing Minutes
CTV screens held 52.42% of total consumption in 2025 and look set to compound at a 16.4% CAGR through 2031, cementing the device class as the primary canvas for premium campaigns. The mobile smartphone cohort remains large but increasingly focuses on short-form, on-the-go clips; its growth moderates because evening living-room time shifts back to the big screen. Tablet and laptop consumption continues but hovers near a plateau, while gaming consoles provide under-appreciated scale for younger male segments.
The advertising-based video on demand market size attached to CTV inventory also benefits from double-digit CPM premiums thanks to co-viewing and household-level data. Smart-TV operating systems integrate automatic content recognition, letting brands frequency-cap across apps and linear channels. As a result, the advertising-based video on demand market enjoys efficient spend consolidation around the living-room device, reinforcing its central role in campaign planning.
By End-User Industry: Retail and E-Commerce Claim the Fast Lane
Media and entertainment still accounts for 41.10% of 2025 revenue, yet its CAGR slows as saturation sets in among established studios and streamers. In contrast, retail and e-commerce budgets expand at a 15.2% pace through 2031, making merchants the fastest-advancing vertical inside the advertising-based video on demand market. These brands treat AVOD screens as an extension of the digital shelf, pairing first-party checkout data with addressable targeting to achieve closed-loop attribution.
Banking, financial services, and insurance advertisers migrate steadily into CTV as regulations evolve to allow personalised finance offers on large screens. Meanwhile, education and travel marketers ramp spend because high-definition video showcases complex products—like university campus life or resort experiences—more effectively than static banners. The advertising-based video on demand industry thus gains diversity, softening reliance on entertainment and broadening its revenue pillars.
By Content Type: Sports Streaming Commands Premium Rates
TV series capture 34.55% of total ad receipts in 2025 due to their episodic nature and sticky weekly cadence, yet sports and esports live streams grow faster at an 17.9% CAGR by 2031. Rights deals worth tens of billions have migrated to exclusive streaming windows, drawing advertisers that need real-time reach. Because sports are consumed live, ad-skipping is virtually nil, and CPMs spike during marquee events.
Movies settle into a steady lane of moderate growth, serving catalogue demand, while documentaries and news cater to niche loyalty segments. Nevertheless, the advertising-based video on demand market recognises that sports deliver an engagement premium unmatched by scripted genres. As leagues seek younger global audiences, digital-first distribution will only deepen advertiser reliance on live sports inventory.
By Business Model: Hybrid Approaches Turbo-Charge Monetization
Purely free services retain 45.30% of 2025 revenue, but hybrid subscription-plus-ads models are forecast to surge at 20.15% CAGR through 2031. Platforms achieve margin lift when they mix recurring fees with ad dollars, allowing price-sensitive households to stay in the ecosystem while advertisers gain additional impressions. A top-tier streamer reported that more than half of new sign-ups in launch markets now select the ad tier, validating the model’s mass-market reach.
FAST linear channels provide lean-back convenience and incremental viewing hours, broadening the advertising-based video on demand market. Early-mover advantage accrues to services that own both blockbuster originals and a channeliser technology stack able to insert addressable spots into a playout feed. The advertising-based video on demand market share of hybrid players will therefore expand as content owners replicate this economic blueprint across geographies.
Geography Analysis
North America anchors 41.60% of global spend in 2025, but its growth moderates as subscription households approach ceiling levels and platform focus tilts toward yield optimisation. Rich programmatic pipes, credit-card penetration, and stable regulation keep the region a testing ground for new ad formats. Exclusive streaming deals for major football and basketball leagues concentrate premium budgets on big events, protecting CPMs even during economic slowdowns.
Asia-Pacific is the growth engine, advancing at a 14.4% CAGR on the back of widespread smartphone adoption and affordable data plans. India’s local-language content boom and digitally savvy youth cohort propel view-time metrics that advertisers prize, while China’s sheer scale in both viewers and production drives supply. Mature markets like Japan and South Korea see quick uptake of HDR streams, further elevating the value of the advertising-based video on demand market across the region.
Europe exhibits balanced expansion as ad-supported layers become fixtures on subscription services amid inflation-led belt-tightening. Data-privacy directives add compliance overhead, but granular consent frameworks also strengthen the legitimacy of premium inventory. Cross-border content licensing challenges remain post-Brexit, yet EU production quotas spur local storytelling, giving advertisers culturally resonant options inside the advertising-based video on demand market.

Competitive Landscape
The market is moderately fragmented; scale leaders own cloud infrastructure, multi-billion-dollar content budgets, and proprietary data graphs, while niche challengers carve out genre or regional edges. Global video platforms leverage vertically integrated stacks—cloud transcode, identity graphs, and commerce rails—to deepen moats. Device manufacturers enter with FAST services, enriching ecosystems and capturing first-screen ad slots. Independent ad-tech firms position themselves as neutral routers of demand and supply, offering unified campaign control dashboards that medium-sized publishers cannot build alone.
Recent years show a pattern of vertical integration and commerce convergence. A major connected-TV OS provider launched a total-reach solution that increased incremental reach by nearly half for an automaker’s campaign, underlining hardware makers’ leverage.
Meanwhile, free ad-supported pioneers eclipse 90 million monthly active users by focusing on frictionless discovery and deep movie catalogues. The top five platforms still control a high two-thirds slice of spend, but long-tail entrants backed by local studios and newsrooms inject fresh competitive energy into the advertising-based video on demand market.
Advertising Based Video On Demand (AVOD) Industry Leaders
Roku, Inc.
YouTube, LLC
Hulu, LLC
Pluto TV (Paramount)
Amazon Freevee
- *Disclaimer: Major Players sorted in no particular order

Recent Industry Developments
- June 2025: Fremantle and Merzigo renewed their AVOD partnership, expanding global content distribution and sharpening ad-tech integration.
- May 2025: Roku reported Q1 2025 revenue up 15.8% year over year, though EBITDA growth tapered to 36.9%, highlighting monetisation pressure as the advertising-based video on demand market matures.
- May 2025: Tubi used IAB NewFronts to unveil performance-focused ad products and sector-tailored packages aimed at driving incremental reach for marketers.
- April 2025: Samsung Ads introduced Optimal Reach, a suite leveraging opt-in automatic content recognition data to extend campaigns beyond linear and AVOD, achieving a 47% incremental reach lift for a luxury automaker.


Research Methodology Framework and Report Scope
Market Definitions and Key Coverage
Our study defines the advertising-based video on demand (AVOD) market as all revenues earned from digital video streams that are made freely available to viewers in exchange for pre-roll, mid-roll, post-roll, or interactive advertisements across connected TVs, mobile devices, PCs, and gaming consoles. Advertising sold against live linear FAST channels is included because the viewer experience and monetization logic mirror on-demand inserts.
Scope exclusion: Subscription-only and pay-per-view models that do not expose an ad break are outside this scope.
Segmentation Overview
- By Advertising Format
- Pre-roll
- Mid-roll
- Post-roll
- Interactive / Shoppable
- By Device Type
- Connected TV (Smart-TV and dongles)
- Mobile (Smartphone)
- Tablet / Laptop
- Gaming Console
- By End-user Industry
- Media and Entertainment
- Retail and Ecommerce
- BFSI
- Education
- Travel and Hospitality
- By Content Type
- Movies
- TV Series
- Sports and Esports Live Streams
- News and Documentaries
- By Business Model
- Pure-play Free AVOD
- Hybrid (Subscription + Ads)
- FAST Linear Channels
- By Geography
- North America
- United States
- Canada
- Mexico
- South America
- Brazil
- Argentina
- Rest of South America
- Europe
- United Kingdom
- Germany
- France
- Italy
- Spain
- Nordics
- Rest of Europe
- Asia-Pacific
- China
- India
- Japan
- South Korea
- ASEAN
- Australia
- New Zealand
- Rest of Asia-Pacific
- Middle East and Africa
- Middle East
- Saudi Arabia
- United Arab Emirates
- Turkey
- Rest of Middle East
- Africa
- South Africa
- Egypt
- Nigeria
- Rest of Africa
- Middle East
- North America
Detailed Research Methodology and Data Validation
Desk Research
We first gathered foundational supply-side metrics from publicly accessible regulators and trade groups such as the Federal Communications Commission, the Interactive Advertising Bureau, Eurostat, and Ofcom, which publish granular data on streaming households, connected-TV penetration, and digital ad CPM ranges. Viewer time-spent statistics were pulled from national audience measurement panels, while macro indicators like household broadband adoption came from the World Bank and ITU. To profile industry economics, we reviewed 10-K filings, investor decks, and earnings calls of leading streamers alongside advertising spend tallies from the top media agency barometers. Select paid databases, notably D&B Hoovers for company financials and Dow Jones Factiva for deal flow, helped us validate revenue splits. The sources cited above are illustrative rather than exhaustive; many additional references informed the desk stage.
Primary Research
Mordor analysts interviewed ad-tech vendors, streaming platforms, agency buyers, and brand marketers across North America, Europe, and Asia-Pacific to stress-test inventory growth rates, average ad loads, and evolving cost-per-thousand benchmarks. They then ran short surveys with viewers to gauge tolerance for ad frequency and discover emerging devices.
Market-Sizing & Forecasting
A top-down model starts with country-level digital video ad spend, rebuilt into an AVOD pool by mapping share-of-voice data and connected-TV impression splits. Supplier roll-ups of major platform revenues and channel checks on average ad loads provide selective bottom-up cross-verification, after which totals are reconciled. Key variables include connected-TV household base, smartphone video watch minutes, average programmatic CPM, ad-load per hour norms, and live-sports streaming rights migration. Multivariate regression with lagged broadband penetration and CPM forecasts projects each driver through 2030; scenario overlays capture privacy regulation shifts and macro ad-spend cycles. Gaps where platform disclosures are thin are bridged by peer benchmarks weighted by traffic estimates.
Data Validation & Update Cycle
Outputs pass a three-layer review: automated variance screens, peer comparison, and senior analyst sign-off. Reports are refreshed annually, with interim adjustments whenever a material event, such as a platform introducing an ad tier, shifts the baseline.
Why Mordor's Advertising Based Video on Demand (AVoD) Baseline Commands Reliability
Published estimates often diverge because firms choose dissimilar definitions, miss newer device classes, or apply uniform ad-load factors to all regions.
Key gap drivers include: some publishers fold hybrid SVOD with ads revenue into AVOD, others extrapolate global totals from limited U.S. samples, and several assume double-digit CPM inflation without validating with buyers. Mordor's scope, consistent refresh cadence, and dual-path modelling limit these distortions.
Benchmark comparison
| Market Size | Anonymized source | Primary gap driver |
|---|---|---|
| USD 45.92 B (2025) | Mordor Intelligence | - |
| USD 49.04 B (2024) | Global Consultancy A | Hybrid SVOD ad tiers blended into core AVOD; single-region CPM uplift applied globally |
| USD 40.80 B (2023) | Industry Association B | Excludes live FAST channels and connected-console viewing; uses static ad-load of four minutes per hour |
| USD 38.21 B (2023) | Regional Consultancy C | Projects spend from legacy desktop video data, undercounting CTV households |
These comparisons show that while headline numbers vary, Mordor's disciplined boundary setting, variable selection, and yearly validation deliver a balanced and transparent baseline that decision-makers can trace back to real-world signals and replicate with confidence.


Key Questions Answered in the Report
How large is the advertising-based video on demand market in 2026?
The market is valued at USD 49.6 billion in 2026.
What annual growth rate is expected through 2031?
The market is projected to expand at an 8.01% CAGR, reaching USD 72.93 billion.
Which ad format is growing fastest?
Interactive and shoppable units lead with a 18.62% CAGR forecast, outpacing traditional pre-roll spots.
Which device class dominates viewing?
Connected-TV screens account for 52.42% of consumption and continue to expand at a 16.4% CAGR.
Which region delivers the highest growth rate?
Asia-Pacific advances at a 14.4% CAGR, led by India’s mobile-first audiences and widening 5G coverage.
What is the main competitive advantage for large platforms?
Scale in content acquisition, data, and ad-tech integration allows major players to offer unified, measurable reach that smaller competitors struggle to match.
Page last updated on:


