
Media Streaming Market Size and Share
Market Overview
| Study Period | 2020 - 2031 |
|---|---|
| Market Size (2026) | USD 151.17 Billion |
| Market Size (2031) | USD 215.61 Billion |
| Growth Rate (2026 - 2031) | 7.36 % |
| Fastest Growing Market | Asia Pacific |
| Largest Market | North America |
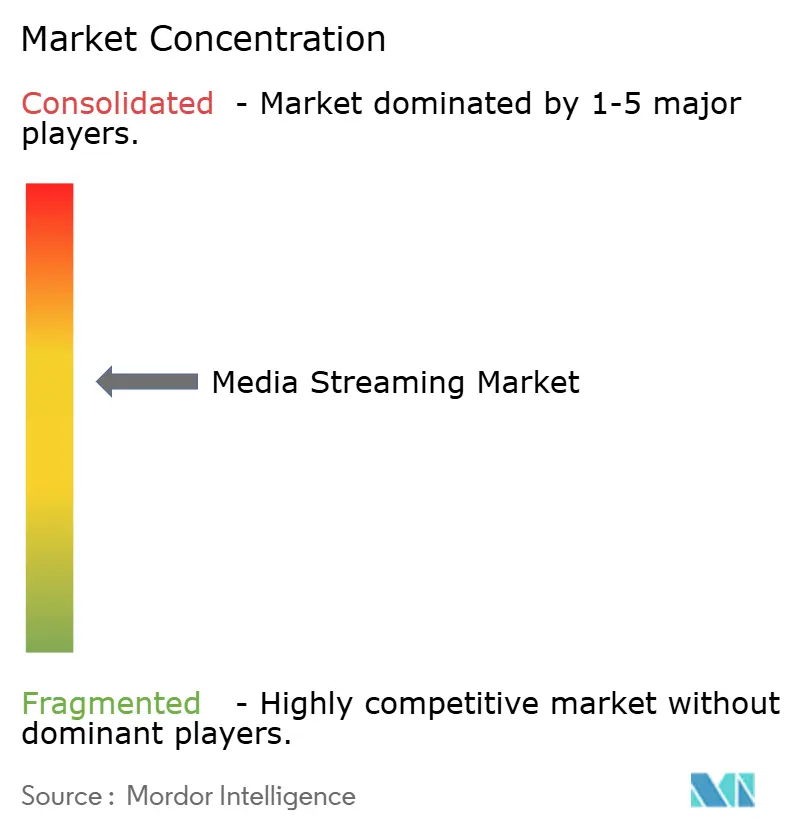
| Market Concentration | Medium |
Major Players *Disclaimer: Major Players sorted in no particular order Image © Mordor Intelligence. Reuse requires attribution under CC BY 4.0. | |
Media Streaming Market Analysis by Mordor Intelligence
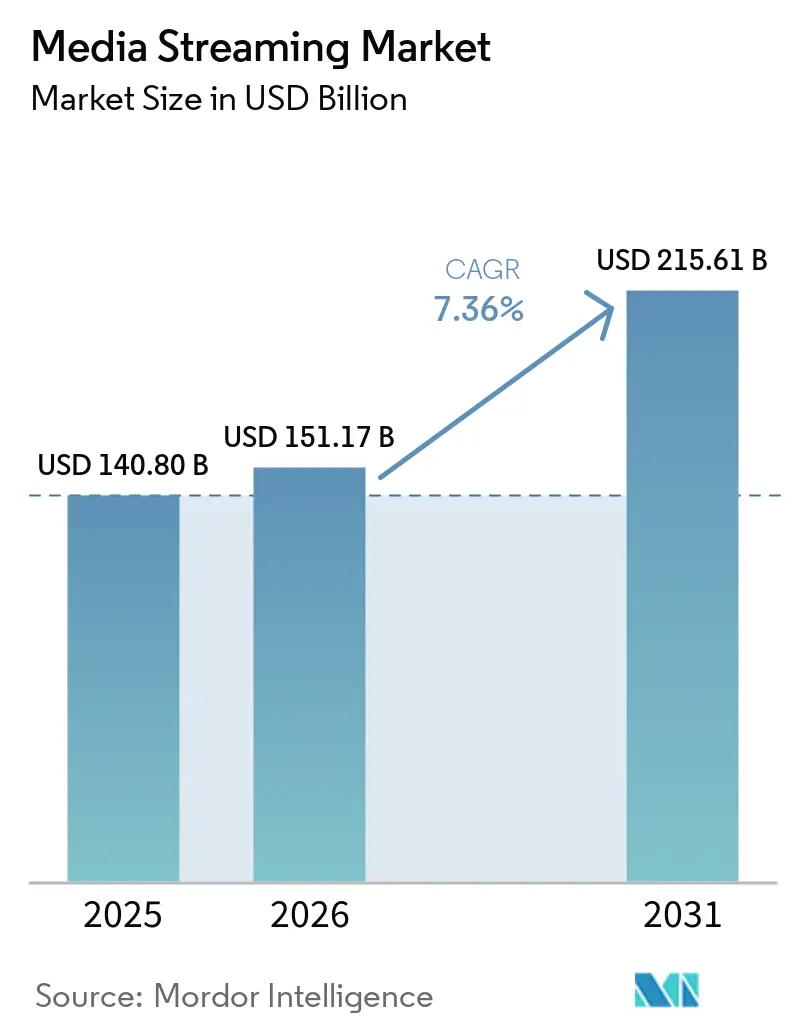
The media streaming market size was valued at USD 140.80 billion in 2025 and estimated to grow from USD 151.17 billion in 2026 to reach USD 215.61 billion by 2031, at a CAGR of 7.36% during the forecast period (2026-2031). This strong outlook rests on a decisive pivot from subscription-only propositions toward hybrid monetization that combines paid tiers with advertising inventory, enabling platforms to offset rising customer-acquisition costs and improve profitability. Competitive differentiation increasingly stems from control of advertising technology stacks, real-time recommendation engines, and exclusive content rights that secure premium pricing. Network upgrades—in particular 5G rollouts—support higher-bitrate delivery, while edge compute adoption cuts latency, allowing 4K and 8K streams to reach mobile users without buffering. Sports rights fragmentation drives event-led subscriber spikes and higher CPMs, whereas localized content libraries draw new viewers in under-penetrated rural markets. At the same time, margin pressure from USD 18 billion annual content budgets forces operators to balance original production with catalog sharing pacts, accelerating a sector-wide shift toward revenue-per-user optimization.
Key Report Takeaways
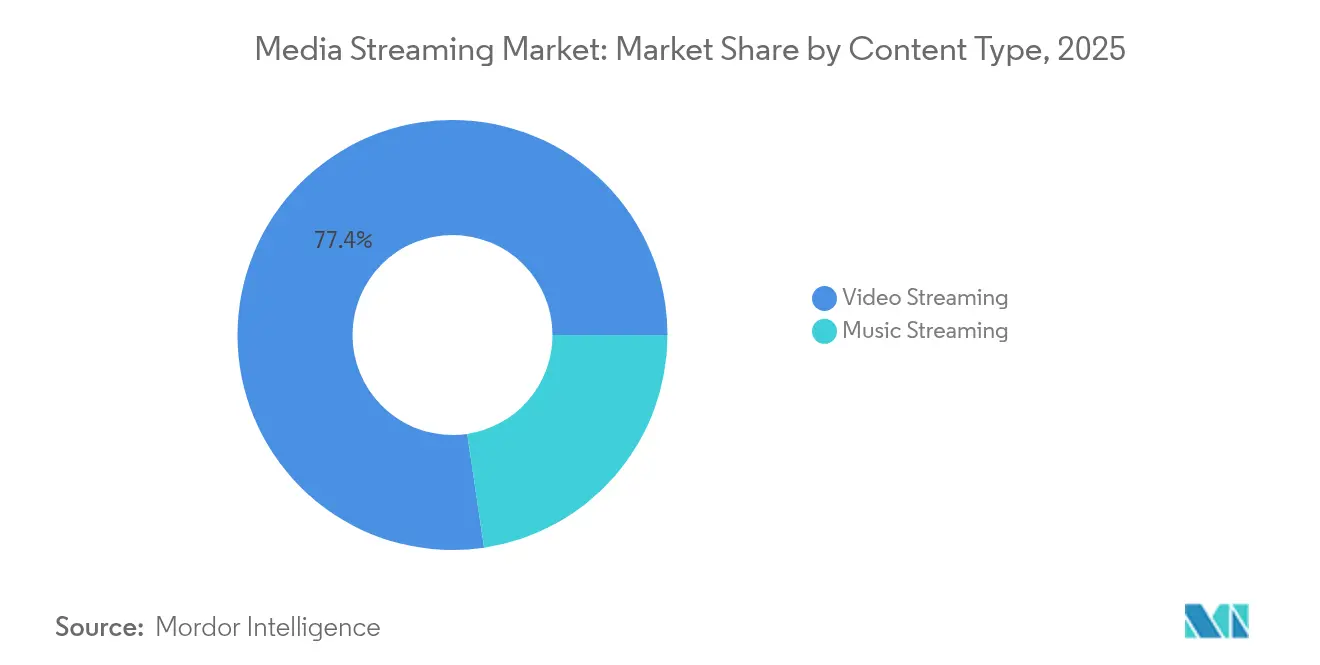
- By content type, video streaming led with 77.35% revenue share in 2025; music streaming is projected to expand at an 8.39% CAGR to 2031.
- By service type, on-demand viewing accounted for 86.76% of the media streaming market share in 2025, while live streaming is advancing at a 9.44% CAGR through 2031.
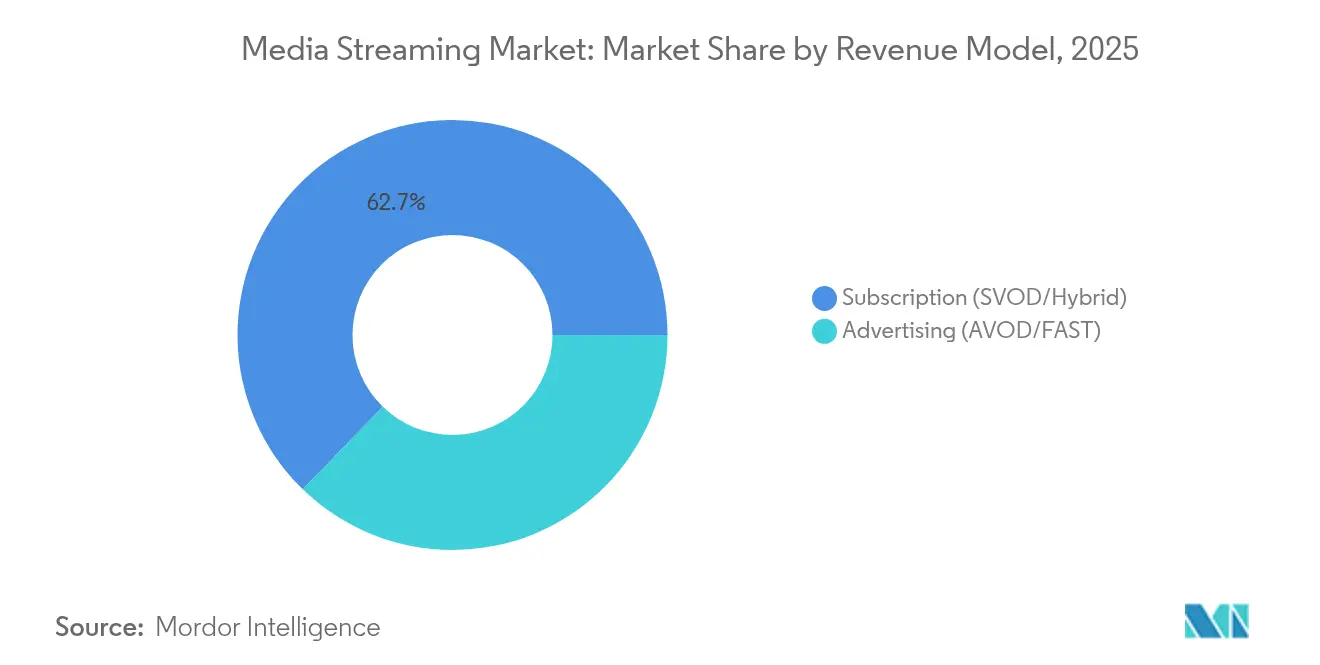
- By revenue model, subscription plans commanded 62.74% share of the media streaming market size in 2025; advertising-supported tiers are forecast to post an 8.37% CAGR to 2031.
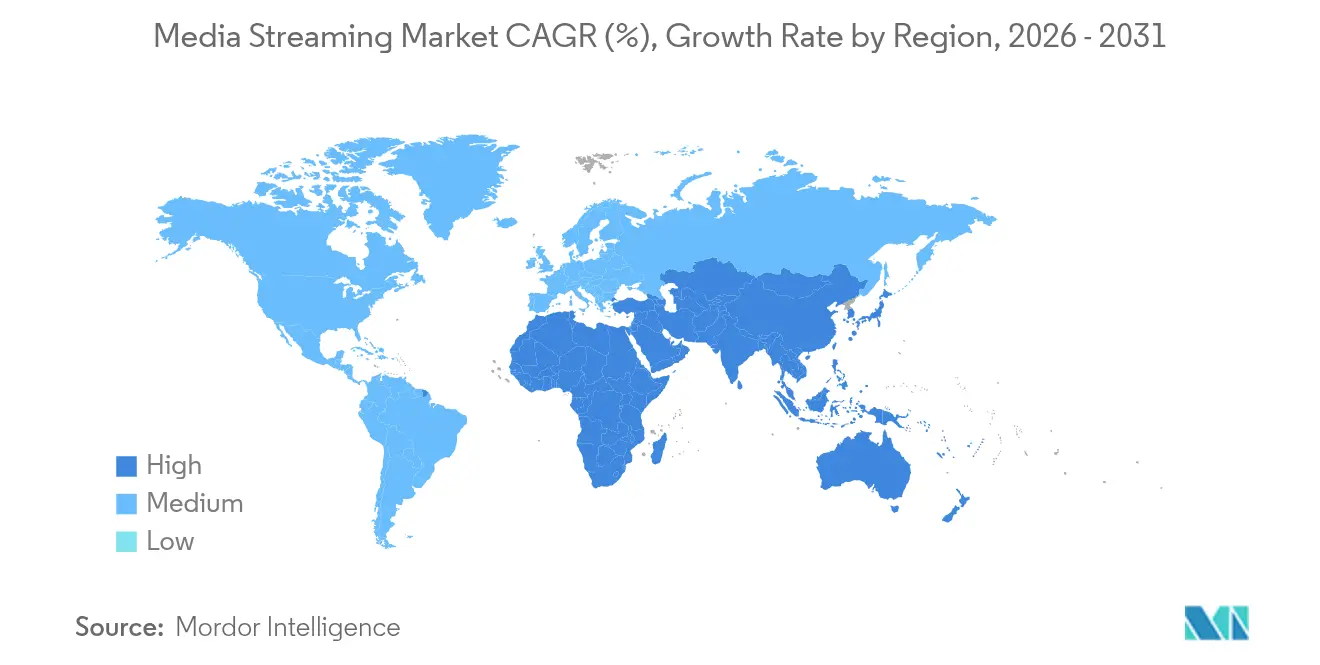
- By geography, North America contributed 34.48% of revenue in 2025, whereas Asia-Pacific is set to grow fastest at a 8.97% CAGR to 2031.
- By streaming quality, HD retained 55.05% share of the media streaming market size in 2025; 8K viewing is accelerating at an 17.7% CAGR through 2031.
Note: Market size and forecast figures in this report are generated using Mordor Intelligence’s proprietary estimation framework, updated with the latest available data and insights as of 2026.
Market Trends and Insights
Drivers Impact Analysis of Media Streaming Market*
| Driver | (~) % Impact on CAGR Forecast | Geographic Relevance | Impact Timeline |
|---|---|---|---|
| Proliferation of low-cost 5G data plans | +1.2% | Asia-Pacific core, spill-over to MEA | Medium term (2-4 years) |
| SVOD expansion into tier-II/III cities | +0.8% | North America and EU | Short term (≤ 2 years) |
| Exclusive sports-rights wars | +1.5% | Global | Long term (≥ 4 years) |
| Cloud-native CDN and edge compute adoption | +0.9% | Global | Medium term (2-4 years) |
| Rise of FAST channels | +1.1% | North America core, expanding to APAC | Short term (≤ 2 years) |
| Telco-media bundling | +0.7% | Global | Medium term (2-4 years) |
| Source: Mordor Intelligence | |||
Proliferation of Low-Cost 5G Data Plans Across Asia-Pacific
Deployment of affordable 5G networks has reshaped consumption patterns by supporting uninterrupted HD and 4K streams on mobile connections. Operators subsidize data packages because elevated video traffic monetizes premium network investments, creating a feedback loop that spurs both infrastructure build-out and content engagement. Edge nodes positioned close to viewers further trim latency, enabling personalized recommendations to refresh in real time. The result is sustained growth for the media streaming market in price-sensitive emerging economies.
SVOD Platform Expansion into Tier-II/III Cities in North America and Europe
Having saturated major metropolitan areas, leading services are targeting secondary cities where fiber rollout and improved rural broadband have lowered delivery cost. Localized production budgets are modest relative to global tent-pole titles, yet culturally tailored series drive higher loyalty among underserved audiences. Sophisticated recommendation algorithms that account for regional dialects and viewing times maintain engagement without raising content outlays, adding incremental revenue to the media streaming market.
Exclusive Sports-Rights Wars Driving Premium Pricing
Exclusive control of marquee tournaments underpins premium subscription tiers and attracts lucrative advertising slots. Netflix’s acquisition of FIFA Women’s World Cup rights demonstrates how event programming can offset seasonal churn and elevate average revenue per user. Live sports command higher CPMs than library titles, allowing platforms to recoup rights fees via both ads and higher priced plans. As traditional broadcasters lose exclusivity, streaming operators wield greater negotiation leverage with advertisers and leagues.
Integration of Cloud-Native CDN and Edge Compute for Ultra-Low-Latency Live Streams
Operators such as Comcast deploy edge compute clusters that halve latency versus legacy CDNs, ensuring synchronized playback during high-traffic events. Cloud-native architectures scale automatically, containing bandwidth spend while preserving quality. Enhanced reliability differentiates service offerings and sustains growth across the media streaming market.
Restraints Impact Analysis of Media Streaming Market*
| Restraint | (~) % Impact on CAGR Forecast | Geographic Relevance | Impact Timeline |
|---|---|---|---|
| Escalating content-licensing costs | -1.8% | Global | Short term (≤ 2 years) |
| Fragmented rights management | -0.9% | Global | Medium term (2-4 years) |
| Persistent last-mile latency in emerging markets | -1.2% | APAC, MEA, Latin America | Long term (≥ 4 years) |
| Heightened regulatory scrutiny on data privacy and localization | -0.7% | EU, APAC core | Medium term (2-4 years) |
| Source: Mordor Intelligence | |||
Escalating Content-Licensing Costs Compressing Margins
Netflix’s USD 18 billion outlay in 2025 underscores an inflationary spiral that squeezes profitability even for scale leaders. Fierce bidding for premium libraries diminishes differentiation because rival services can only pass a portion of costs to subscribers. Sharing agreements reduce immediate cash burn but blunt exclusivity advantages that underpin subscriber acquisition, challenging overall economics of the media streaming market.
Heightened Regulatory Scrutiny on Data Privacy and Localization
Jurisdictions imposing data-storage mandates compel platforms to duplicate infrastructure and restrict global recommender systems, inflating compliance budgets. Fragmented data silos degrade personalization accuracy, potentially lowering engagement metrics. Smaller entrants face disproportionate burdens, curbing competitive diversity within the media streaming market.
*Our forecasts treat driver/restraint impacts as directional, not additive. The impact forecasts reflect baseline growth, mix effects, and variable interactions.
Media Streaming Market Segment Analysis
By Content Type:
Video Dominance Faces Music Streaming DisruptionVideo maintained a commanding 77.35% revenue slice in 2025, reflecting entrenched viewing habits and heavy investment in exclusive series that anchor user retention. Music services, however, are expanding at an 8.39% CAGR, aided by compact file sizes that stream reliably on constrained networks. The media streaming market size for audio is swelling as AI-driven playlists raise daily listening frequency and enlarge ad inventory.
Lower production costs and borderless appeal allow music platforms to monetize global audiences rapidly, while video players shoulder rising budgets for long-form content. This cost asymmetry encourages cross-format bundling, signaling a future where audio and video propositions converge within a single app to protect market share.



By Service Type:
Live Streaming Monetization AcceleratesOn-demand libraries accounted for 86.76% of 2025 revenue, yet live streaming’s 9.44% CAGR illustrates growing appetite for real-time experiences. Sporting fixtures and tent-pole reality shows create appointment viewing that advertisers value, lifting revenue per stream above on-demand averages.
Technical complexity strengthens competitive moats: edge compute and custom protocols manage traffic spikes, ensuring latency below the two-second psychological threshold. Platforms mastering these capabilities are positioned to capture incremental media streaming market share during peak global events.
By Revenue Model:
Advertising Growth Reshapes EconomicsSubscription plans retained 62.74% share in 2025 as consumers continued to favour ad-free environments, yet ad-supported tiers are rising at an 8.37% CAGR, supported by Netflix’s report that more than 55% of new sign-ups now choose the lower-priced, ad-bearing tier. FAST channels add scale by recycling existing libraries into linear-style feeds, fueling a 42% two-year jump in global channel.
Advanced targeting delivers higher CPMs, allowing platforms to subsidize content costs. Sustained advertiser migration from linear television strengthens the media streaming market’s grip on brand budgets, but success depends on balancing ad load against viewer tolerance.
By Streaming Quality:
8K Adoption Accelerates Infrastructure InvestmentHD streams held 55.05% of 2025 usage thanks to favorable bandwidth-to-quality compromise. Nonetheless, 8K content is forecast to rise at an 17.7% CAGR on the back of codec breakthroughs that cut bitrates by 40% . Intel’s 8K Olympic broadcast proved technical viability, catalyzing device makers to integrate compatible chipsets.
Edge compute nodes cache ultra-high-definition assets nearer to viewers, easing backbone congestion. Platforms delivering seamless 8K experiences during marquee sports will command price premiums, bolstering long-term growth for the media streaming market.
Geography Analysis
North America Media Streaming Market
North America generated 34.48% of 2025 revenue but is maturing, prompting operators to pivot from user acquisition toward higher lifetime value. Bundling with fiber and mobile contracts, as demonstrated by Verizon’s convergence strategy, locks in households and widens ARPU without heavy marketing spend. Sports-rights competition inflates programming costs, yet the presence of established ad markets sustains hybrid-tier profitability.
APAC, Europe, LATAM and Africa Media Streaming Market
Asia-Pacific is projected to expand at a 8.97% CAGR, buoyed by governmental encouragement of local content creation and accelerating 5G coverage. Netflix recorded a 20% regional viewing surge after debuting culturally tailored originals, confirming that local narratives unlock outsized engagement. Governments are offering creator funds—India’s USD 1 billion initiative is emblematic—that feed fresh catalogs and stimulate the media streaming market. Nonetheless, diverse data-localization rules compel parallel infrastructure builds, raising entry barriers for smaller brands. Europe shows uneven growth as GDPR compliance and fragmented language markets inflate operational overheads. Carriage agreements such as Netflix’s tie-up with TF1 illustrate a hybrid model where streaming and traditional broadcasters collaborate to satisfy regulators and audiences. Latin America’s fiber penetration—77.2% in Brazil and 70.9% in Chile—has started translating into higher-resolution streaming uptake, creating fresh addressable revenue. Africa remains mobile-first; low-bandwidth optimizations and downloadable content options are crucial to unlock latent demand.

Regulatory Landscape
Regulation is tightening around large online video and streaming services as governments extend broadcast-style oversight and platform-safety obligations to OTT and video-on-demand. In the United Kingdom, The On-demand Programme Services (Tier 1 Services) Regulations 2026 (SI 2026/235) came into force on 1 April 2026, introducing a user-threshold framework (over 500,000 UK users) that places designated Tier 1 VOD services under enhanced Ofcom regulation. Ofcom is also progressing implementation work linked to the Media Act 2024, including consultations during 2026 on a Tier 1 VOD Standards Code and related requirements.
Across the European Union, the Digital Services Act (Regulation (EU) 2022/2065) continues to shape governance of online services through risk and transparency obligations, while the European Media Freedom Act (Regulation (EU) 2024/1083, adopted in April 2024) adds a common framework for media services and cooperation among national regulators. This framework raises the compliance bar for cross-border operations. In Canada, the CRTC is progressing implementation of the Online Streaming Act, with an increased focus on domestic content contributions that also raises compliance and trade-policy sensitivity for multinational streaming platforms operating across North American markets.
Competitive Landscape
The media streaming market hosts a moderately concentrated field where the top five players control a significant share yet face vigorous competition from regional specialists. Netflix, Disney, and Amazon leverage global distribution footprints and in-house production pipelines to secure premium talent, while local champions focus on linguistic and cultural niches. Investment priority has shifted to advertising technology; Netflix’s April 2025 rollout of an in-house ad platform illustrates the pivot toward monetization depth over subscriber breadth.
Technology is a decisive battleground. Edge compute deployments by Comcast and similar operators foster exclusive quality guarantees that smaller rivals struggle to replicate.[1]Comcast via Qwilt, “Edge Compute Deployment,” qwilt.com Patent filings reveal ongoing work on AI-driven content adaptation that auto-adjusts encoding profiles scene by scene, reducing bitrates without noticeable quality loss and saving millions in delivery fees.[2]Stephen Follows, “What Netflix’s Patents Reveal,” stephenfollows.com Strategic moves underline intensified jockeying: Disney’s 70% purchase of Fubo TV merges live sports strength with a vast on-demand library, while Roku’s acquisition of Frndly TV extends its family-oriented channel bundle.[3]Streaming Media, “H.267: A Codec for Future,” streamingmedia.com
White-space opportunities persist in interactive formats and creator-economy partnerships that shorten time-to-market for niche stories. The entrance of social media giants into longer-form video could squeeze traditional players unless they leverage existing subscriber bases to test new formats quickly. Consolidation remains likely as rising content and compliance costs favor scale, meaning that the media streaming market may trend toward a higher concentration ratio over the next five years.
Media Streaming Industry Leaders
Spotify Technology S.A.
Apple Inc.
Amazon Prime (Amazon.com Inc.)
Tencent Holdings Limited
AT&T Inc.
- *Disclaimer: Major Players sorted in no particular order
Media Streaming Market Companies Covered in this Report
- Netflix Inc.
- Spotify Technology S.A.
- Apple Inc. (Apple TV+, Apple Music)
- Amazon.com Inc. (Prime Video, Amazon Music)
- Alphabet Inc. (YouTube, YouTube Music)
- Tencent Holdings Ltd. (Tencent Video, QQ Music)
- The Walt Disney Company (Disney+, ESPN+)
- AT&T Inc. (Max / HBO, DirecTV Stream)
- Comcast Corp. (Peacock, NOW TV)
- Roku Inc.
- Deezer S.A.
- Baidu Inc. (iQIYI, Qian Qian Music)
- British Broadcasting Corporation (BBC iPlayer)
- Hulu LLC
- Pandora Media LLC
- ViacomCBS Inc. (Paramount+)
- Sony Group Corp. (Crunchyroll, Sony LIV)
- Naspers Ltd. (Showmax)
- FuboTV Inc.
- DAZN Group Ltd.

Market Opportunities and Future Outlook
Hybrid monetization is creating whitespace in advertising and bundling infrastructure as streamers move beyond subscription-only strategies toward diversified revenue per user. The Amazon Ads and Roku partnership announced in June 2025, which is positioned around access to a large share of connected-TV households with integrated measurement, points to the direction of travel toward scaled, interoperable ad reach and accountability across platforms. It also supports growth in ad-supported tiers, FAST channel aggregation, and first-party audience tooling that is resilient to signal loss.
Content distribution partnerships and regulatory-driven localization are also opening routes to expand catalog depth without fully replicating production spend in every market. Netflix's carriage arrangement with TF1, announced in June 2025 and structured to add five linear channels and 30,000 on-demand hours to French subscribers in July 2026, offers a blended broadcaster-inventory model that pairs with streaming UX to address local tastes and policy expectations, while extending viewing hours. On the technology side, low-latency live streaming and interactive formats remain a practical opportunity area as sports-rights fragmentation increases the value of synchronized delivery, and platform investments in edge compute, cloud-native CDNs, and newer codecs support higher-bitrate mobile experiences tied to 5G rollout programs, particularly in Asia-Pacific.
Recent Industry Developments in Media Streaming Market
- July 2026: Samsung and Amazon Music announced a strategic partnership to preinstall the Amazon Music app on millions of Samsung mobile and tablet devices globally, paired with a three-month Amazon Music Unlimited offer for new users. The partnership expands distribution at the device level and can lower customer-acquisition costs while increasing listening time into Amazons advertising and commerce ecosystem.
- June 2025: Amazon Ads and Roku announced a partnership designed to give brands broad access to connected-TV households, aligning ad buying and measurement across the two platforms. The collaboration strengthens the economics of ad-supported streaming by improving reach planning and reducing fragmentation for CTV advertisers.
- May 2025: Roku acquired Frndly TV for USD 185 million, adding a bundle of live channels and expanding lower-priced subscription options within the Roku environment. The deal supports deeper aggregation of linear-style streaming and increases inventory for AVOD and FAST-style monetization.


Media Streaming Market Report Scope and Research Methodology
Market Definition and Coverage
This market covers revenues generated when audio or video content is delivered to users over the internet through streaming, across subscription and advertising-based monetization, and across common consumer devices.
Scope exclusions: We exclude non-streamed physical media sales and offline downloads that are primarily purchased for permanent ownership rather than streamed consumption.
Segments Covered in This Report
- By Content Type
- Video Streaming
- Music Streaming
- By Service Type
- Live Streaming
- On-Demand Streaming
- By Revenue Model
- Subscription (SVOD/AVOD/Hybrid)
- Advertising (AVOD/FAST)
- By Streaming Quality
- SD
- HD
- 4K / UHD
- 8K
- By Geography
- North America
- United States
- Canada
- Mexico
- South America
- Brazil
- Argentina
- Mexico
- Rest of South America
- Europe
- Germany
- United Kingdom
- France
- Italy
- Spain
- Rest of Europe
- Asia-Pacific
- China
- Japan
- South Korea
- India
- Australia
- New Zealand
- Rest of Asia-Pacific
- Middle East
- United Arab Emirates
- Saudi Arabia
- Rest of Middle East and Africa
- Africa
- South Africa
- Rest of Africa
- North America
Data Sources, Market Sizing, and Validation
Desk Research
Desk work started with public indicators that explain who can stream, what quality they can stream at, and how monetization typically works. We relied on sources such as ITU and national telecom regulators for broadband coverage, speed, and device connectivity, then used OECD-style digital economy tables where available to cross-check subscription behavior and household spending patterns.
To link demand with supply-side realities, we reviewed company filings, earnings call transcripts, investor presentations, and trusted press coverage for subscriber trends, ad load direction, and pricing changes. We also used patent databases to spot shifts in codecs, streaming optimization, and delivery technologies that can change the quality mix (SD to 4K/UHD and above) and cost curves, and for some checks we used paid subscriptions that provide company financials and intelligence plus news and financials. These desk sources are illustrative, and we also consulted other public references to collect data points, validate assumptions, and clear up scope questions.
Primary Interviews and Surveys
Primary inputs were gathered through expert interviews and structured surveys with platform executives, product and monetization leaders, ad sales and content operations teams, and ecosystem participants such as device, connectivity, and measurement specialists. Since this is a global market, we covered demand patterns and pricing behavior across major regions, and then used the discussions to refine ad-supported versus subscription splits, quality tier uptake, and realistic adoption timing for new offerings.
Distribution of primary research fieldwork respondents
| Company type | Respondent position | Region |
|---|---|---|
| Top tier: 30% | CXOs: 13% | APAC: 43% |
| Mid tier: 51% | Functional/Unit leaders: 28% | EMEA: 36% |
| Smaller Players: 19% | Managers: 59% | Americas: 21% |
Market-Sizing & Forecasting
Sizing was built from a top-down view where broadband users, smartphone and smart TV penetration, and streaming-capable connections were used to reconstruct the addressable demand pool, then filtered through paid adoption and ad-supported usage. Once that pool was formed, revenue was estimated using a simple structure of paid subscribers times ARPU plus advertising impressions times effective CPMs, with the mix split guided by the subscription versus advertising model.
To keep totals realistic, we corroborated the outputs with selective bottom-up approximations, such as sampling known platform pricing, checking reported subscriber ranges, and pressure-testing implied revenue per user against public statements. Key inputs used in the model included subscription price moves, churn and re-join patterns, ad load direction in ad tiers, the streaming quality mix (SD, HD, 4K/UHD, 8K), and device mix shifts across smartphone/tablet, laptop/desktop, smart TV, and gaming console usage.
Forecasts were produced using scenario analysis, where adoption, pricing, and advertising yield paths were varied and then aligned to expert consensus from primary calls. Where bottom-up checks had gaps for private players or smaller geographies, we used proxy ARPU and penetration ranges anchored to comparable markets, then tightened the range using regional connectivity and income signals.
Data Validation & Update Cycle
Outputs were validated through triangulation across independent signals, including reported subscriber disclosures, ad market direction, and device and broadband indicators, so no single data point could dominate the final number. When a region or year showed an unusual jump, we checked assumptions one by one, then re-contacted experts if the variance could not be explained by pricing, mix, or policy changes.
Before sign-off, the model and key assumptions go through a multi-step analyst review where arithmetic checks, unit consistency, and currency conversion timing are verified. Reports are refreshed annually, and interim updates are made when major events materially shift pricing, monetization structure, or regional access. Right before delivery, an analyst performs a fresh pass to ensure the view reflects the latest publicly available disclosures and market signals.
Mordor Intelligence's Media Streaming Market Size Versus Other Published Estimates
Published market numbers for media streaming often differ because the counted revenues and the timing year are not always aligned, and because some sources combine adjacent digital entertainment categories into the same total.
The main gap comes from scope expansion into broader streaming media that can fold in extra content types and end-user buckets, then apply faster adoption and steeper ARPU ramps. Under that gap driver, Mordor Intelligence keeps the scope tied to video and music streaming monetized through subscription and advertising, and it is pressure-tested using device usage and streaming quality mix checks so the counted revenues track actual consumption patterns.
Benchmark comparison
| Source | Market Size | Gaps in Research Methodology |
|---|---|---|
| Mordor Intelligence | USD 151.17 B (2026) | |
| Market Newswire A | USD 108.73 B (2025) | Uses an earlier base year and gives limited detail on included revenue lines, which can leave advertising versus subscription splits and currency timing less comparable to a defined streaming scope. |
| Industry Publisher B | USD 171.00 B (2025) | Defines the market more broadly as streaming media and includes wider content and end-user categories, which can lift the total versus a tighter media streaming definition. |
The spread across the table is largely explained by year selection and what gets bundled into the total, especially when broader streaming media categories are included. By tying the market build to observable adoption and monetization drivers, then cross-checking implied ARPU and ad yield against real-world signals, the final number stays traceable and repeatable.


Key Questions Answered in the Report
What is the current size of the media streaming market?
The media streaming market generated USD 151.17 billion in 2026 and is projected to reach USD 215.61 billion by 2031.
Which content type dominates revenue?
Video streaming led with 77.35% of revenue in 2025, though music streaming is growing fastest at an 8.39% CAGR.
How quickly is live streaming growing?
Live streaming revenue is forecast to expand at a 9.44% CAGR through 2031, driven mainly by exclusive sports coverage and event-based viewing.
What region will contribute the fastest growth?
Asia-Pacific is poised for the highest regional CAGR at 8.97% thanks to 5G rollouts and local content production scaling.
Why are advertising-supported tiers gaining traction?
Ad-supported plans address price-sensitive viewers and deliver higher CPMs for platforms; over half of Netflix’s new 2026 subscribers selected an ad tier.
How important is 8K streaming to future growth?
Although HD still prevails, 8K streams are expected to rise at an 17.7% CAGR as advanced codecs reduce data loads and edge compute infrastructure matures.
Page last updated on:


 Your data is secure and never sold or shared.


