Mobile TV Market Size and Share
Market Overview
| Study Period | 2020 - 2031 |
|---|---|
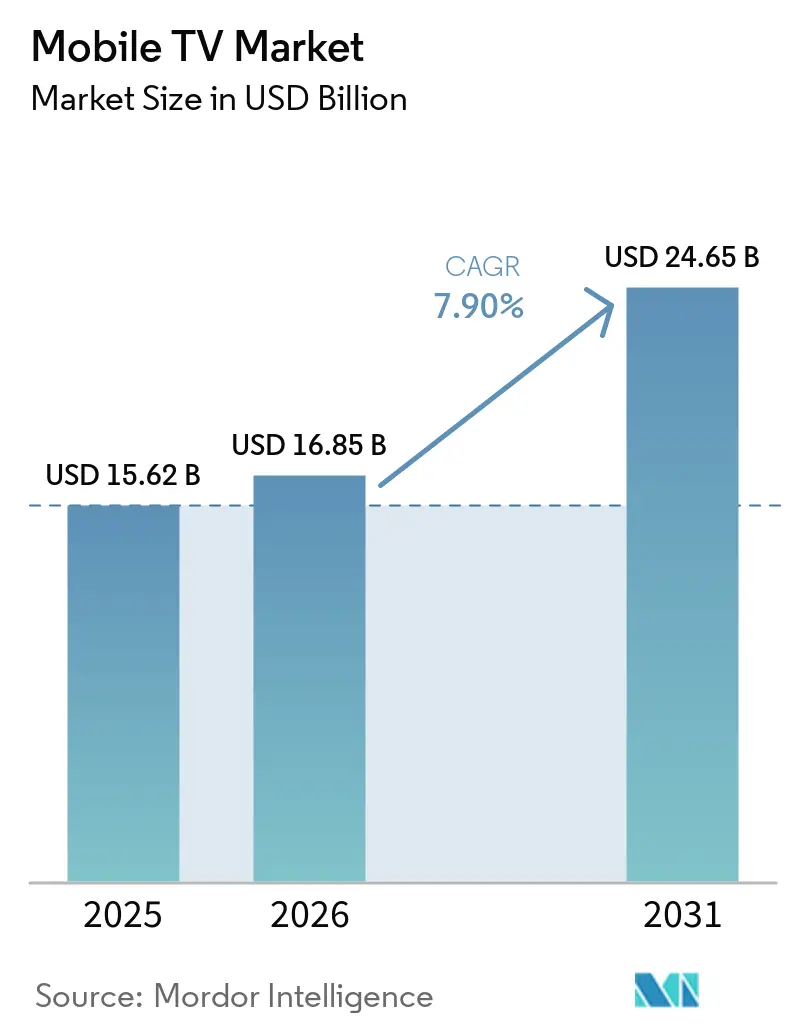
| Market Size (2026) | USD 16.85 Billion |
| Market Size (2031) | USD 24.65 Billion |
| Growth Rate (2026 - 2031) | 7.90% CAGR |
| Fastest Growing Market | Asia Pacific |
| Largest Market | Asia-Pacific |
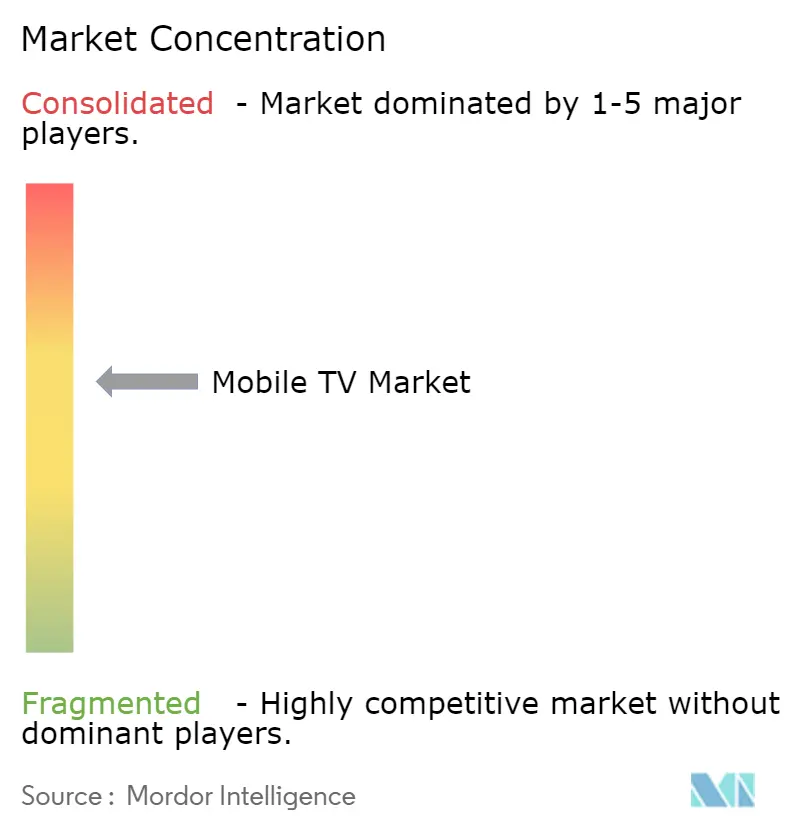
| Market Concentration | Medium |
Major Players *Disclaimer: Major Players sorted in no particular order Image © Mordor Intelligence. Reuse requires attribution under CC BY 4.0. | |
Mobile TV Market Analysis by Mordor Intelligence
The mobile TV market size is expected to increase from USD 15.62 billion in 2025 to USD 16.85 billion in 2026 and reach USD 24.65 billion by 2031, growing at a CAGR of 7.9% over 2026-2031. A shift from linear broadcasting to ad-supported, hybrid-freemium formats is accelerating revenue expansion, while low-latency 5G networks and sub-USD 50 smartphones add fresh demand. Industry players are deploying telco-satellite aggregation for premium sports, adopting shoppable overlays that lift average revenue per user, and optimizing apps for entry-level hardware to defend engagement. Competitive pressure is prompting vertical integration of content production and experimentation with 5G Broadcast eMBMS to trim delivery costs.
Key Report Takeaways
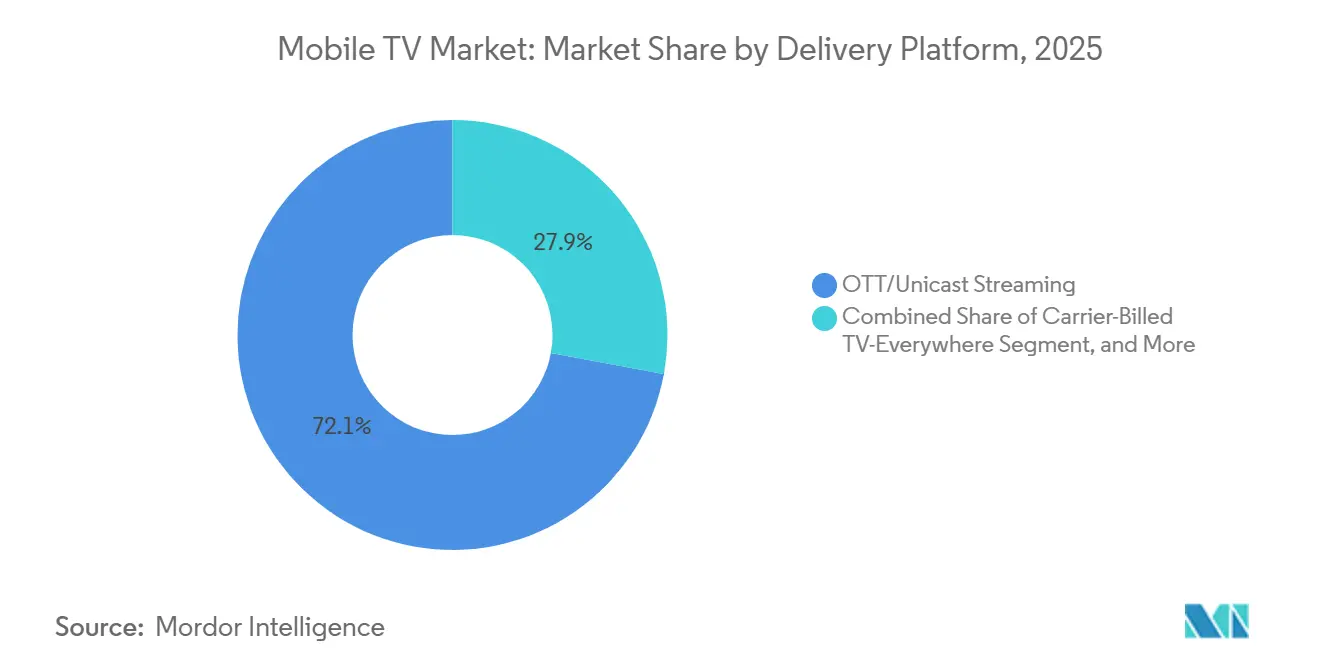
- By delivery platform, OTT unicast streaming captured 72.1% of the mobile TV market, while 5G Broadcast is projected to grow at a 9.4% CAGR over 2026-2031.
- By device type, smartphones accounted for 82.8% of the mobile TV market in 2025; connected wearables are set to expand at a 9.1% CAGR through 2031.
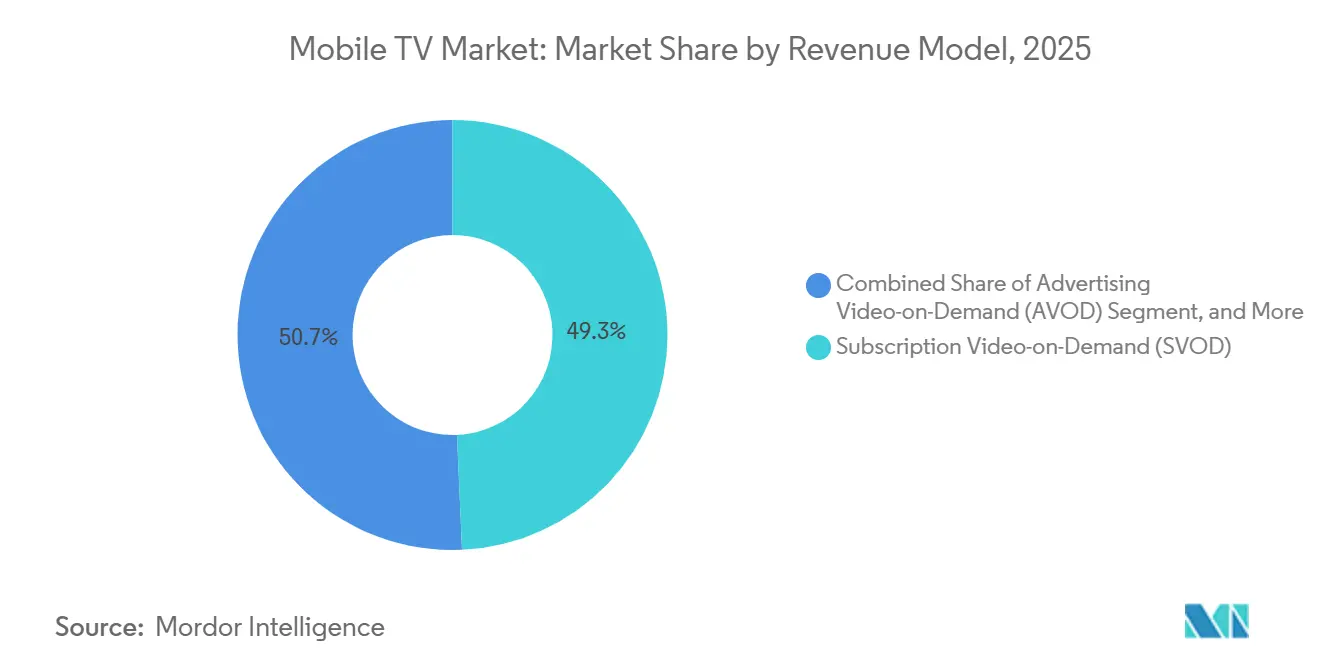
- By revenue model, SVOD commanded 49.3% of the mobile TV market in 2025, yet hybrid freemium and FAST channels are the fastest-growing segment, growing at a 9.7% CAGR.
- By content type, live sports led with a 10.1% CAGR, outpacing entertainment and movies, which accounted for 36.4% of the mobile TV market share in 2025.
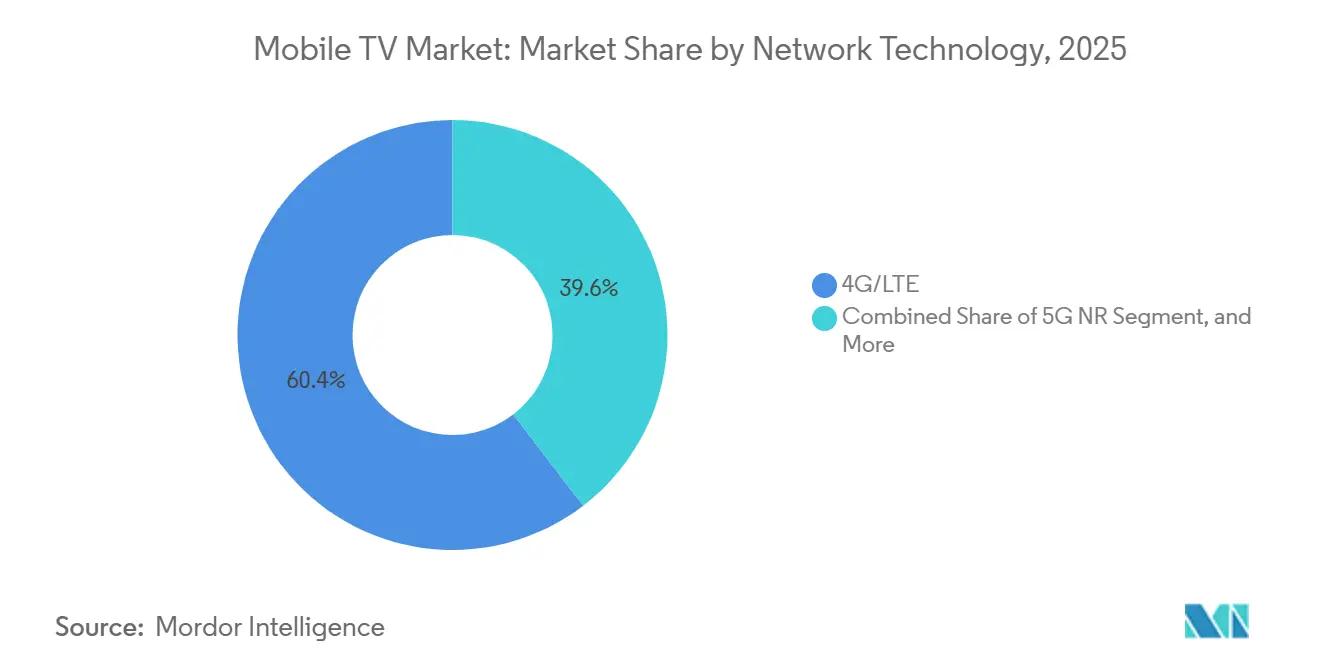
- By network technology, 4G/LTE accounted for 60.4% of the mobile TV market in 2025; 5G NR is set to expand at a 10.3% CAGR through 2031.
- By operating system, Android contributed 77.5% share of the mobile TV market size in 2025; HarmonyOS and other operating systems are set to expand at a 9.8% CAGR through 2031.
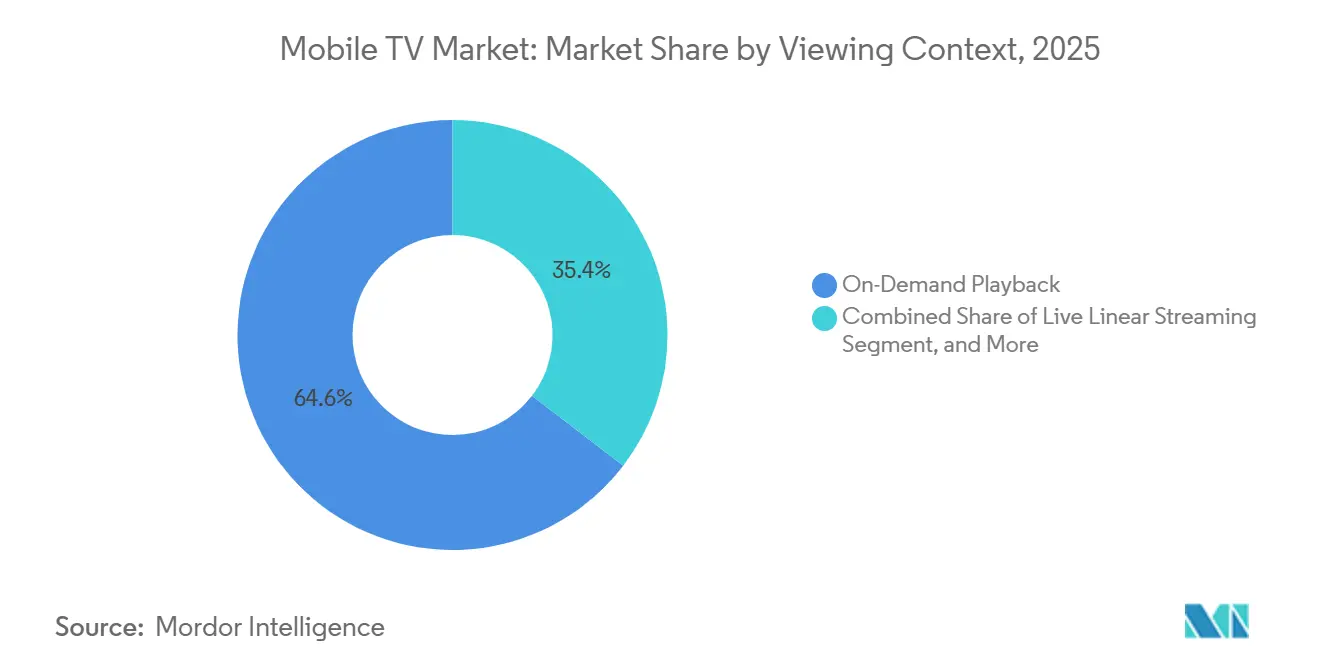
- By viewing context, On-Demand Playback contributed 64.6% share of the mobile TV market size in 2025; Live Linear Streaming is set to expand at a 10.2% CAGR through 2031.
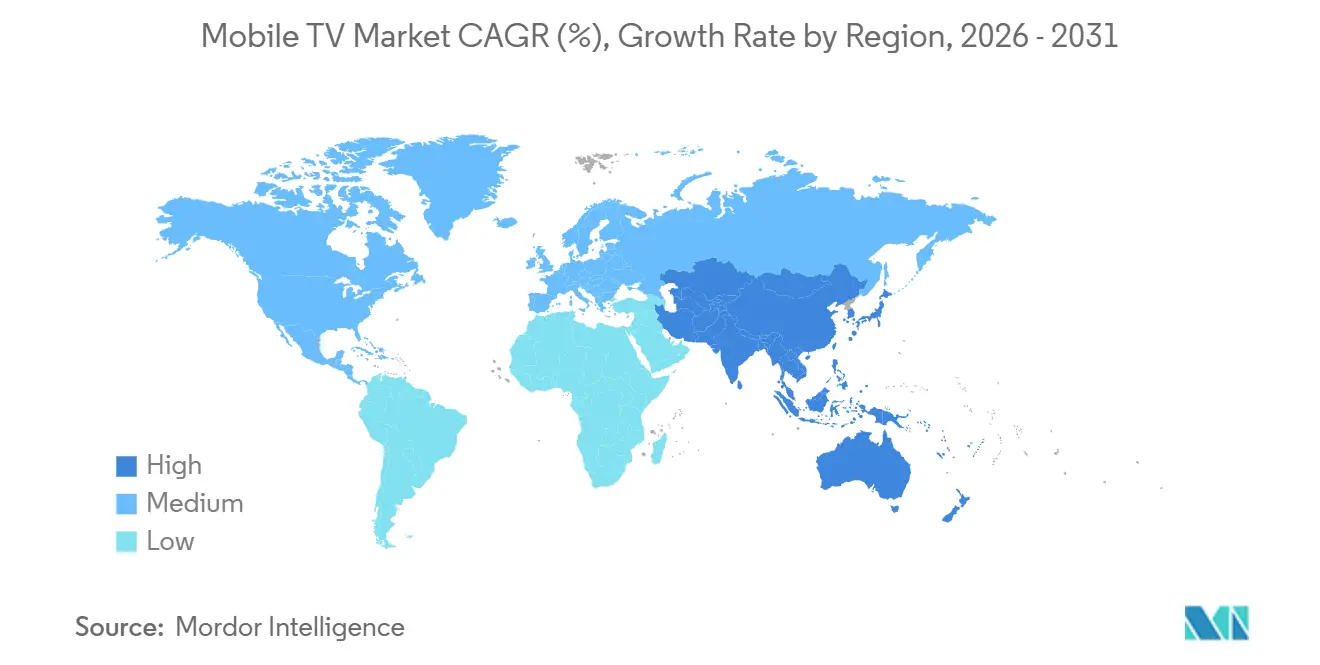
- By geography, Asia-Pacific held 35.8% of the mobile TV market in 2025, and is forecast to advance at an 8.8% CAGR through 2031.
Note: Market size and forecast figures in this report are generated using Mordor Intelligence’s proprietary estimation framework, updated with the latest available data and insights as of January 2026.
Global Mobile TV Market Trends and Insights
Drivers Impact Analysis*
| Driver | (~) % Impact on CAGR Forecast | Geographic Relevance | Impact Timeline |
|---|---|---|---|
| Expansion of 5G Mid-Band Networks | +1.5% | Global, led by North America, China, South Korea, Gulf states | Medium term (2-4 years) |
| Rise of Hybrid AVOD + SVOD Monetization | +1.3% | Global, especially North America, Europe, major Asia-Pacific metros | Short term (≤ 2 years) |
| Smartphone Affordability in Emerging Markets | +1.1% | Sub-Saharan Africa, South Asia, Southeast Asia | Long term (≥ 4 years) |
| Telco-Satellite Aggregation for Live Events | +0.9% | North America, Europe, Middle East, spillover to Latin America | Medium term (2-4 years) |
| Edge-Native AI Predictive Pre-Caching | +0.8% | Global early adoption in North America, China, South Korea | Medium term (2-4 years) |
| Shoppable Video Integration Boosting ARPU | +0.7% | North America, China, South Korea, rising in Southeast Asia, Latin America | Short term (≤ 2 years) |
| Source: Mordor Intelligence | |||
Expansion of 5G Mid-Band Networks
Nationwide 5G rollouts are enabling sustained throughput above 500 Mbps, which supports simultaneous 4K streams and interactive overlays. South Korea reported 17.49 million 5G subscribers in 2025 with average download speeds of 1,064 Mbps, allowing 2 million concurrent viewers of K-League matches on Coupang Play. U.S. carriers completed C-band deployments the same year, and early 5G Broadcast trials delivered FIFA World Cup feeds to thousands without per-stream cost penalties.[1]SES, “SES and Verizon partner to deliver FIFA World Cup mobile streaming,” ses.com Lower delivery costs let operators reinvest savings in exclusive rights or zero-rated bundles, spurring subscriber growth.
Rise Of Hybrid AVOD + SVOD Monetization
Platforms now layer ad-supported plans beneath premium tiers to maximize reach while preserving high-ARPU subscribers. Netflix and Disney+ shifted large portions of 2025 sign-ups to lower-priced ad tiers, noting lower churn compared with SVOD-only cohorts.[2]CNBC, “HBO Max, Paramount+ streaming services will merge,” cnbc.com Paramount’s Pluto TV achieved profitability with over 250 FAST channels by keeping per-stream costs below USD 0.10. Hybrid models combat saturation in developed regions and improve affordability in emerging markets where willingness to pay remains limited.
Smartphone Affordability In Emerging Markets
Sub-USD 50 Android handsets unlocked first-time video use across Africa and South Asia, driving a 35% rise in app downloads within six months of pilot launches in Nigeria, Kenya, and Tanzania. In India, average selling prices slid to USD 180 in 2025, enabling telcos to bundle mobile cricket rights with prepaid packs costing INR 299 (USD 3.60). Providers are optimizing codecs and adaptive bitrates for 360p default streams, plus offline downloads for low-end devices to protect engagement.
Telco-Satellite Aggregation For Live Events
Carrier-satellite hybrids guarantee bandwidth during marquee tournaments. Verizon and SES used O3b mPOWER to backhaul FIFA World Cup streams in 2025, safeguarding user experience when urban cells are saturated. Amazon’s Project Kuiper will extend Thursday Night Football coverage to rural North America from 2026. The FCC and ITU have harmonized spectrum to minimize interference, enabling on-demand satellite capacity without fiber overbuilds and expanding rural addressable audiences.
Restraints Impact Analysis*
| Restraint | (~) % Impact on CAGR Forecast | Geographic Relevance | Impact Timeline |
|---|---|---|---|
| Escalating Content-Licensing Inflation | -1.2% | Global, acute in North America and Europe | Short term (≤ 2 years) |
| Spectrum Scarcity for eMBMS Broadcast | -0.6% | North America, Europe, Asia-Pacific | Medium term (2-4 years) |
| Regulatory Backlash on Data Zero-Rating | -0.5% | European Union, United Kingdom, India, emerging in Latin America | Short term (≤ 2 years) |
| Battery-Thermal Limits on 6 GHz Streaming | -0.4% | Global, stronger in tropical and subtropical regions | Long term (≥ 4 years) |
| Source: Mordor Intelligence | |||
Escalating Content-Licensing Inflation
Via LA raised annual H.264 patent-pool caps to USD 4.5 million in 2025, up 29% since 2022.[3]Streaming Media, “Shoppable Video Integration and H.264 Licensing Updates,” streamingmedia.com Hollywood studios simultaneously lengthened exclusive theatrical windows, delaying availability on mobile SVOD services. Rising rights costs squeeze margins because mobile users churn quickly when catalogs shrink. Several platforms have pivoted toward originals, yet CJ ENM’s heavy investment still produced an operating loss in Q4 2025, underscoring execution risk.
Regulatory Backlash On Data Zero-Rating
European courts ruled that zero-rating violates open-internet rules, and BEREC documented 47 non-compliant deals in 2025.[4]BEREC, “BEREC publishes 2025 report on zero-rating practices in Europe,” berec.europa.eu Ofcom followed with similar guidance in the United Kingdom. The decisions remove a key distribution subsidy that helped platforms penetrate price-sensitive markets, forcing them to compete on content and UX rather than free data. Slower uptake is likely where per-gigabyte costs stay high.
*Our forecasts treat driver/restraint impacts as directional, not additive. The impact forecasts reflect baseline growth, mix effects, and variable interactions.
Segment Analysis
By Delivery Platform: Broadcast Offload Gains Traction
Unicast OTT accounted for 72.1% of revenue in 2025, yet 5G Broadcast is projected to expand at a 9.4% CAGR. Operators favor eMBMS because one transmission serves unlimited viewers, cutting peak costs. U.S. spectrum allocations of 60 MHz in mid-band spectrum support commercial trials. Carrier-billed TV-everywhere retains niche relevance for live news and sports bundles, while satellite-hybrid paths cover rural zones where fiber is scarce.
eMBMS performance parity with unicast, sub-200 ms latency for 1080p60, was proven during the 2025 World Cup trials. Regulatory momentum in the European Broadcasting Union for cross-border standards may accelerate adoption. Traditional broadcasters transitioning to direct apps, such as Globo-owned GloboPop, highlight a shift from wholesale carriage to consumer ownership.


By Device Type: Wearables Signal Format Shift
Smartphones captured 82.8% of 2025 revenue and remain the core viewing device of the mobile TV market. Wearables, including VR and AR glasses, are forecast to rise 9.1% CAGR as products like Meta’s USD 799 Ray-Ban Display and Apple’s forthcoming N50 under USD 1,000 improve mobility. Tablets serve communal and educational niches, while video-capable feature phones bridge affordability gaps. The increasing adoption of smartphones and wearables is driven by advancements in technology, affordability, and the growing demand for on-the-go entertainment solutions.
Wearables require new video ratios and spatial audio, prompting content teams to rethink production. Netflix introduced a vertical-clip feed in April 2026, meeting portrait-first habits, while Apple’s Vision Pro triggered early developer interest in 3D storytelling despite limited adoption. The shift towards wearables and immersive technologies is expected to redefine content creation strategies, with companies investing in innovative formats to cater to evolving consumer preferences.
By Revenue Model: Freemium Blurs Boundaries
SVOD represented 49.3% of 2025 revenue, but hybrid freemium and FAST are advancing at a 9.7% CAGR. The Subscription Video on Demand (SVOD) segment continues to dominate the market, driven by its ability to offer premium content and exclusive releases. However, the growth of hybrid freemium models and Free Ad-Supported Streaming Television (FAST) platforms is reshaping the competitive landscape. Pluto TV exemplifies the lean-cost economics of FAST platforms, which sustain profitability even at low Average Revenue Per User (ARPU). Major players like Netflix and Disney+ have introduced ad-supported tiers, which have proven effective in reducing subscriber churn and expanding their audience reach. Pay-per-view remains relevant for high-profile events, such as UFC fights priced at USD 70-80 per event, although its market share is gradually declining.
Regulations currently allow hybrid models, yet privacy rules cap behaviorally targeted ads, nudging platforms toward contextual placement. Privacy regulations, particularly in developed markets, limit the use of behaviorally targeted advertisements, compelling platforms to adopt contextual ad placements instead. For emerging markets, free tiers paired with shoppable commerce links monetize audiences that previously pirated content. In these regions, platforms are leveraging innovative monetization strategies, such as integrating e-commerce links into free-tier content, to capture revenue from audiences that historically relied on pirated material.
By Content Type: Sports Command Premium Distribution
Live sports are poised for 10.1% CAGR as the NBA’s USD 76 billion deal funnels 247 games into ESPN+, Prime Video, and Peacock. Amazon’s Thursday Night Football streams show a younger demographics skew, with increased engagement from Gen Z and Millennials. Additionally, regional sports networks are exploring direct-to-consumer models to retain local fan bases. Entertainment and movies face budget escalation, motivating studios to focus on franchises and sequels that guarantee higher returns. News builds daily engagement but earns thinner margins due to limited monetization opportunities. Kids’ content grows steadily because parents value ad-free safety and educational programming, with platforms like YouTube Kids and Disney+ leading the segment.
Providers must bag exclusive sports to reduce churn, yet high rights costs now demand bundling across broader catalogs to amortize fees, as Reliance Jio has done by packaging IPL streaming with prepaid plans. Furthermore, partnerships with telecom operators and device manufacturers are becoming increasingly common, enabling providers to expand their reach and offer bundled services at competitive prices.
By Network Technology: 5G NR Accelerates Offload
4G LTE is projected to supply 60.4% of video in 2025, while 5G NR is expected to grow at a compound annual growth rate (CAGR) of 10.3%. South Korea’s average speeds of 1,064 Mbps enable low-latency interactivity, enhancing user experiences. This capability is particularly beneficial for applications such as augmented reality (AR), virtual reality (VR), and live streaming, which demand high-speed and stable connections. Additionally, Wi-Fi 6E offers 40% lower in-home latency, although it comes with the trade-off of higher battery consumption. The sunset of legacy 3G networks is freeing up spectrum for refarming, which is expected to support advancements in connectivity and improve network efficiency.
Edge caching relies on 5G technology to achieve sub-50 millisecond hops, reducing costs by staging popular video clips at tower locations. This approach not only enhances video delivery speeds but also alleviates network congestion during peak usage times. Device manufacturers face the challenge of managing radios to minimize thermal throttling at 6 GHz, a significant technical hurdle, particularly in hot climates. Overcoming this issue is critical to ensuring consistent performance and user satisfaction in regions with extreme temperatures.
By Operating System: HarmonyOS Challenges Duopoly
Android held a 77.5% share in 2025, but HarmonyOS is growing at a 9.8% CAGR as Huawei gains 17% of the handset share in China. HarmonyOS 6 unifies device runtimes, easing code portability and enabling seamless integration across Huawei's ecosystem of products, including smartphones, tablets, and IoT devices. iOS secures value in high-income regions through SharePlay and spatial audio features that enhance user engagement and drive premium device sales. Regional compliance, such as China’s content pre-approval rules, shapes development roadmaps and influences app store policies.
Fragmentation pressures platforms to build tri-native apps plus web versions to avoid 30% store commissions, which developers often find restrictive. HarmonyOS’s lower take-rates attract developers by offering a more favorable revenue-sharing model, while Apple’s tight policies continue to spur antitrust scrutiny globally. Additionally, the growing adoption of HarmonyOS in emerging markets highlights its potential to challenge the dominance of Android and iOS in the long term.
By Viewing Context: Live Linear Surges On Sports
On-demand video consumption dominated at 64.6% in 2025, but live streaming is projected to grow at a 10.2% CAGR as exclusive events increasingly shift online. The download-to-go feature remains essential in regions where data costs are high or network coverage is unreliable. Hardware-bound DRM schemes, such as Widevine L1 and FairPlay, play a crucial role in securing offline libraries and maintaining geoblocks, ensuring compliance with licensing agreements.
Traffic surges during live event finals require edge caching to stabilize network performance and reduce latency. While regulatory stances remain neutral, EU rights-holders are actively lobbying for shorter offline viewing windows to address piracy concerns and protect intellectual property rights.
Geography Analysis
Asia-Pacific led with 35.8% of 2025 revenue and will keep the highest 8.8% CAGR to 2031. China’s 1.2 billion monthly mobile video users across Tencent Video, iQIYI, and Douyin form the largest single-country opportunity. India’s prepaid bundles that feature cricket rights maintain subscriber momentum, and South Korea’s rapid AVOD growth points to the maturation of hybrid models. Japan emphasizes anime, forcing global streamers to license local IP.
North America and Europe grow more slowly but still account for roughly 55% of revenue combined. A USD 111 billion merger between Paramount and Warner Bros. Discovery, announced in 2026, illustrates consolidation pressure. EU net-neutrality enforcement eliminates zero-rating, requiring platforms to invest in quality of experience rather than free data to stand out.
South America, the Middle East, and Africa present 7-8% CAGR prospects, though infrastructure and income gaps remain. Globo’s April 2026 launch of GloboPop in Brazil displays regional broadcasters’ pivot to curated vertical video. Gulf states invest in satellite backhaul to guarantee coverage of global tournaments, while subsidized USD 40 smartphones in Nigeria, Kenya, and Tanzania catalyze first-time streaming.

Competitive Landscape
The top five platforms, Netflix, Amazon Prime Video, Disney+, YouTube, and Tencent Video, accounted for approximately 60% of the revenue in 2025, reflecting a moderately concentrated market. These platforms are leveraging strategies such as original content production to reduce dependency on licensing, hybrid monetization models to broaden their audience base, and advanced technologies like 5G Broadcast and edge AI to optimize delivery costs. The merger of Paramount and Warner Bros. Discovery is a significant move aimed at achieving economies of scale, with a combined subscriber base exceeding 200 million. Meanwhile, regional players are defending their market share by launching vertical-video applications and focusing on localized content to cater to specific audience preferences.
Technological advancements are playing a pivotal role in differentiating service providers. Edge AI has significantly improved user experience by reducing time-to-first-frame by 40%, while eMBMS technology supports unlimited concurrent live streams, enhancing scalability. However, regulatory changes, such as the European Union's ban on zero-rating practices, have eliminated certain cost advantages, compelling providers to focus on content exclusivity and innovative user interfaces to maintain competitiveness. These developments highlight the growing importance of technology investments in shaping the future of the market.
In addition to traditional subscription models, platforms are exploring new monetization opportunities through wearable-ready formats and live commerce overlays. These innovations are creating additional revenue streams and enhancing user engagement by integrating interactive features into content delivery. As the market evolves, providers are expected to continue investing in cutting-edge technologies and strategic partnerships to address the increasing demand for high-quality, personalized content while navigating regulatory challenges and intensifying competition.
Mobile TV Industry Leaders
Netflix, Inc.
Amazon.com, Inc.
Google LLC
The Walt Disney Company
Apple Inc.
- *Disclaimer: Major Players sorted in no particular order

Recent Industry Developments
- April 2026: Globo launched GloboPop, a free vertical-video app featuring 30 in-house personalities and 25 external creators, with Magalu as a branded-content partner.
- April 2026: Netflix added a portrait-mode clip feed to its mobile app, mirroring TikTok-style discovery.
- April 2026: Globo completed an IP-only distribution overhaul using Secure Reliable Transport across Brazil.
- March 2026: Paramount and Warner Bros. Discovery announced a USD 111 billion merger to combine Paramount+ and HBO Max into one service.


Global Mobile TV Market Report Scope
The Mobile TV Market Report is Segmented by Delivery Platform (OTT Unicast Streaming, Carrier-Billed TV-Everywhere, 5G Broadcast eMBMS, Satellite-Terrestrial Hybrid), Device Type (Smartphones, Tablets, Feature Phones, Connected Wearables), Revenue Model (SVOD, AVOD, TVOD PPV, Hybrid Freemium and FAST), Content Type (Entertainment and Movies, Live Sports, News and Information, Education and Kids), Network Technology (4G LTE, 5G NR, Wi-Fi 6 6E, Legacy 3G 2G), Operating System (Android, iOS, HarmonyOS and Other), Viewing Context (On-Demand Playback, Live Linear Streaming, Download-to-Go), and Geography (North America, Europe, Asia-Pacific, South America, Middle East and Africa). The Market Forecasts are Provided in Terms of Value (USD).
| OTT/Unicast Streaming |
| Carrier-Billed TV-Everywhere |
| 5G Broadcast (eMBMS) |
| Satellite-Terrestrial Hybrid |
| Smartphones |
| Tablets |
| Feature Phones |
| Connected Wearables (VR/AR Glasses) |
| Subscription Video-on-Demand (SVOD) |
| Advertising Video-on-Demand (AVOD) |
| Transactional (TVOD/PPV) |
| Hybrid (Freemium and FAST) |
| Entertainment and Movies |
| Live Sports |
| News and Information |
| Education and Kids |
| 4G/LTE |
| 5G NR |
| Wi-Fi 6/6E |
| Legacy 3G/2G |
| Android |
| iOS |
| HarmonyOS and Other Operating Systems |
| On-Demand Playback |
| Live Linear Streaming |
| Download-to-Go |
| North America | United States |
| Canada | |
| Mexico | |
| Europe | Germany |
| United Kingdom | |
| France | |
| Russia | |
| Rest of Europe | |
| Asia-Pacific | China |
| Japan | |
| India | |
| South Korea | |
| Australia | |
| Rest of Asia-Pacific | |
| South America | |
| Middle East and Africa |
| By Delivery Platform | OTT/Unicast Streaming | |
| Carrier-Billed TV-Everywhere | ||
| 5G Broadcast (eMBMS) | ||
| Satellite-Terrestrial Hybrid | ||
| By Device Type | Smartphones | |
| Tablets | ||
| Feature Phones | ||
| Connected Wearables (VR/AR Glasses) | ||
| By Revenue Model | Subscription Video-on-Demand (SVOD) | |
| Advertising Video-on-Demand (AVOD) | ||
| Transactional (TVOD/PPV) | ||
| Hybrid (Freemium and FAST) | ||
| By Content Type | Entertainment and Movies | |
| Live Sports | ||
| News and Information | ||
| Education and Kids | ||
| By Network Technology | 4G/LTE | |
| 5G NR | ||
| Wi-Fi 6/6E | ||
| Legacy 3G/2G | ||
| By Operating System | Android | |
| iOS | ||
| HarmonyOS and Other Operating Systems | ||
| By Viewing Context | On-Demand Playback | |
| Live Linear Streaming | ||
| Download-to-Go | ||
| By Geography | North America | United States |
| Canada | ||
| Mexico | ||
| Europe | Germany | |
| United Kingdom | ||
| France | ||
| Russia | ||
| Rest of Europe | ||
| Asia-Pacific | China | |
| Japan | ||
| India | ||
| South Korea | ||
| Australia | ||
| Rest of Asia-Pacific | ||
| South America | ||
| Middle East and Africa | ||


Key Questions Answered in the Report
What is the projected value of the mobile TV market in 2031?
The mobile TV market size is forecast to reach USD 24.65 billion by 2031, expanding at a 7.9% CAGR over 2026-2031 (Mordor Intelligence).
Which region will grow fastest through 2031?
Asia-Pacific is expected to record the strongest 8.8% CAGR, fueled by large user bases in China, India, and South Korea (Mordor Intelligence).
Which delivery platform will see the quickest growth?
5G Broadcast using eMBMS is projected to rise at a 9.4% CAGR as operators seek spectrum-efficient live-event distribution (Mordor Intelligence).
How dominant are smartphones in mobile video revenue?
Smartphones contributed 82.8% of 2025 revenue, far ahead of tablets and wearables, though wearables will grow faster at 9.1% CAGR (Mordor Intelligence).
Why are hybrid ad-supported tiers important now?
Hybrid AVOD + SVOD models widen audience reach, cut churn, and raise ad revenue, especially in price-sensitive markets, making them the fastest-growing revenue model at 9.7% CAGR (Mordor Intelligence).
What is driving the surge in live sports streaming?
Exclusive digital rights deals, like the NBA's USD 76 billion agreement, are shifting marquee events to streaming platforms, pushing live sports to a 10.1% CAGR to 2031 (Mordor Intelligence).
Page last updated on:


