Cloud TV Market Size and Share
Market Overview
| Study Period | 2020 - 2031 |
|---|---|
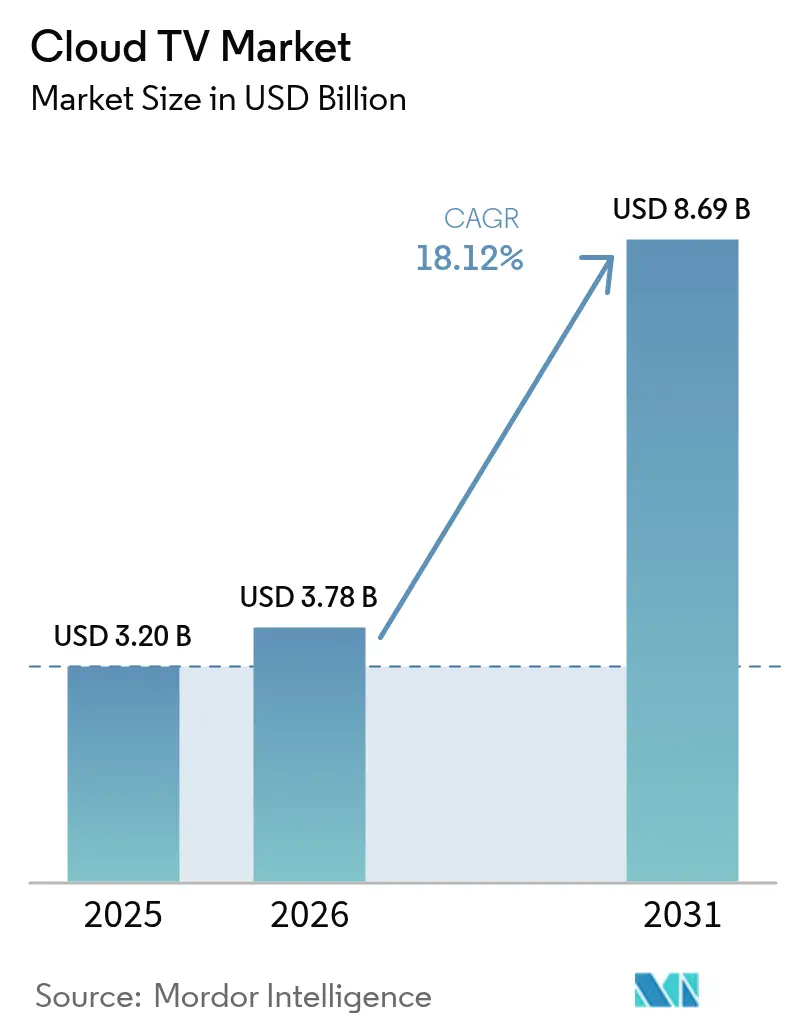
| Market Size (2026) | USD 3.78 Billion |
| Market Size (2031) | USD 8.69 Billion |
| Growth Rate (2026 - 2031) | 18.12% CAGR |
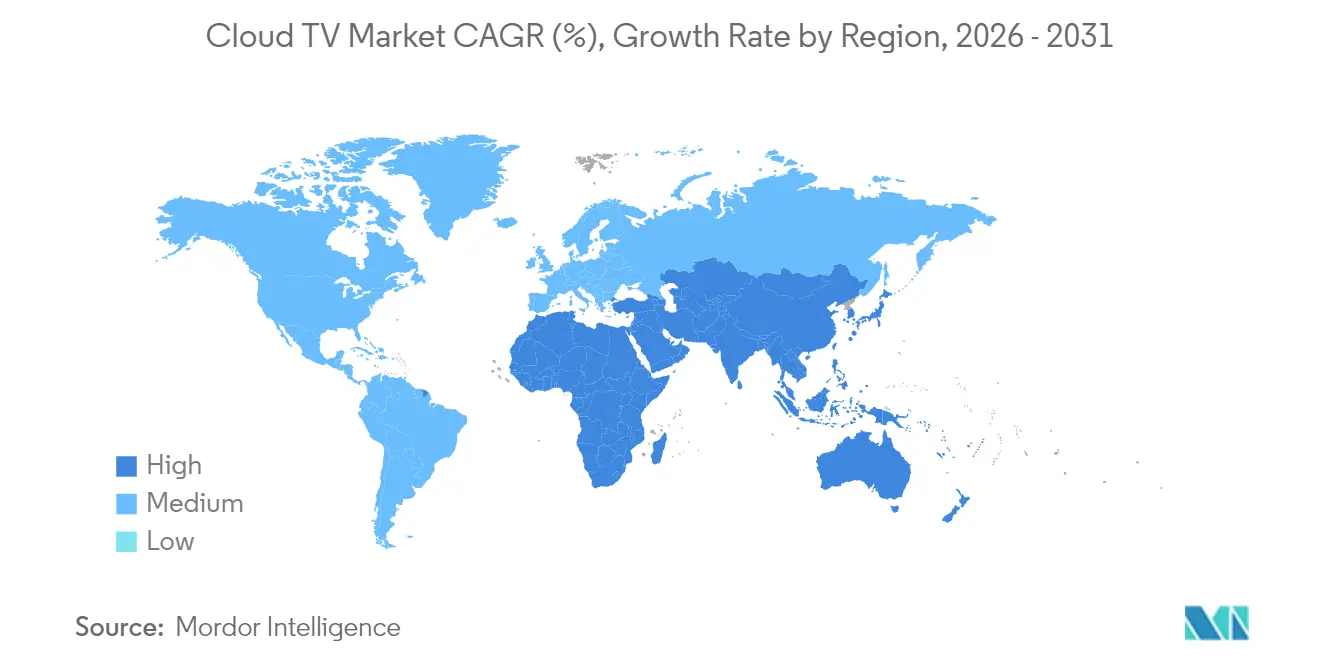
| Fastest Growing Market | Asia Pacific |
| Largest Market | North America |
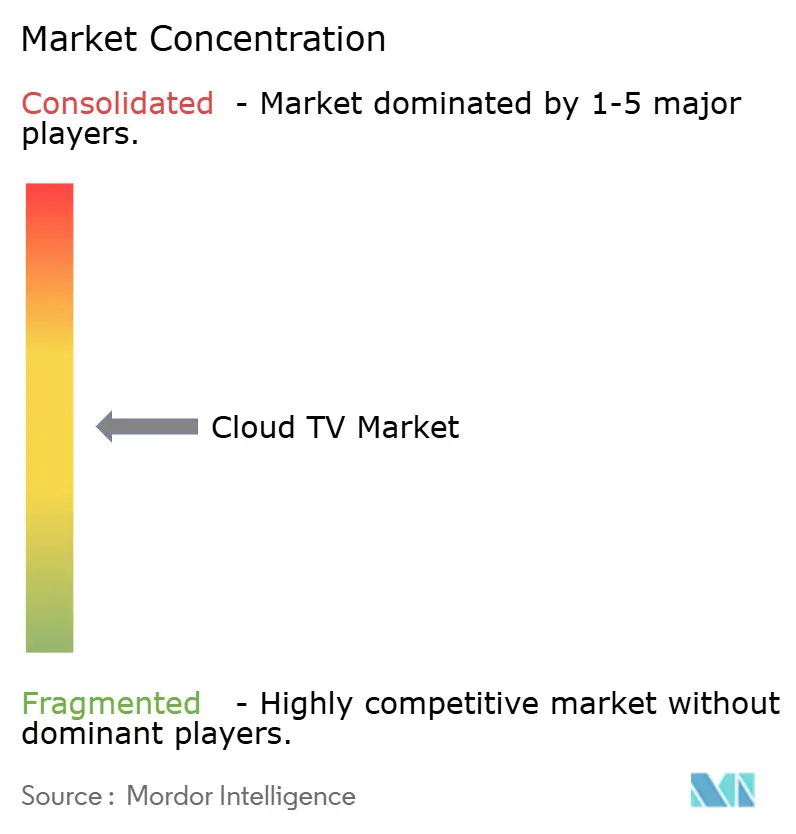
| Market Concentration | Medium |
Major Players *Disclaimer: Major Players sorted in no particular order Image © Mordor Intelligence. Reuse requires attribution under CC BY 4.0. | |
Cloud TV Market Analysis by Mordor Intelligence
Cloud TV market size in 2026 is estimated at USD 3.78 billion, growing from 2025 value of USD 3.20 billion with 2031 projections showing USD 8.69 billion, growing at 18.12% CAGR over 2026-2031. Surging demand for scalable video workflows, rapid 5G deployment, and telco convergence strategies are propelling adoption. Public cloud deployments still dominate, but hybrid architectures are gaining favour as media companies balance elasticity with broadcast-grade performance. Regulatory fragmentation, semiconductor supply constraints, and rising iOS acquisition costs remain growth headwinds. Intensifying competition between platform operators, device OEMs, and telcos is pushing vendors to differentiate through AI-driven discovery, contextual advertising, and integrated cloud gaming services. Early movers in Asia-Pacific are capturing asymmetric advantages thanks to faster network roll-outs and mass smartphone uptake.
Key Report Takeaways
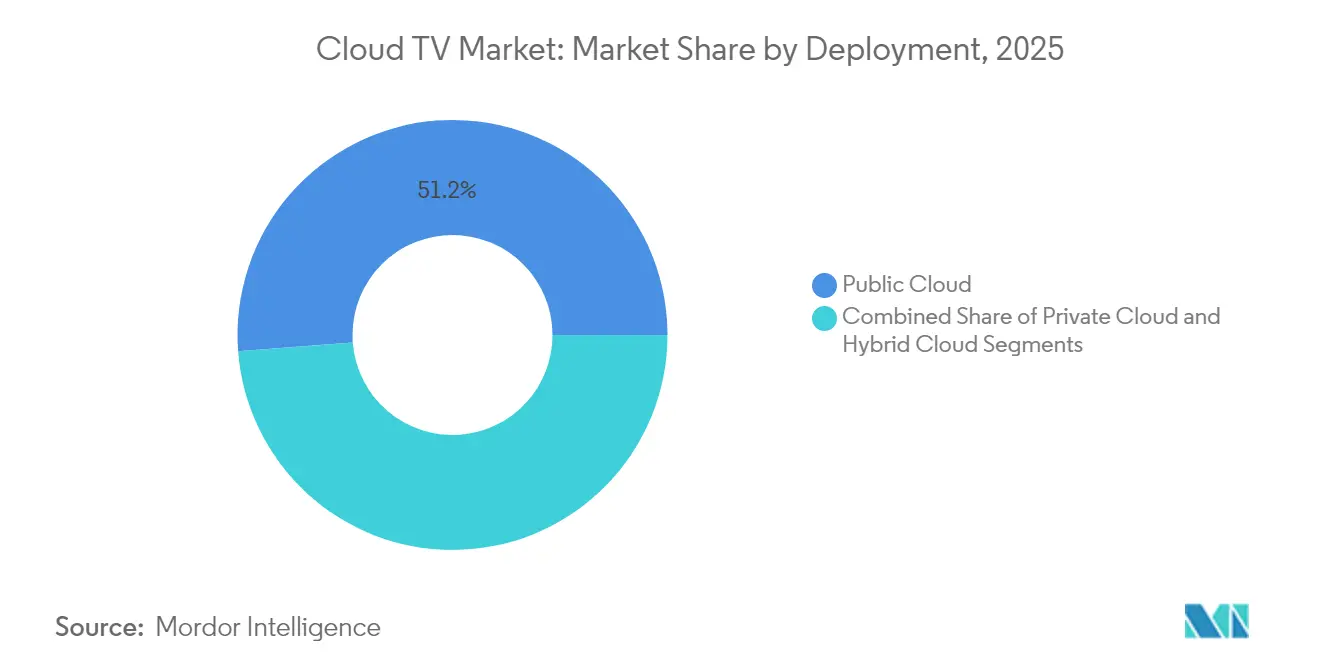
- By deployment, the Public Cloud segment led with 51.20% Cloud TV market share in 2025, while Hybrid Cloud is projected to grow at a 20.7% CAGR to 2031.
- By device type, Connected TVs captured 39.30% of the Cloud TV market size in 2025; Mobile Phones are expected to record the fastest CAGR at 22.9% through 2031.
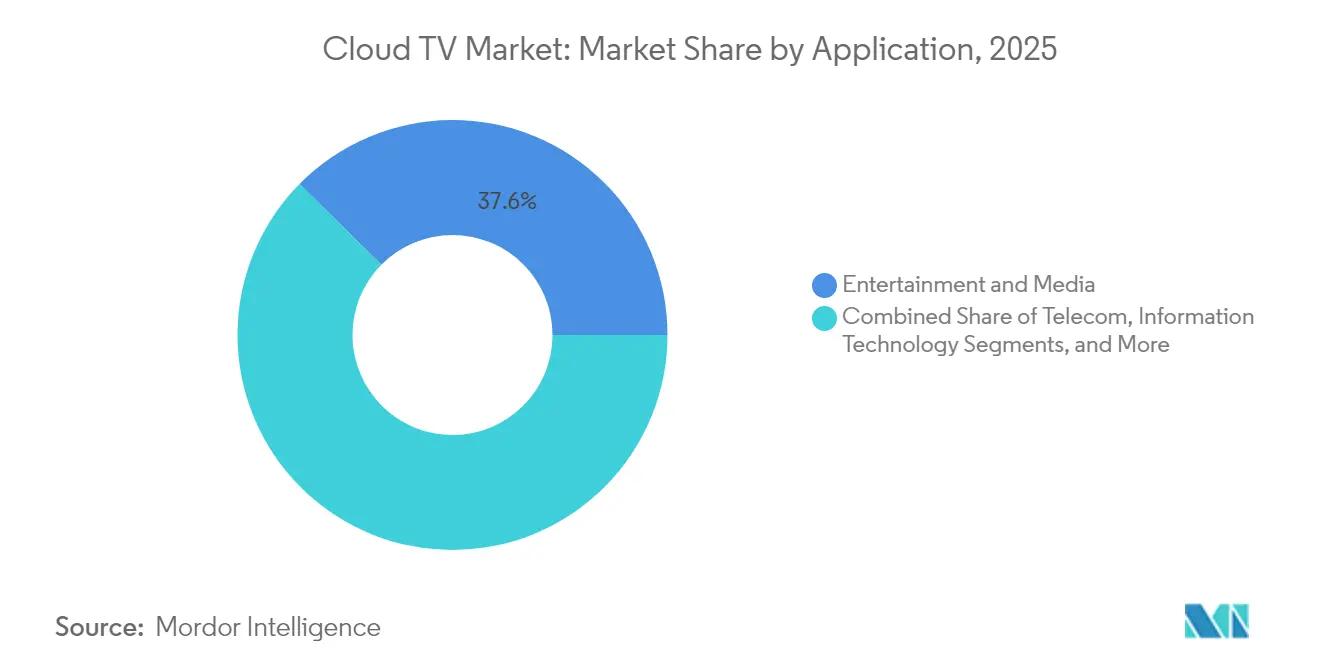
- By application, Entertainment Media commanded 37.60% of the Cloud TV market size in 2025, whereas Telecom applications are advancing at a 19.4% CAGR to 2031.
- By organisation size, Large Enterprises accounted for 59.10% of 2025 revenue, but SMEs are the fastest-growing cohort at a 21.4% CAGR to 2031.
- By Geographically, North America held 42.50% of 2025 revenue, while Asia-Pacific is the fastest-growing region with a 20.6% CAGR forecast for 2026-2031.
Note: Market size and forecast figures in this report are generated using Mordor Intelligence’s proprietary estimation framework, updated with the latest available data and insights as of 2026.
Global Cloud TV Market Trends and Insights
Drivers Impact Analysis*
| Driver | (~) % Impact on CAGR Forecast | Geographic Relevance | Impact Timeline |
|---|---|---|---|
| Continued fiber-to-home roll-outs enabling stable OTT delivery | +3.20% | Global, concentrated in North America and Europe | Medium term (2-4 years) |
| Rapid expansion of 5G fixed wireless access in rural North America and Europe | +2.80% | North America and Europe rural markets | Short term (≤ 2 years) |
| Tier-1 pay-TV operators’ shift to cloud-first STB replacement | +4.10% | Global, led by North America and Europe | Medium term (2-4 years) |
| OEM bundling of cloud-TV solutions with connected-TV chipsets in Asia | +3.50% | APAC core, spill-over to emerging markets | Long term (≥ 4 years) |
| FAST channel monetization models accelerating publisher adoption in Europe | +2.70% | Europe, expanding to North America | Short term (≤ 2 years) |
| Multi-tenant SaaS platforms reducing TCO for mid-tier operators | +2.50% | Global, strongest in emerging markets | Medium term (2-4 years) |
| Source: Mordor Intelligence | |||
Continued Fiber-to-Home Roll-outs Enabling Stable OTT Delivery
FTTH penetration has surpassed 50% in most developed markets, creating the bandwidth reliability the Cloud TV market needs for unbuffered 4K and 8K streams. Carriers such as AT&T are allocating USD 15 billion through 2025 to extend fiber to 30 million premises, which lowers reliance on costly edge caches and fosters premium live sports streaming. Operators further monetize fiber by bundling unlimited data tiers that remove bitrate ceilings and by leveraging deterministic QoS to support interactive features.
Rapid Expansion of 5G Fixed Wireless Access in Rural North America and Europe
5G FWA provides 100–200 Mbps downlinks at sub-10 millisecond latencies, turning previously underserved rural zones into viable Cloud TV market addresses. Operators, including T-Mobile and Verizon, aim to sign 4–5 million FWA subscribers by 2025, accelerating service reach without multi-year trenching costs. Bundled broadband-plus-TV plans and portable cloud-TV use cases for RV owners further inflate rural demand.
Tier-1 Pay-TV Operators’ Shift to Cloud-First STB Replacement
Deutsche Telekom’s MagentaTV moved 4.6 million subscribers onto a Broadpeak cloud DVR, cutting per-subscriber hardware from USD 150 to below USD 50 and enabling weekly feature roll-outs over the air. Similar migrations across Vodafone, Comcast, and Charter mitigate the PowerKEY conditional-access sunset affecting 20 million legacy boxes. Cloud-first frameworks also support unified back ends for multi-country footprints.
OEM Bundling of Cloud-TV Solutions with Connected-TV Chipsets in Asia
Smart-TV brands such as Sony, Xiaomi, and OnePlus are embedding MediaTek Pentonic silicon with integrated cloud TV OS capabilities. Whale TV’s partnership with TPV brings pre-installed cloud-TV functions to new screens, letting buyers sidestep add-on dongles. In India, Cloud TV 3.0 now serves more than 6 million active users via this embedded route, validating a hardware-software flywheel that shifts lifetime value from one-off device sales to recurring ad revenue.
Restraints Impact Analysis*
| Restraint | (~) % Impact on CAGR Forecast | Geographic Relevance | Impact Timeline |
|---|---|---|---|
| Fragmented CDN footprint in emerging Africa and Caribbean islands | -2.1% | Africa and Caribbean, extending to rural LATAM | Long term (≥ 4 years) |
| Persistent piracy and credential-sharing impacting revenue assurance | -3.4% | Global, most severe in APAC and emerging markets | Medium term (2-4 years) |
| High initial encoding/transcoding costs for UHD/HDR content | -1.8% | Global, constraining premium tier adoption | Short term (≤ 2 years) |
| Legacy CAS/DRM interoperability gaps slowing migration for small MSOs | -1.5% | North America and Europe legacy markets | Medium term (2-4 years) |
| Source: Mordor Intelligence | |||
Fragmented CDN Footprint in Emerging Africa and Caribbean Islands
Average in-country latency hits 78 milliseconds across much of Africa versus sub-45 milliseconds in North America, limiting consistent 1080p streaming. Roughly 50% of the region’s internet traffic transits foreign upstream providers; outages on West African submarine cables in 2024 crippled 13 nations, highlighting fragility. Without local PoPs, Cloud TV service providers must downshift bitrates, impairing the quality of experience and ad yields.
Persistent Piracy and Credential-Sharing Impacting Revenue Assurance
Global video piracy drained USD 67 billion in 2023, while password sharing undercuts 20% of U.S. S-VOD subscriptions. Netflix’s 2024 crackdown recaptured 13.1 million accounts, yet smaller Cloud TV platforms lack the leverage to impose similar policies. Emerging threats, including CDN leeching and illicit IPTV services, erode content-licensing valuations and dampen advertiser spending confidence.
*Our forecasts treat driver/restraint impacts as directional, not additive. The impact forecasts reflect baseline growth, mix effects, and variable interactions.
Segment Analysis
By Deployment: Hybrid Models Gaining Momentum
Public cloud held 51.20% of revenue in 2025, yet hybrid configurations are set to grow at a 20.7% CAGR to 2031 as broadcasters pursue flexible burst capacity alongside predictable QoS. This mix lets rights-holders keep premium sports archives in private clusters while relying on hyperscalers for live-event traffic. The Cloud TV market size for hybrid deployments is projected to accelerate as content owners map workloads to cost curves and exit ageing on-prem encoders. Regulatory-sensitive verticals such as public-sector media have already moved 45% of workflows to hybrid nodes to localise user data. Across use-cases, phased migrations de-risk legacy decommissioning, supporting uninterrupted audience reach during peak seasons.
Hybrid adoption also solves cross-border rights management: operators deploy origin caches in public regions close to diaspora populations while watermarking and DRM logic run in private domains. Vendors have responded with Kubernetes-based transcoders that elastically scale across both footprints. As a result, billing shifts from capex to granular usage, letting mid-tier networks test 4K distribution without buying new ASICs. By 2030, decision frameworks for cloud TV investment will weigh energy efficiency, carbon disclosure, and sovereign-cloud mandates as heavily as bitrate economics.


By Device Type: Mobile-First Strategies Reshape Viewing
Connected TVs (CTV) delivered 39.30% of 2025 revenue, yet smartphones are the fastest-growing end-point with a 22.9% CAGR forecast. Open-RAN 5G plus cheaper OLED panels have blurred the experiential gap so that 4K HDR on a 6.7-inch screen rivals lounge-room sets. Short-form series cut for vertical orientation dominate Gen-Z watchlists, forcing publishers to storyboard concurrently for tall and wide frames. The Cloud TV market share of mobile usage is expected to overtake CTVs in several Southeast Asian countries by 2027, powered by lower data tariffs and instalment-plan handset upgrades.
Multi-device sync is now table-stakes: advertisers use household graph technology to sequence a 15-second teaser on mobile, a 30-second deep-dive on CTV, and a shoppable overlay on tablet within the same evening. Cloud encoder vendors embed SSAI markers that cue dynamic QR codes aligned with active screen size. Such convergence recasts the notion of a primary screen; the winning proposition will offer frictionless hand-off rather than device-specific UX.
By Application: Entertainment Dominates, Telecom Accelerates
Entertainment and Media applications contributed 37.60% of 2025 revenue, anchored by SVOD giants pursuing global day-and-date strategies. The segment leverages the Cloud TV market’s low-latency capabilities to spin up live talk shows and watch-party features. Telecom-led services, however, are expanding fastest with a 19.4% CAGR as operators bundle TV, cloud gaming, and smart home dashboards to raise ARPU. Deutsche Telekom’s MagentaTV migrates catch-up libraries to cloud DVR, cutting set-top refresh costs while boosting time-shifted consumption telekom.com. Indian carriers embed regional-language hubs in the same app, lowering churn in tier-2 cities.
Cross-vertical mash-ups blur boundaries: e-commerce marketplaces stream shoppable live shows, while fitness brands deliver instructor-led workouts via CTV. Telecom platforms gain leverage because they control both last-mile quality and billing relationships, letting them cross-license content windows. Over time, advertising revenue share models may tilt toward telcos that can guarantee ad viewability metrics baked into QoS SLAs.
By Organisation Size: SMEs Embrace Cloud Flexibility
Large enterprises still generate 59.10% of sales, yet SMEs exhibit a 21.4% CAGR thanks to SaaS pipelines that remove hardware capex. Roughly 78% of small media businesses now rely on subscription-based editing, packaging, and serverless origin services to air long-tail channels hpe.com (cloud partner testimonial). The Cloud TV market size accessible to SMEs widens as white-label FAST channel platforms offer revenue-share rather than licence fees. Influencer-led networks can launch within days, renting per-minute transcode capacity and global CDN egress by the gigabyte.
Cloud orchestration levels the playing field: AI captioning, audience analytics, and contextual ad placement once reserved for tier-1 broadcasters now ship as API calls. Consequently, creative fragmentation rises even as distribution consolidates around a handful of operating-system walled gardens. Expect policy debates on discoverability quotas to intensify as niche producers seek fair shelf space on OEM home screens.
Geography Analysis
North America held 42.50% of 2025 revenue owing to mature broadband penetration, high SVOD stacking, and early adoption of contextual ad tech. Regional CDN nodes deliver sub-second start-up times, reinforcing willingness to pay for 4K and Dolby Vision tiers. Yet elevated iOS CPI threatens smaller studios’ profitability, nudging spend toward Android and web channels. The emergence of retail media networks, exemplified by Walmart’s integration of VIZIO’s SmartCast OS, demonstrates how data-rich retailers can bypass traditional broadcasters and sell incremental connected-TV inventory directly to brands .
Asia-Pacific is the fastest-growing region at a 20.6% CAGR, propelled by mass 5G roll-out, affordable Android TVs, and regional language curation. India’s Cloud TV 3.0 initiative adds voice assistants in 10 dialects, unlocking audiences previously tied to cable. Chinese OEMs preload proprietary TV operating systems that double as commerce gateways, giving device brands a bigger revenue share from advertising. South Korea piloted 8K livestreams of the 2024 Asian Games over 5G SA, setting a benchmark for immersive broadcasting. Collectively, these factors speed viewer migration from terrestrial TV to IP-delivered services.
Europe presents a patchwork of opportunities and constraints. High disposable income supports premium bundle uptake, as seen in Scandinavian markets where fibre households average two paid TV apps plus one cloud gaming pass. Network-slicing pilots in Germany prove that dedicated bandwidth can guarantee 20 ms round-trip for AAA cloud titles, yet country-specific loot-box rules complicate pan-EU launches. At the same time, cross-border M&A such as Swisscom’s acquisition of Vodafone Italia signals a drive to consolidate spectrum, fibre backbones, and streaming rights under fewer umbrellas, promising broader footprint synergies swisscom.com. Europe’s net-zero commitments are prompting broadcasters to move playout into greener data centres, potentially accelerating hybrid-cloud migrations.

Competitive Landscape
Competition is intensifying across hardware, platform, and service layers. Samsung leverages its 12.9% smart-TV OS footprint to push first-party FAST channels and capture ad spend that would traditionally flow to networks [2] Samsung Electronics Co., “Samsung Announces 2024 Tizen TV OS Expansion,” samsung.com . Roku counters by licensing its OS to budget TV brands while courting marketers with Roku Ad Watermark, a fraud-prevention identifier [3]Roku Inc., “Roku Ad Watermark Protects Streaming Advertisers,” roku.com . Walmart’s USD 2.3 billion VIZIO buyout underscores the strategic value of owning the glass and the data path.
Technology suppliers are bolstering AI capabilities. Amagi acquired Argoid to refine its machine-learning recommendation stack, promising 30% CTR uplift in early A/B tests amagi.com. Cineverse is building cineSearch on Google Cloud Vertex AI to resolve “what to watch” fatigue through vector similarity across dialogue, mood, and actor attributes cineverse.com. Telco incumbents invest in network-edge encoders and containerised CDNs so they can guarantee bitrate and advertising viewability as part of QoS contracts, a differentiator SVOD-only rivals cannot match.
As platforms converge, bargaining power shifts toward OEMs and ISPs that control device real estate or last-mile latency. Content exclusivity remains relevant yet is no longer sufficient; granular audience insights, predictive delivery, and ad measurement now dictate partnership terms. The top five players collectively command roughly 45% of global hours streamed, leaving room for disruptors to carve niches through regional language focus or interactive content.
Cloud TV Industry Leaders
Brightcove Inc.
Kaltura Inc.
Roku Inc.
Comcast Technology Solutions
Amazon Web Services
- *Disclaimer: Major Players sorted in no particular order

Recent Industry Developments
- March 2025: Dish TV's OTT platform, Dish TV Watcho, forged a strategic alliance with Cloud Walker's Cloud TV OS, a prominent smart TV operating system. This partnership seeks to enhance viewing experiences, granting access to Watcho's entertainment library across over 200 smart TV brands utilizing Cloud TV OS. As a result of this collaboration, Watcho's extensive content library will seamlessly integrate into the OS, reaching Cloud Walker’s growing audience of 18 million users on more than 6 million devices.
- November 2024: Comcast Technology Solutions (CTS) has unveiled its innovative Cloud TV platform, targeting the premium video sector on a global scale. As per their announcement, Cloud TV promises a versatile viewing experience, merging both broadcast and OTT content, all facilitated through a cloud-managed service operating round-the-clock.
- October 2024: Deutsche Telekom launched its “5G+ Gaming” package, giving subscribers access to 100 premium cloud-hosted titles with guaranteed low-latency network slices to enhance gameplay quality
- September 2024: CloudTV, under the leadership of co-founder and COO Abhijeet Rajpurohit, is set to broaden its operating system (OS) reach to set-top boxes (STBs) by early 2025. The ambition is to revolutionize television experiences throughout India. Established in 2017, CloudWalker, the brains behind CloudTV OS, specializes in crafting operating systems tailored for smart TVs. Rajpurohit elaborated, “We develop the comprehensive software within a smart TV, ensuring users can effortlessly access OTT apps and internet channels.”


Research Methodology Framework and Report Scope
Market Definitions and Key Coverage
Our study defines the cloud TV market as revenue earned by software platforms that virtualize set-top-box functions in the cloud so operators can stream live channels, on-demand catalogs, and interactive apps to connected TVs, smartphones, and other IP devices.
Scope Exclusion: Hardware sales of smart televisions, dedicated gaming consoles, and consumer premises equipment are not counted.
Segmentation Overview
- By Deployment
- Public Cloud
- Private Cloud
- Hybrid Cloud
- By Device Type
- Connected TV
- Mobile Phones
- Set-Top Box (STB)
- By Application
- Entertainment and Media
- Telecom
- Information Technology
- Consumer Television
- Other Applications
- By Organisation Size
- Large Enterprise
- Small and Medium Enterprise
- By Geography
- North America
- United States
- Canada
- South America
- Brazil
- Argentina
- Mexico
- Rest of Latin America
- Europe
- Germany
- United Kingdom
- France
- Italy
- Spain
- Rest of Europe
- Asia-Pacific
- China
- Japan
- South Korea
- India
- Australia
- New Zealand
- Rest of Asia-Pacific
- Middle East and Africa
- United Arab Emirates
- Saudi Arabia
- South Africa
- Rest of Middle East and Africa
- North America
Detailed Research Methodology and Data Validation
Primary Research
Mordor analysts held structured interviews with cloud-platform architects, regional pay-TV executives, CDN vendors, and media-agency buyers across North America, Europe, and Asia-Pacific. Insights on hybrid-cloud migration pace, license fee structures, and emerging ad-supported tiers helped us validate desk findings and fine-tune price-volume breakouts.
Desk Research
We began with current-year usage and spending baselines from open datasets such as ITU fixed-broadband subscriptions, Cisco VNI internet-video traffic, GSMA Intelligence 5G connections, and Ofcom audience diaries, which anchor device reach, bandwidth, and viewing minutes. Trade associations like the National Association of Broadcasters, Digital Video Broadcasting Project, and Asia Video Industry Association provide policy updates and codec adoption rates that refine penetration assumptions.
Financial filings from major streaming service providers, investor presentations by telcos, and reputable press releases supply average selling prices and margin trends. Paid resources, including D&B Hoovers for operator financials and Dow Jones Factiva for deal flow, fill historical gaps. This list is illustrative; many other public and subscription sources were consulted.
Market-Sizing & Forecasting
A top-down demand pool was built from broadband household counts, smart-TV installed base, OTT subscription ratios, and average revenue per user, which are then checked against sampled bottom-up supplier roll-ups and channel invoicing to align totals. Key variables like 5G coverage expansion, CDN price index, ad-supported video share, smart-TV shipments, and encoder efficiency gains drive year-to-year deltas. Multivariate regression with scenario analysis projects values to 2030, while gap areas in bottom-up estimates are bridged by region-specific sensitivity ranges agreed during primary calls.
Data Validation & Update Cycle
Outputs pass variance checks against external benchmarks, after which a senior analyst reviews anomalies before sign-off. We refresh every twelve months and trigger interim updates when material events, such as large M&A, spectrum auctions, and regulatory shifts, alter baselines.
Why Mordor's Cloud TV Baseline Stands Firm
Published estimates often diverge because firms choose different service scopes, pricing stacks, and refresh cadences.
Key Gap Drivers include whether ad-funded FAST channels are counted, if private-cloud licensing is treated as capex or opex, and the timeliness of exchange-rate conversions.
Benchmark comparison
| Market Size | Anonymized source | Primary gap driver |
|---|---|---|
| USD 3.20 B (2025) | Mordor Intelligence | - |
| USD 1.66 B (2024) | Global Consultancy A | Focuses on pure OTT apps, excludes hybrid-cloud operator migrations |
| USD 4.60 B (2025) | Industry Association B | Adds hosting-vendor contracts and bundled hardware, inflating total |
Taken together, the comparison shows that Mordor's disciplined scope, balanced top-down plus bottom-up cross-checks, and annual refresh yield a dependable baseline that decision-makers can trace back to clear variables and repeatable steps.


Key Questions Answered in the Report
What is the current Cloud TV Market size?
In 2026, the Cloud TV Market size is expected to reach USD 3.78 billion.
Who are the key players in Cloud TV Market?
Ooyala Inc., Brightcove Inc., Amino Technologies PLC, Fordela Corp. and NetSuite Inc. are the major companies operating in the Cloud TV Market.
Which is the fastest growing region in Cloud TV Market?
Asia Pacific is estimated to grow at the highest CAGR over the forecast period (2026-2031).
Which region has the biggest share in Cloud TV Market?
In 2025, the North America accounts for the largest market share in Cloud TV Market.
What years does this Cloud TV Market cover, and what was the market size in 2025?
In 2025, the Cloud TV Market size was estimated at USD 3.20 billion. The report covers the Cloud TV Market historical market size for years: 2020, 2021, 2022, 2023, 2024 and 2025. The report also forecasts the Cloud TV Market size for years: 2026, 2027, 2028, 2029, 2030 and 2031.
Page last updated on:


