Social TV Market Size and Share
Market Overview
| Study Period | 2020 - 2031 |
|---|---|
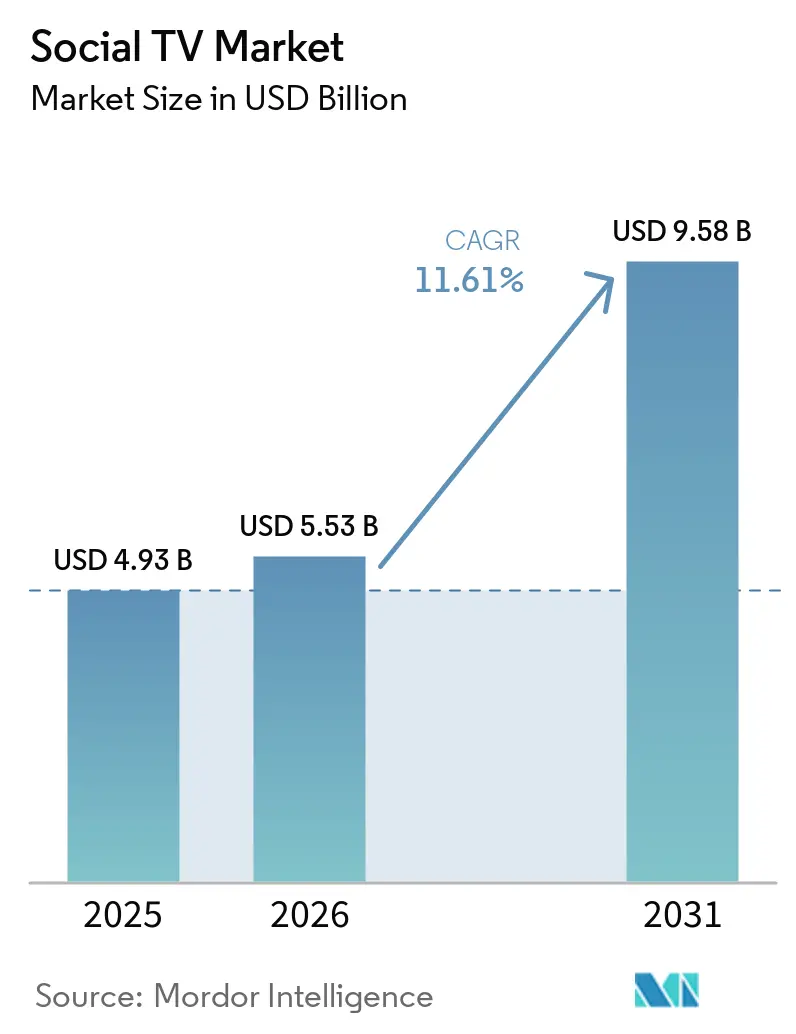
| Market Size (2026) | USD 5.53 Billion |
| Market Size (2031) | USD 9.58 Billion |
| Growth Rate (2026 - 2031) | 11.61% CAGR |
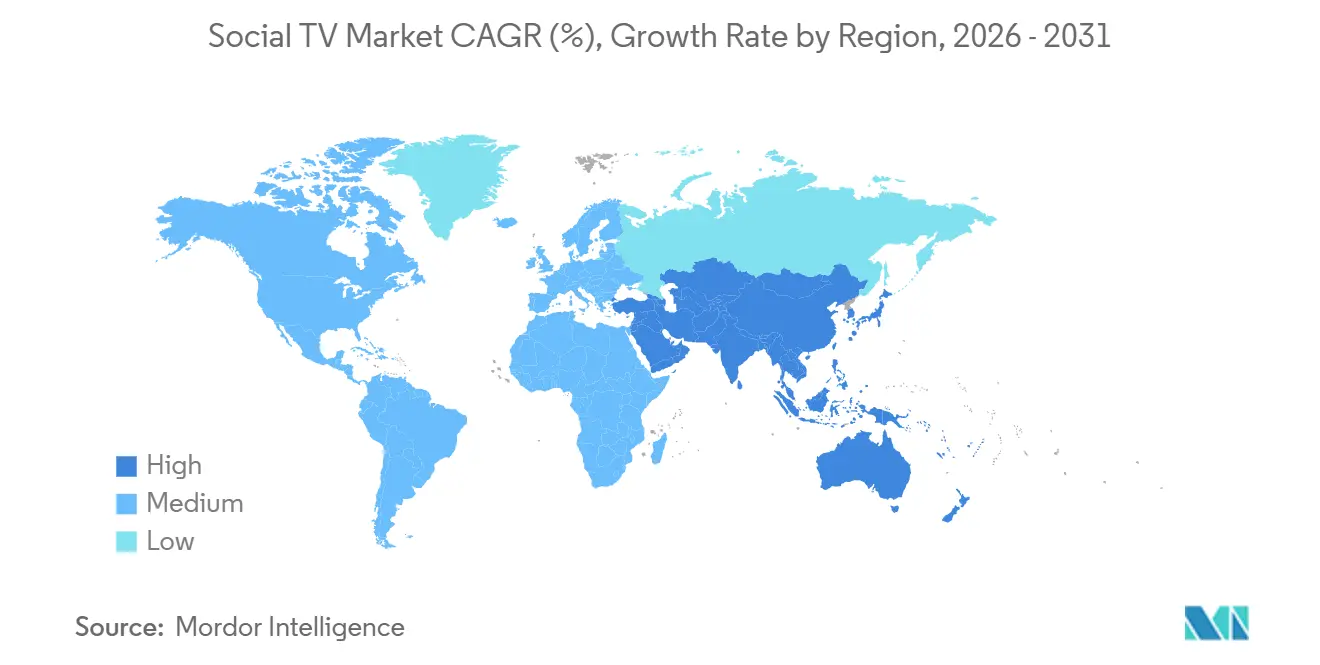
| Fastest Growing Market | Asia Pacific |
| Largest Market | North America |
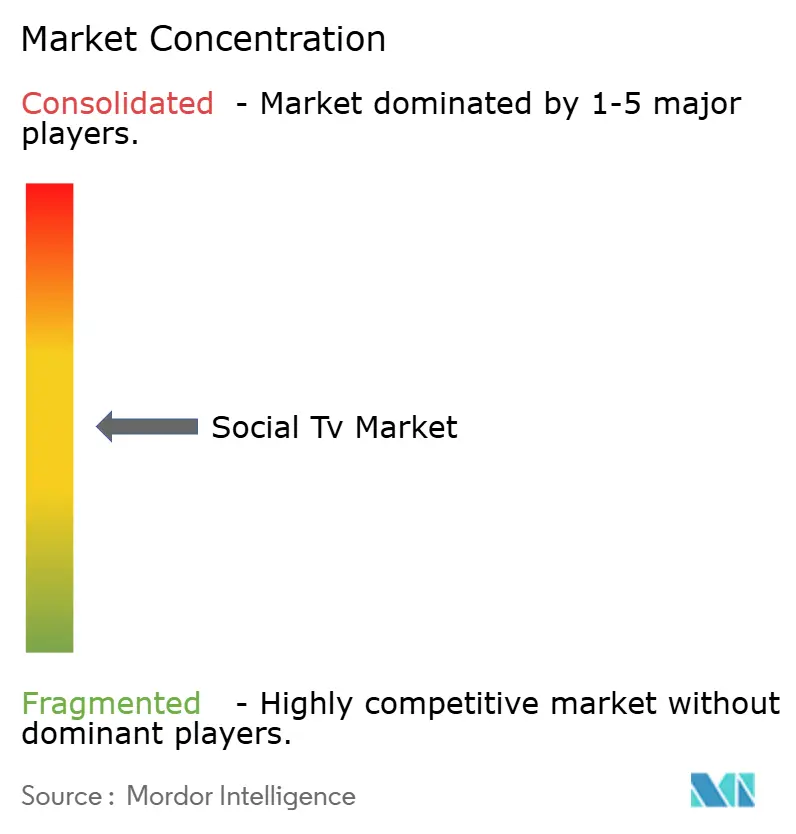
| Market Concentration | Medium |
Major Players *Disclaimer: Major Players sorted in no particular order Image © Mordor Intelligence. Reuse requires attribution under CC BY 4.0. | |
Social TV Market Analysis by Mordor Intelligence
The Social TV market size was valued at USD 4.93 billion in 2025 and estimated to grow from USD 5.53 billion in 2026 to reach USD 9.58 billion by 2031, at a CAGR of 11.61% during the forecast period (2026-2031). Three structural shifts underpin this momentum: programmatic advertising is migrating from linear channels to connected television, the creator economy is extending long-form formats onto the big screen through alliances such as Tubi’s March 2026 partnership with TikTok, and AI-powered recommendation engines are turning passive dual-screen browsing into active, shoppable engagement. United States advertisers already placed more than USD 10 billion of incremental spend in social video over linear television during 2025, signaling an irreversible tilt toward communal viewing environments. The Interactive Advertising Bureau projects connected-TV ad spend to rise 13.8% in 2026, while 70% of CTV buyers intend to lift budgets by an average 17%, even as smaller brands battle creative-production bottlenecks. Platform operators that can fuse data, commerce, and low-latency interactivity now capture disproportionate value inside the Social TV market.
Key Report Takeaways
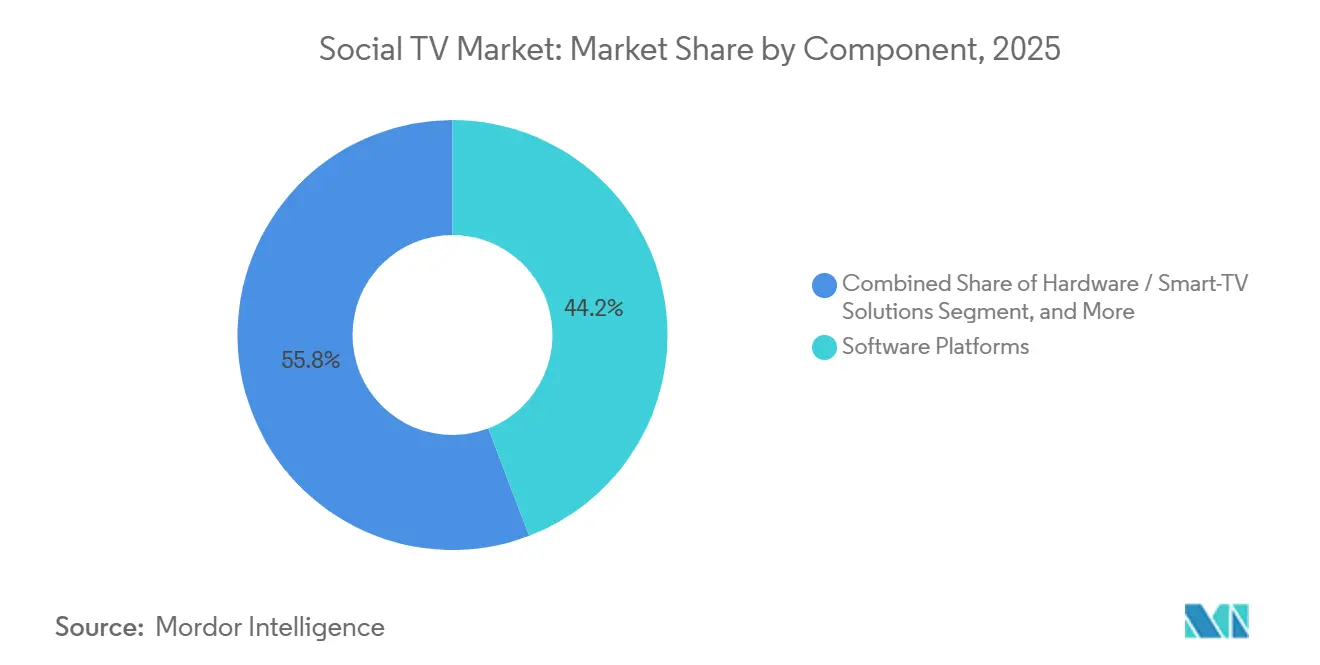
- By component, software platforms led with 44.19% of revenue in 2025, whereas analytics tools are projected to post the fastest 12.43% CAGR through 2031.
- By application, audience engagement and community building held 35.43% of the Social TV market share in 2025, but commerce and shoppable TV applications are poised to expand at 12.78% CAGR to 2031.
- By device and platform, smart TVs and connected-TV operating systems captured 41.17% of 2025 revenue, while gaming consoles are forecast to register a 12.51% CAGR through 2031.
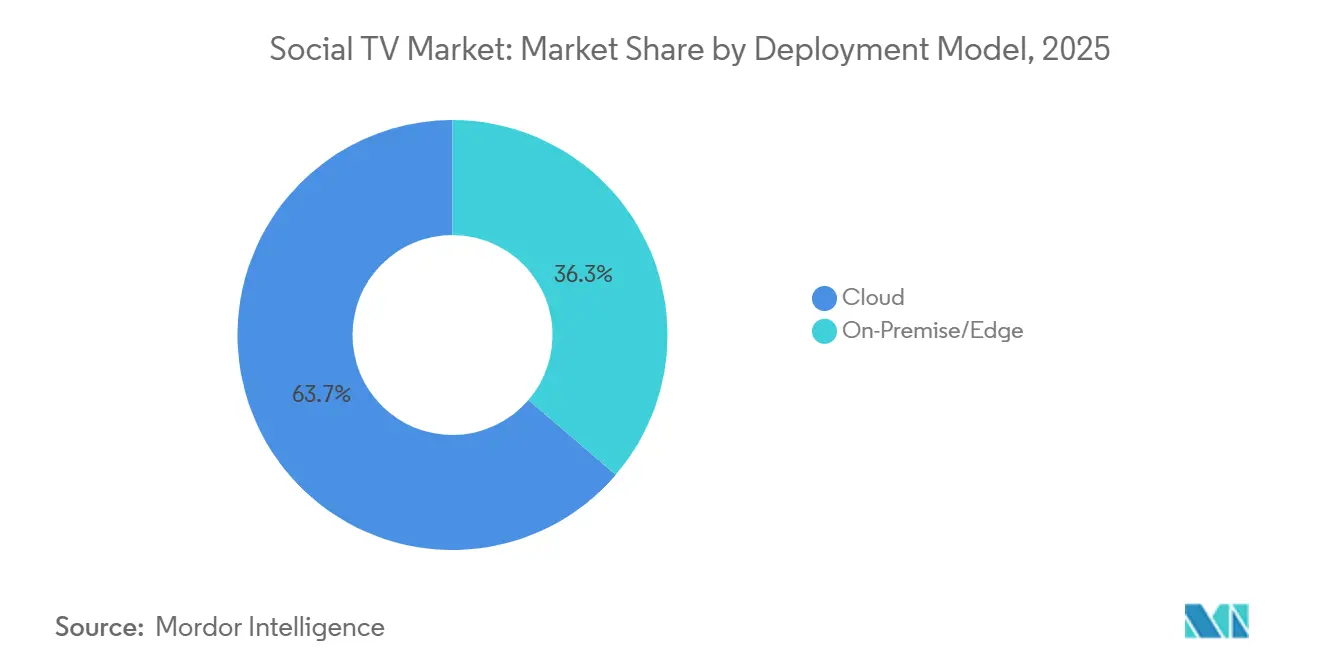
- By deployment model, cloud solutions accounted for 63.73% of 2025 and are expected to grow at a 12.22% CAGR, outpacing niche edge rollouts.
- By end user, OTT and streaming service providers commanded 38.83% of receipts in 2025, yet sports leagues and event owners are set to be the fastest-growing cohort with a 12.39% CAGR.
- By geography, North America represented 34.89% of the social TV market in 2025; Asia-Pacific is projected to log an 12.49% CAGR through 2031.
Note: Market size and forecast figures in this report are generated using Mordor Intelligence’s proprietary estimation framework, updated with the latest available data and insights as of January 2026.
Global Social TV Market Trends and Insights
Drivers Impact Analysis*
| Driver | (~) % Impact on CAGR Forecast | Geographic Relevance | Impact Timeline |
|---|---|---|---|
| AI-Powered Personalized Content Recommendations | +2.1% | Global, advanced in North America and Europe | Medium term (2-4 years) |
| Programmatic CTV Ad-Spend Boom | +2.5% | North America and Europe lead, Asia-Pacific accelerating | Short term (≤ 2 years) |
| 5G-Enabled Synchronous Second-Screen Experiences | +1.4% | Asia-Pacific core, spillover into North America cities | Medium term (2-4 years) |
| Shoppable and Social-Commerce Integrations | +1.8% | North America and Europe, emerging Asia-Pacific | Short term (≤ 2 years) |
| Real-Time Audience Sentiment as a Trading Currency | +1.2% | Global, sports and live events focused | Medium term (2-4 years) |
| Strategic Alliances Between OTT Platforms and Social Networks | +1.6% | Global, notable in North America and Asia-Pacific | Short term (≤ 2 years) |
| Source: Mordor Intelligence | |||
AI-Powered Personalized Content Recommendations
Recommendation engines are shifting from scheduled updates to continuous behavioral modeling that refreshes suggestions in real time, turning discovery into an intent-driven service. Streaming hours devoted to creator-led shows on The Roku Channel climbed almost 80% year over year in 2025, reflecting consumer appetite for authentic narratives. Disney’s agreement to use OpenAI’s Sora for 200 iconic characters shows how generative AI can lower production costs while localizing assets at scale.[1]Roku Advertising, “The Shoppable TV Ad: Shopify + Action Ads,” ADVERTISING.ROKU.COM Yet 58% of viewers report difficulty telling real from synthetic content, nudging 36% of advertisers to shift dollars from social media toward perceived-safer CTV environments. Platforms that couple AI personalization with first-party data are therefore positioned to sustain both user loyalty and advertiser trust.
Programmatic CTV Ad-Spend Boom
Supply-side integrations now let buyers activate campaigns across scattered inventory with a single insertion order, propelling programmatic to an expected 50% of all CTV deals in 2026. Brightcove’s tie-up with Magnite demonstrates how enriched metadata boosts fill rates and clears unsold spots. In Southeast Asia, open programmatic CTV spend jumped 43% year on year in Q1 2025 as 57% of marketers reallocated at least 40% of budgets to connected screens. Despite growth, one quarter of incremental funds move from social and search, creating a creative-asset gap for smaller brands that lack broadcast-quality footage.
5G-Enabled Synchronous Second-Screen Experiences
Latency reductions delivered by 5G permit millisecond-level sync between a primary stream and mobile apps, enabling live polls, trivia, and multi-angle replays without time drift. Sport Buff’s overlays reached 163 million viewers across 156 countries during Eurovision, proving that real-time features keep audiences inside the broadcaster’s ecosystem. Sound Dimension’s AiFi technology even converts phones into perfectly synchronized speakers, pushing engagement metrics such as join time into new sponsorship packages. Adoption, however, clusters in dense urban corridors with reliable 5G rollouts, leaving rural territories on a slower curve.
Shoppable and Social-Commerce Integrations
Embedded checkout flows collapse the gap between inspiration and purchase, turning television into a direct-to-consumer lane. Roku Action Ads linked to Shopify delivered a 40% sales lift for LolaVie and converted 1 in 4 Fatty15 carts. Walmart’s post-acquisition integration of VIZIO OS lets 150 million weekly shoppers sign in once and sync watch behavior with retail baskets. DirecTV’s partnership with Glance shows that AI agents can triple purchase likelihood when product visualization is possible on-screen. Still, these high-ARPU experiences remain most viable in North America and parts of Europe where payment credentials and connected devices are ubiquitous.
Restraints Impact Analysis*
| Restraint | (~) % Impact on CAGR Forecast | Geographic Relevance | Impact Timeline |
|---|---|---|---|
| Tightening Privacy and Data-Usage Regulations | -1.3% | Europe and North America, spillover Asia-Pacific | Long term (≥ 4 years) |
| Fragmented Device and OS Ecosystem | -0.9% | Global, hardware-diverse markets | Medium term (2-4 years) |
| Lack of Unified Cross-Platform Measurement Standards | -0.8% | Global, acute in North America and Europe | Medium term (2-4 years) |
| Low ARPU in Emerging Markets Limits Monetization | -1.1% | Asia-Pacific, Middle East and Africa, South America | Long term (≥ 4 years) |
| Source: Mordor Intelligence | |||
Tightening Privacy and Data-Usage Regulations
GDPR, the California Consumer Privacy Act, and new state-level statutes force platforms to rely on consented data and contextual cues, lifting compliance overheads while shrinking behavioral pools. Divergent global rules further complicate workflows, as South Korea enforces strict opt-in policies while Southeast Asia applies lighter-touch regimes. Advertisers shifting spend into CTV increasingly cite transparency and brand safety as decision filters, so providers that certify against ISO 27001 and similar frameworks gain an edge.
Low ARPU in Emerging Markets Limits Monetization
Large user bases in India, Indonesia, and Brazil translate into robust reach but thin revenue per viewer. JioStar generated INR 8,010 crore (USD 883 million) on 450 million monthly users, underscoring the scale needed to offset small yields. Telco bundles, episodic sports passes, and hybrid ad-plus-micro-payment models are evolving responses, yet rural broadband gaps keep connected-TV penetration in check. AI-driven highlight reels that compress matches into snackable clips could unlock mid-funnel revenue without full-length commitment.
*Our forecasts treat driver/restraint impacts as directional, not additive. The impact forecasts reflect baseline growth, mix effects, and variable interactions.
Segment Analysis
By Component: Analytics Tools Monetize Real-Time Sentiment
Software platforms accounted for 44.19% of 2025 revenue, anchored by content-management suites, recommendation engines, and interactive overlay builders that let broadcasters add polls and live chat without rewiring linear workflows. Talkwalker Social Content Ratings, which absorbs Nielsen’s legacy product, tracks conversations across 172 networks and streaming services, giving programmers a way to prove amplification value to sponsors. The Social TV market share held by analytics tools remains modest today, yet the segment is projected to post a 12.43% CAGR as rights owners translate raw fan chatter into sellable inventory. Platforms fuse natural-language processing with computer vision so that real-time sentiment can influence midroll pricing in under a second. Vendors also bundle tiered dashboards that benchmark performance against competitive shows, a feature that reduces reporting labor for resource-starved local stations.
Leading cloud vendors position analytics modules as add-ons to core playout services, limiting the need for point solutions. Amagi NOW’s AI Artwork Engine, launched in March 2026, cuts asset turnaround times from days to minutes by automatically generating thumbnails for CTV, mobile, and social, fixing a bottleneck that once slowed multichannel release. Early adopters such as YES Network’s Gotham Sports app reported a 38% jump in average unique streams per game after layering sentiment-rich trivia into live baseball. Because advertisers pay premiums for inventory verified by second-screen buzz, analytics tools are becoming central to the social TV market economic stack.


By Application: Commerce Outpaces Community Engagement
Audience engagement and community-building accounted for 35.43% of 2025 spend, driven by watch parties, quiz overlays, and fandom badges that reward streak viewership. Yet commerce and shoppable TV applications are now advancing at a 12.78% CAGR, the highest in the segment hierarchy. Walmart’s VIZIO OS unification lets 150 million weekly shoppers move from discovery to one-click checkout on the living-room screen. Roku Action Ads, paired with Shopify, raised LolaVie's sales by 40% and proved that television can equal cart-conversion rates once exclusive to social feeds. The social TV market size tied to community features still matters because interactive chats extend average viewing time, thereby indirectly boosting ad impressions.
Yet monetization efficiency skews toward commerce experiences that shorten the funnel from inspiration to purchase. NBC Universal data show that shoppable activations boosted engagement by 378% across the portfolio of shows between Q3 2023 and Q4 2024, confirming that retail hooks lift, rather than cannibalize, content retention. Bell Media’s Shopsense AI produces curated storefronts around cooking and sports programs, with 62.7% of viewers discovering at least one new product, evidence that contextual merchandising resonates. As payment credentials proliferate within TV operating systems, the commerce segment is expected to add the largest absolute dollars to the social TV market by 2031.
By Device/Platform: Consoles Deliver Interactive Edge
Smart TVs and connected-TV operating systems accounted for 41.17% of 2025 device revenue, driven by Roku, Samsung, and LG surfacing social widgets on the homescreen. Samsung Ads reached 12 million viewers across seven Southeast Asian countries, with 67% awareness and 74% engagement in higher-income households.[2]Samsung Ads, “Asia-Pacific Reach Metrics,” MISSIONMEDIA.ASIA Despite that scale, gaming consoles exhibit the fastest 12.51% CAGR because PlayStation and Xbox already house microphones, cameras, and controller inputs that make trivia or prediction games friction-free.
Console makers now embed sportsbook widgets that let fans micro-bet on the next pitch or penalty kick without leaving the match, adding a revenue stream absent on most smart-TV operating systems. Amazon’s Prime Vision overlays for NFL broadcasts, which call out likely blitzers, illustrate how low-latency GPU pipelines turn passive viewing into participatory analysis. Mobile second-screen apps remain relevant because 85% of U.S. viewers keep a phone close, yet duplicated reach frustrates advertisers. Cross-device identity graphs from The Trade Desk and Magnite thus gain value, promising brand managers a unified frequency cap across the social TV market.
By Deployment Model: Cloud Scales, Edge Specializes
Cloud architectures held 63.73% of 2025 outlays and should expand at a 12.22% CAGR as live events drive concurrency spikes that only elastic compute can absorb. Brightcove data show millions of unfilled ad requests have now been recovered after migrating to Magnite’s SpringServe server-side ad insertion, underscoring efficiency gains. Edge deployments remain niche, tackling latency-sensitive jobs like synchronized audio or live betting where round-trip penalties hurt experience.
Operators blend both layers into hybrid blueprints: the cloud stores long-tail assets and runs AI recommendation engines, while regional edge nodes handle frame-accurate overlays during Champions League matches. This division trims transit costs and boosts reliability, elements critical to sustaining advertiser confidence in the broader social TV market. Hybrid architectures are emerging, where machine-learning inference runs at the edge while heavy model training stays in centralized clouds.
By End User: Sports Leagues Lead Growth Curve
OTT platforms captured 38.83% of 2025 revenue, benefiting from direct customer relationships that de-risk dependence on third-party networks. Yet sports leagues and event owners headline growth with a 12.39% CAGR as they shift from wholesale media rights to direct-to-fan models. Major League Baseball’s TikTok expansion sparked a 76% surge in postseason social views to 2 billion, proof that creator partnerships unlock fresh demos.
Rights holders now measure success not only by reach but also by the share of spectators converted into traceable profiles, a metric ranging from 1% to 60% for top properties. Leagues launch loyalty apps that offer highlights, merchandise, and betting slips in a single wallet, capturing zero-party data that feeds dynamic ad segmentation. Robust performance here directly boosts the overall social TV market, as premium sports command the deepest cost-per-thousand impressions in streaming.
Geography Analysis
North America retained 34.89% of 2025 revenue, buoyed by high ARPU and mature programmatic rails. Connected-TV ad spend is projected to hit about USD 38 billion in 2026, up 13.8% year over year, with 70% of advertisers lifting budgets by 17% on average. Commerce integrations such as Walmart’s VIZIO OS single-sign-on already link streaming exposure to in-store sales, boosting incremental reach for brands like Cafe Bustelo by 98%. Widespread 5G helps synchronize second-screen augmentations across large-scale sports broadcasts.
Europe shows parallel infrastructure yet operates under stiffer privacy rules. GDPR clauses that restrict behavioral retargeting push platforms to invest in contextual engines, adding cost but also creating a quality moat. Joint Industry Committee standards move slowly, leaving buyers to juggle multiple measurement currencies, a pain point restraining spend velocity across the region. Southeast Asian audiences prefer domestic storylines, pushing regional OTTs to weave social features around culturally relevant IP.
Asia-Pacific, forecast to climb at a 12.49% CAGR to 2031, will add almost 100 million connected-TV households outside China, led by India and Japan.[3]Asia-Pacific Video Revenue to Reach USD 196 Billion by 2030,” HOLLYWOODREPORTER.COM Open programmatic spend in Southeast Asia jumped 43% year on year in Q1 2025, signaling that demand-side platforms are closing fragmentation gaps. South America and the Middle East and Africa wrestle with low ARPU, pushing telco-bundled micro-subscriptions as stopgaps. Still, marquee football and cricket fixtures generate CPMs two to five times above entertainment baselines, ensuring that high-value live windows continue to move the social TV market needle in emerging regions.

Competitive Landscape
The social TV market remains moderately concentrated: the top 15 online-video platforms accounted for 58% of 2025 revenue, with YouTube, ByteDance, and Netflix leading the way. Tubi’s share of ad-supported streaming grew from 2.2% in May 2025 to 6.2% in Q4 the same year after embracing creator-driven formats. Ad-tech specialist The Trade Desk leverages its Ventura OS to capture budget reallocated from linear TV, partnering with Disney and Paramount to create standardized pipes for targeted buys.
Walmart’s VIZIO takeover couples CTV ad reach with closed-loop retail data, driving 65% product discovery rates in early campaigns. TiVo’s knowledge graph integrates social buzz into metadata, enabling operators to surface personalized carousels that boost sponsored-content click-throughs.[4]Walmart, VIZIO Unveil Content-to-Commerce Integrations,” THESHELBYREPORT.COM Independent sell-side exchanges such as Magnite court publishers seeking alternatives to walled gardens, while The Trade Desk consolidates demand, promising deduplicated frequency across the social TV market.
Emerging disruptors focus on AI agents that clip highlight reels, auto-translate subtitles, and even predict next-best-offers. Sixty-six percent of media buyers now prioritize platforms that merge content, commerce, and measurement into one workflow, a benchmark that tilts favor toward ecosystems able to demonstrate incremental yield on every impression. Remaining fragmentation across devices and privacy frameworks ensures ongoing jockeying for share but also preserves room for niche innovators.
Social TV Industry Leaders
Brightcove Inc.
Kaltura Inc.
Khoros LLC
Conviva Inc.
Grabyo Ltd.
- *Disclaimer: Major Players sorted in no particular order

Recent Industry Developments
- March 2026: Amagi introduced an AI Artwork Generation module inside Amagi NOW, slashing thumbnail-production time from days to minutes.
- March 2026: Walmart and VIZIO rolled out unified account login on VIZIO OS and onn TVs, creating a retail identity pipe tied to 150 million weekly shoppers.
- March 2026: Major League Baseball deepened its TikTok deal and invested in Jomboy Media, generating 2 billion postseason views, up 76% year on year.
- December 2025: DirecTV partnered with Glance to embed AI-powered shopping on Gemini hardware, with users spending 120 minutes daily in the experience.


Global Social TV Market Report Scope
The Social TV Market encompasses platforms, applications, and technologies that enable viewers to interact with television content in real time via social media and other digital channels. This market focuses on enhancing audience engagement by integrating social networking features with traditional TV viewing experiences, thereby creating a more interactive and connected entertainment ecosystem.
The Social TV Market Report is Segmented by Component (Software, Services, and Hardware), Application (Audience Engagement, Commerce, Advertising, Content Discovery, and Gaming), Device and Platform (Smart TVs, Gaming Consoles, Mobile Apps, Streaming Players, and Web Browsers), Deployment Model (Cloud, On-Premise, and Edge), End User (OTT Providers, Sports Leagues, Broadcasters, Advertisers, and Content Studios), and Geography (North America, Europe, Asia-Pacific, Middle East and Africa, and South America). The Market Forecasts are Provided in Terms of Value (USD).
| Software Platforms |
| Services |
| Hardware / Smart-TV Solutions |
| Social TV Analytics Tools |
| Audience Engagement and Community Building |
| Targeted Advertising and Sponsorship |
| Content Discovery and Recommendations |
| Social Gaming / Interactive Programming |
| Commerce and Shoppable TV |
| Smart TVs and Connected-TV OS |
| Mobile and Tablet Second-Screen Apps |
| Streaming Media Players and Set-Top Boxes |
| Web Browser Interfaces |
| Gaming Consoles |
| Cloud |
| On-Premise / Edge |
| Broadcasters and Pay-TV Operators |
| OTT and Streaming Service Providers |
| Advertisers and Brands |
| Content Production Studios |
| Sports Leagues and Event Owners |
| North America | United States | |
| Canada | ||
| Mexico | ||
| Europe | Germany | |
| United Kingdom | ||
| France | ||
| Russia | ||
| Rest of Europe | ||
| Asia-Pacific | China | |
| Japan | ||
| India | ||
| South Korea | ||
| Australia | ||
| Rest of Asia-Pacific | ||
| Middle East and Africa | Middle East | Saudi Arabia |
| United Arab Emirates | ||
| Rest of Middle East | ||
| Africa | South Africa | |
| Egypt | ||
| Rest of Africa | ||
| South America | Brazil | |
| Argentina | ||
| Rest of South America | ||
| By Component | Software Platforms | ||
| Services | |||
| Hardware / Smart-TV Solutions | |||
| Social TV Analytics Tools | |||
| By Application | Audience Engagement and Community Building | ||
| Targeted Advertising and Sponsorship | |||
| Content Discovery and Recommendations | |||
| Social Gaming / Interactive Programming | |||
| Commerce and Shoppable TV | |||
| By Device / Platform | Smart TVs and Connected-TV OS | ||
| Mobile and Tablet Second-Screen Apps | |||
| Streaming Media Players and Set-Top Boxes | |||
| Web Browser Interfaces | |||
| Gaming Consoles | |||
| By Deployment Model | Cloud | ||
| On-Premise / Edge | |||
| By End User | Broadcasters and Pay-TV Operators | ||
| OTT and Streaming Service Providers | |||
| Advertisers and Brands | |||
| Content Production Studios | |||
| Sports Leagues and Event Owners | |||
| By Geography | North America | United States | |
| Canada | |||
| Mexico | |||
| Europe | Germany | ||
| United Kingdom | |||
| France | |||
| Russia | |||
| Rest of Europe | |||
| Asia-Pacific | China | ||
| Japan | |||
| India | |||
| South Korea | |||
| Australia | |||
| Rest of Asia-Pacific | |||
| Middle East and Africa | Middle East | Saudi Arabia | |
| United Arab Emirates | |||
| Rest of Middle East | |||
| Africa | South Africa | ||
| Egypt | |||
| Rest of Africa | |||
| South America | Brazil | ||
| Argentina | |||
| Rest of South America | |||


Key Questions Answered in the Report
What is the current Social TV market size and its projected growth?
The Social TV market size reached USD 5.53 billion in 2026 and is forecast to climb to USD 9.58 billion by 2031, registering an 11.61% CAGR over 2026-2031.
Which application will grow quickly within Social TV?
Commerce and shoppable TV applications are projected to expand at a 12.78% CAGR through 2031 as integrated checkout shortens the path from viewing to purchase.
Why are gaming consoles important to Social TV adoption?
Consoles combine low-latency hardware with built-in controllers, letting broadcasters embed live chat, trivia, and betting, which drives the fastest 12.51% CAGR among device platforms.
How do privacy regulations affect monetization?
GDPR and CCPA force platforms to rebuild ad engines around first party and contextual data, trimming targeting pools but improving brand safety, which sustains advertiser trust despite higher compliance costs.
Which region offers the strongest near-term upside?
Asia-Pacific shows a 12.49% forecast CAGR and will add roughly 100 million connected-TV households by 2030, driven by India and Japan adopting ad-supported streaming at scale.
What strategic moves define current competition?
Vertical integration dominates: Walmart links VIZIO screens to retail data, while Tubi partners with TikTok creators, illustrating how content, commerce, and measurement now converge on single platforms.
Page last updated on:


