Fortified Rice Market Size and Share
Market Overview
| Study Period | 2021 - 2031 |
|---|---|
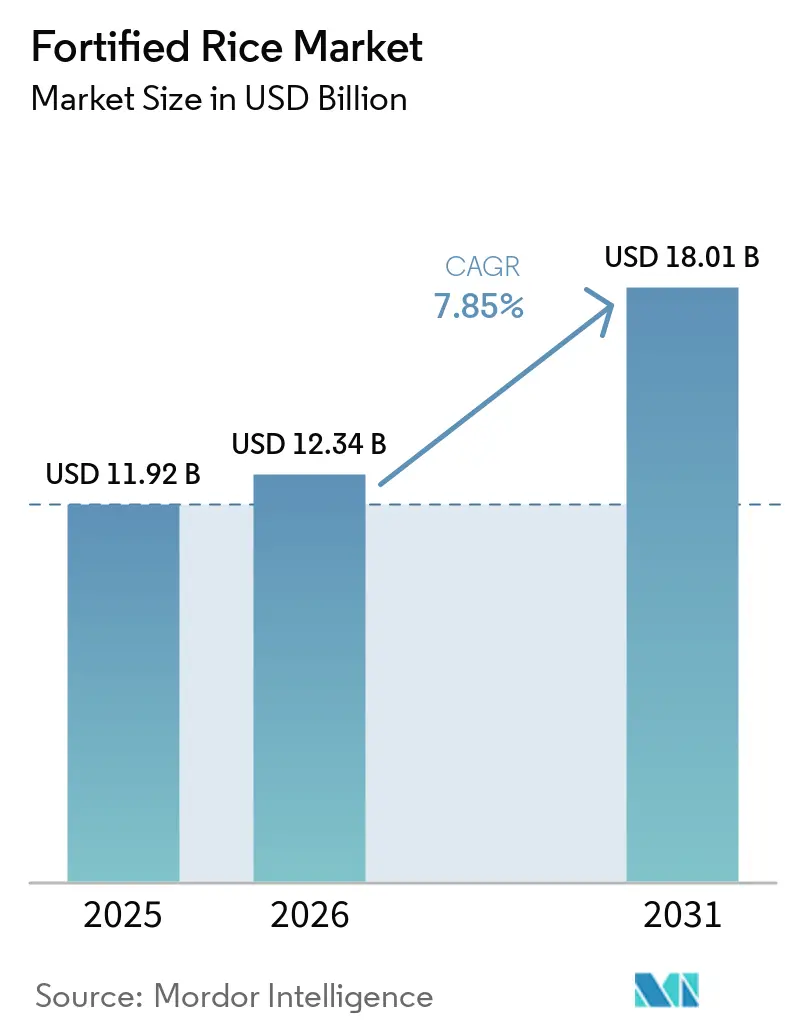
| Market Size (2026) | USD 12.34 Billion |
| Market Size (2031) | USD 18.01 Billion |
| Growth Rate (2026 - 2031) | 7.85% CAGR |
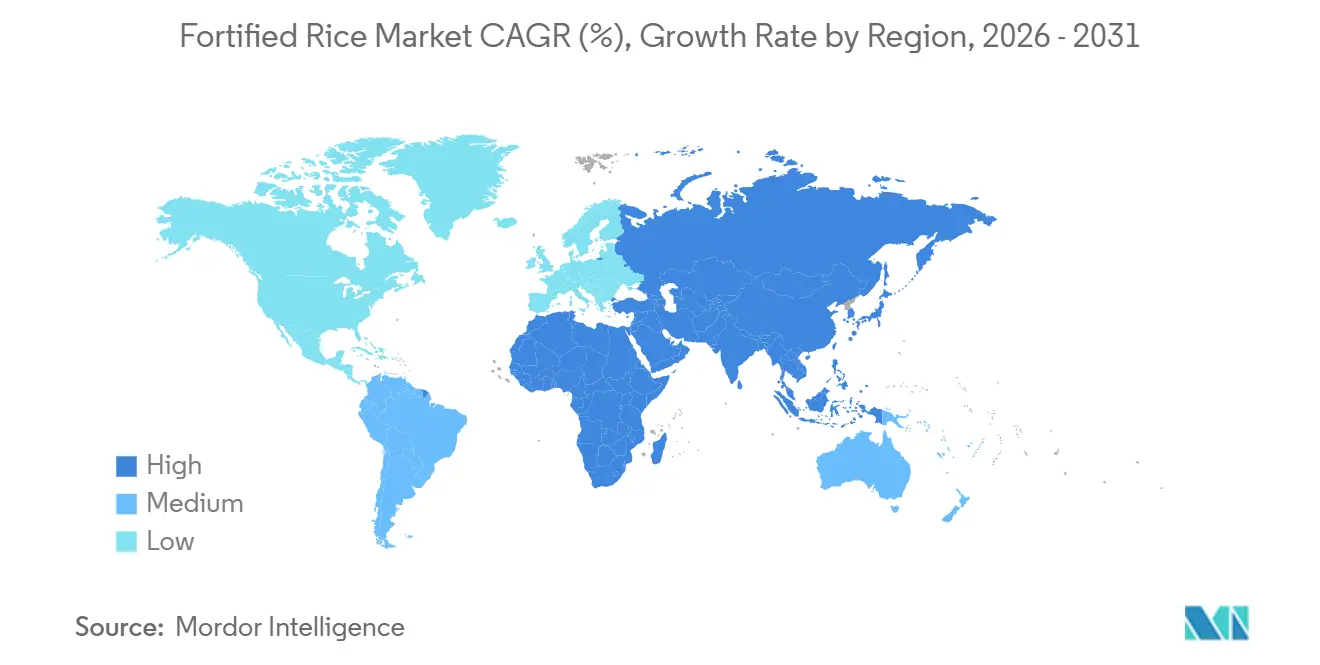
| Fastest Growing Market | Middle East and Africa |
| Largest Market | Asia-Pacific |
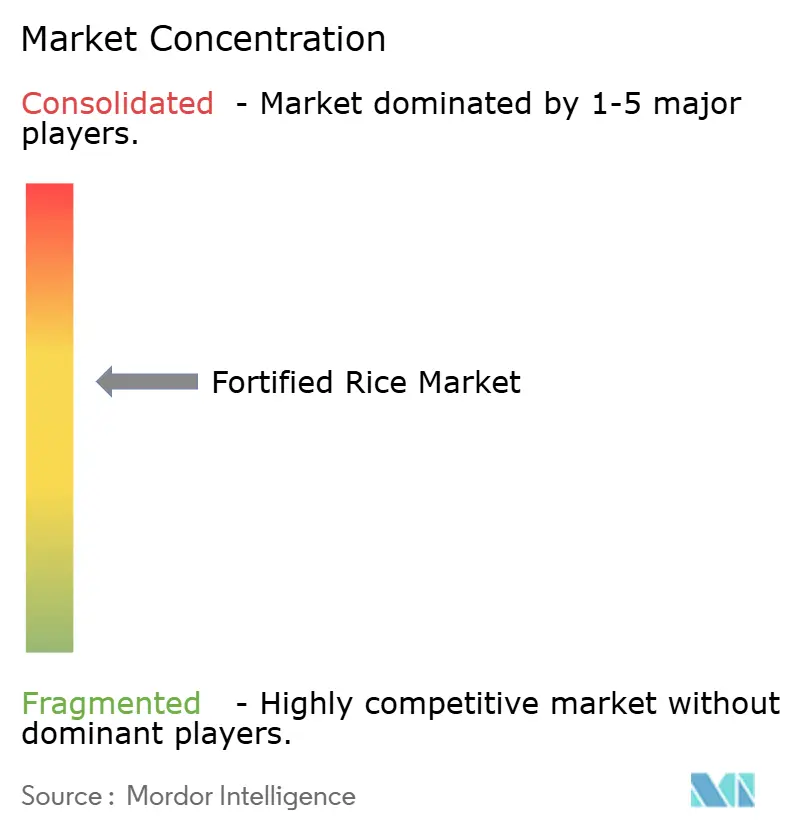
| Market Concentration | Medium |
Major Players *Disclaimer: Major Players sorted in no particular order Image © Mordor Intelligence. Reuse requires attribution under CC BY 4.0. | |
Fortified Rice Market Analysis by Mordor Intelligence
The fortified rice market size is expected to increase from USD 11.92 billion in 2025 to USD 12.34 billion in 2026 and reach USD 18.01 billion by 2031, growing at a CAGR of 7.85% over 2026-2031. In regions like Asia-Pacific, Latin America, and West Africa, government mandates are driving volume growth. Simultaneously, demand from humanitarian efforts and school-feeding programs provides a stable institutional demand, cushioning the market against retail fluctuations. Technological advancements in extrusion and micro-encapsulation are ensuring vitamin retention during cooking, enhancing consumer trust in markets accustomed to rinsing. While still a niche, organic and biofortified rice offerings are gaining traction, thanks to e-commerce platforms and premium grocery chains, especially among urban consumers prioritizing ingredient transparency. Collectively, these dynamics are propelling the fortified rice market's growth, even in traditionally price-sensitive regions.
Key Report Takeaways
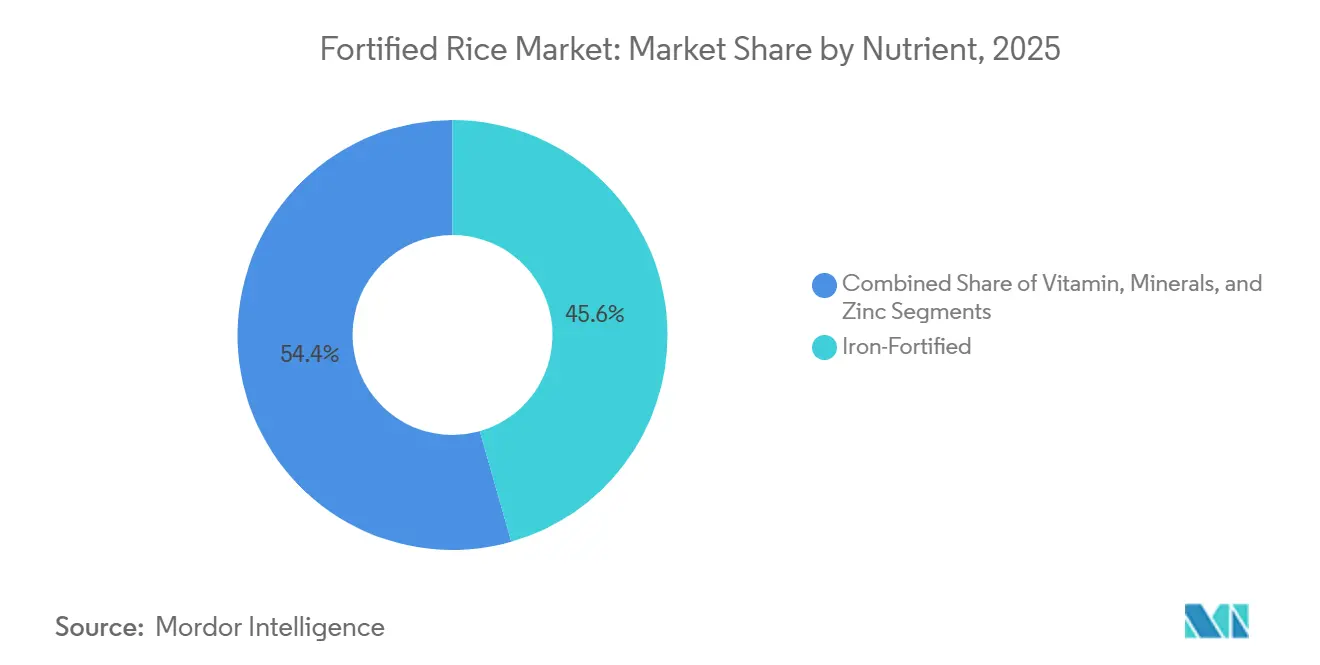
- By nutrient, iron-fortified rice led with 45.59% of fortified rice market share in 2025, while vitamin-fortified variants are projected to post the fastest 8.08% CAGR through 2031.
- By category, conventional products held 93.69% of the fortified rice market in 2025; organic fortified rice will advance at a market-leading 9.17% CAGR to 2031.
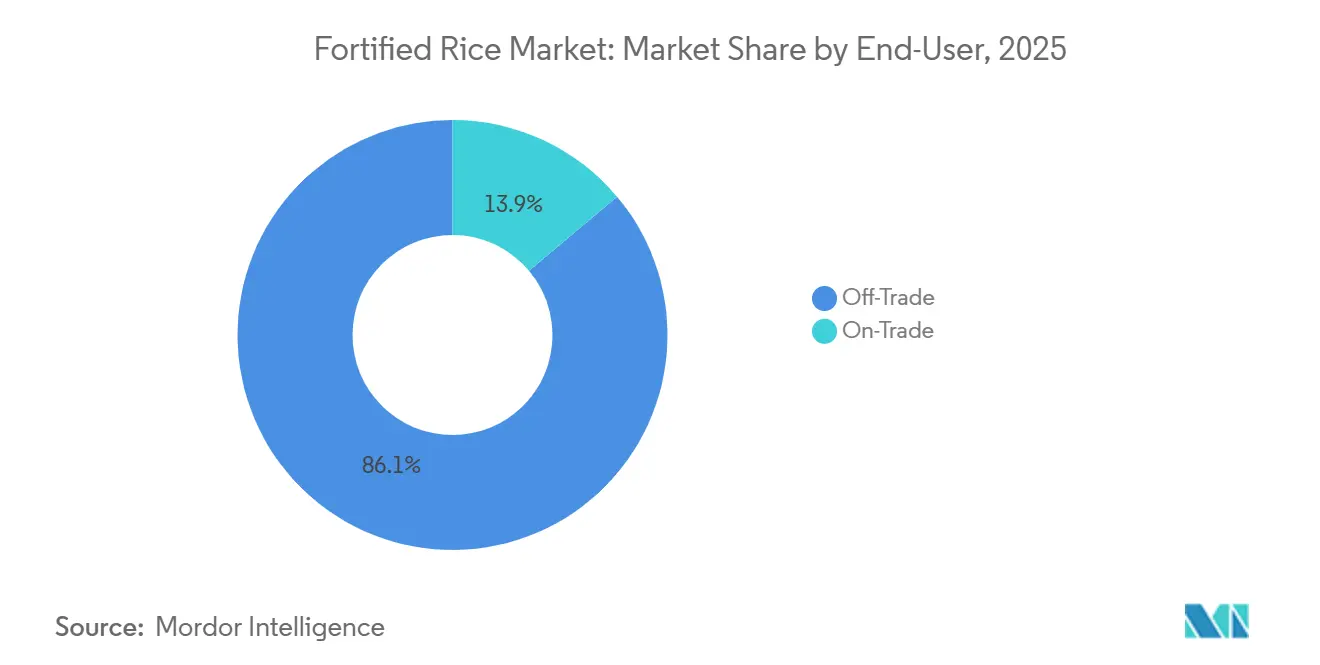
- By end user, off-trade retail captured 86.12% of sales in 2025, whereas on-trade institutional channels are projected to expand at an 8.91% CAGR through 2031.
- By geography, Asia-Pacific commanded 58.40% revenue in 2025, and the Middle East & Africa segment is forecast to record the highest 8.92% CAGR by 2031.
Note: Market size and forecast figures in this report are generated using Mordor Intelligence’s proprietary estimation framework, updated with the latest available data and insights as of January 2026.
Global Fortified Rice Market Trends and Insights
Drivers Impact Analysis*
| Driver | (~) % Impact on CAGR Forecast | Geographic Relevance | Impact Timeline |
|---|---|---|---|
| Technological innovation in extrusion and fortification methods | +1.2% | Global, with early adoption in Asia-Pacific (India, Bangladesh, Philippines) and Latin America (Colombia, Costa Rica) | Medium term (2-4 years) |
| Rising global awareness of nutritional deficiencies | +1.5% | Global, concentrated in South Asia, Sub-Saharan Africa, and Latin America, where anemia prevalence exceeds 30% in women and children | Long term (≥ 4 years) |
| Advances in hot/cold extrusion and micro-encapsulation technologies | +0.9% | Asia-Pacific and Middle East & Africa, spill-over to Latin America | Medium term (2-4 years) |
| Increasing public-private partnerships and collaboration | +1.1% | Asia-Pacific (India, Bangladesh, Indonesia, Nepal, Laos, Cambodia), Sub-Saharan Africa (Nigeria, Ghana, Senegal, Kenya), Latin America (Guatemala) | Short term (≤ 2 years) |
| Blockchain/QR traceability boosts institutional procurement confidence | +0.6% | Europe (Portugal TRACE-RICE), Asia-Pacific (Philippines cacao pilot transferable to rice), North America (U.S. institutional buyers) | Long term (≥ 4 years) |
| Climate-driven humanitarian demand for shelf-stable fortified staples | +0.8% | Global, with acute need in climate-vulnerable regions: Sub-Saharan Africa, South Asia, Central America | Medium term (2-4 years) |
| Source: Mordor Intelligence | |||
Technological Innovation in Extrusion and Fortification Methods
In the realm of rice fortification, hot and cold extrusion stand as two distinct approaches, each tailored to specific supply-chain challenges. Hot extrusion harnesses heat, pressure, and shear to transform broken rice flour, infused with micronutrient premixes, into resilient kernels. These kernels endure multiple washes and maintain 60% to 80% levels of essential nutrients like iron, zinc, folic acid, and B vitamins even after cooking[1]Source: World Food Programme, “Fortified Staples Procurement Report 2026,” wfp.org. On the other hand, cold extrusion sidesteps the thermal degradation of sensitive vitamins. Blending fortificants with binders at room temperature, it produces kernels. However, these kernels are less mechanically robust and tend to disintegrate more during cooking. This limitation poses challenges in markets where consumers typically rinse rice several times before cooking. A 2025 study in Bangladesh highlighted the preference, with 88% of consumers favoring hot-extruded rice over 71% for its cold counterpart, primarily due to its closer texture and color to unfortified rice. DSM-Firmenich's hot-extrusion technology has made its mark, operating in eight countries with mandatory fortification. Notably, six states in the U.S. and Costa Rica have seen a drop in neural tube defect rates since the 2001 introduction of their fortified rice. This rice, enriched with vitamins B1, B3, B12, E, folic acid, selenium, and zinc, showcases the potential of such fortification efforts. To further enhance stability, micro-encapsulation techniques like spray drying and 3-fluid nozzle systems are employed. These methods coat individual micronutrient particles with lipid or polysaccharide shells, curbing oxidation and off-flavors in iron-fortified rice. Yet, the high capital costs of spray-drying equipment pose a challenge, especially for small and medium mills in regions like Indonesia and Sub-Saharan Africa.
Rising Global Awareness of Nutritional Deficiencies
In Indonesia, anemia affects 32% of adolescents, 39% of children under five, and nearly 50% of pregnant women. Meanwhile, Nigeria's Demographic and Health Survey highlights a stunting prevalence of nearly 40% among its children[2]Source: PATH & GAIN, “Quality Control Toolkit for Fortified Rice 2025,” gainhealth.org. A systematic review by Cochrane, analyzing 17 randomized controlled trials, found that fortified rice can cut iron deficiency rates by 35% in low- and middle-income nations. This finding aligns with the World Health Organization's 2018 recommendation to fortify staples, especially rice, with iron, zinc, folic acid, and vitamin A. In Peru, rice is a staple, with the Ministry of Health noting a national average consumption of 140 grams per person daily, and 36 grams daily for children aged 12 to 36 months. This makes rice not only the most consumed food but also a prime candidate for fortification under Law No. 31348, according to Ministerio de Salud, Perú. However, climate change poses challenges: elevated atmospheric CO₂ concentrations can reduce rice's B vitamin content by 17% to 30%. This underscores the importance of fortification as a strategy to counteract declining agronomic yields and nutrient density. The World Food Program has set a goal to source 60% to 80% of its staples as fortified by 2025. This ambition is already influencing institutional procurement in Bangladesh, where fortified rice benefits over 13 million individuals, and in Cambodia, where a collaboration with Japan and WFP is set to provide fortified rice to factory workers by March 2026.
Advances in Hot/Cold Extrusion and Micro-Encapsulation Technologies
Ferric pyrophosphate and sodium iron ethylenediaminetetraacetate (NaFeEDTA) lead the way in iron fortification premixes. They effectively reduce color changes and metallic off-flavors. However, NaFeEDTA stands out: its chelating properties boost iron bioavailability by 2 to 3 times compared to ferric pyrophosphate, especially in rice matrices rich in phytates. A 2024 study in Ghana revealed that women of reproductive age saw an 18% increase in serum ferritin over 6 months with NaFeEDTA-fortified rice. In contrast, those consuming ferric pyrophosphate formulations experienced only a 9% boost. This highlights the delicate balance between cost and efficacy. Micro-encapsulation offers a solution to this dilemma. By encasing reactive iron compounds in protective matrices, it allows for the use of more affordable ferrous sulfate without the downsides of rancidity or discoloration. A 2025 study showcased a method where a 3-fluid nozzle spray dried ferrous sulfate in maltodextrin-gum arabic shells. This technique achieved an impressive 85% retention after a year at 30°C and 75% humidity, potentially countering India's rationale for discontinuation in February 2026. Cold extrusion sidesteps thermal stress, safeguarding vitamins A and thiamine from degradation at temperatures over 80°C. Yet, this method's dependence on binders like carboxymethyl cellulose bumps production costs by USD 10 to USD 15 per metric ton compared to hot extrusion, posing challenges in price-sensitive markets. In 2024, PATH and the Global Alliance for Improved Nutrition rolled out a quality-control toolkit. This toolkit delineates acceptable ranges for fortificant kernel hardness, dissolution time, and micronutrient uniformity. These benchmarks empower mills to avert clumping and off-odors, bolstering consumer acceptance.
Increasing Public-Private Partnerships and Collaboration
India's August 2025 agreement with the World Food Programme (WFP) to supply 200,000 metric tons of fortified rice for Asia and Africa marked the largest government-to-multilateral commitment. However, its February 2026 suspension due to shelf-life and quality concerns highlights risks in rapid scaling without robust quality checks. In March 2025, Laos launched a USD 1 million India-UN partnership to integrate fortified rice into school feeding, while Cambodia's March 2026 Japan-WFP initiative allocated USD 1.5 million for fortified rice for factory workers, showcasing South-South cooperation. Senegal's October 2024 partnership with WFP and DSM-Firmenich introduced fortified rice into school feeding, and Ghana's 2024-2026 pilot with WFP and the UK Foreign, Commonwealth & Development Office trained millers to produce fortified rice locally. Cargill's September 2024 USD 3 million NutriHarvest project with HarvestPlus targeted 119,000 farmers in India, Kenya, Tanzania, and Guatemala, focusing on biofortified crops and poultry capacity-building to reduce single-commodity risks. Indonesia's National Food Agency Regulation No. 9/2025 set a 2029 target for 100% fortified food-assistance rice, but TechnoServe and Nutrition International report mills lack financial incentives without subsidies or procurement mandates.
Restraints Impact Analysis*
| Restraint | (~) % Impact on CAGR Forecast | Geographic Relevance | Impact Timeline |
|---|---|---|---|
| Sensory and cooking-loss concerns | -0.7% | Asia-Pacific (India, Bangladesh, Philippines), Sub-Saharan Africa (Nigeria, Ghana), Latin America (Colombia) | Short term (≤ 2 years) |
| Cost pass-through resistance in price-sensitive regions | -0.9% | South Asia (India, Bangladesh, Indonesia), Sub-Saharan Africa, Latin America | Medium term (2-4 years) |
| Activist push-back on synthetic premix additives | -0.4% | Europe, North America, Latin America (Colombia organic exemption), select urban markets in Asia | Long term (≥ 4 years) |
| Supply-chain opacity for micronutrient quality verification | -0.3% | Sub-Saharan Africa, South Asia, Latin America (fragmented mill sectors) | Medium term (2-4 years) |
| Source: Mordor Intelligence | |||
Sensory and Cooking-Loss Concerns
India's February 2026 decision to stop fortified rice distribution through the Public Distribution System, Integrated Child Development Services, and PM POSHAN programs was due to shelf-life issues and consumer complaints about color, texture, and odor. This policy shift affects the world's largest rice-consuming nation and underscores the risks of quality-control failures. Consumer acceptance studies in Bangladesh, Cambodia, India, and the Philippines show 71% to 94% acceptance rates but note sensory deviations, especially when fortificant kernels exceed 2% or ferric compounds oxidize during storage. Vitamin A losses of 10%-20% during washing and 20%-30% during cooking, along with folic acid losses of 20%-40%, require over-fortification by 30%-50%, raising costs and risks of exceeding tolerable limits in populations consuming multiple fortified staples. A 2024 Cambodian study found kernels stored at 30°C and 75% humidity retained only 65% of vitamin A after 12 months, compared to 90% for iron and zinc, highlighting the need for climate-controlled storage in tropical markets. PATH and GAIN's toolkit specifies dissolution times of 15-25 minutes for extruded kernels and hardness values within 10% of unfortified rice to prevent clumping and stickiness, but most Indonesian mills lack the lab capacity for these tests.
Cost Pass-Through Resistance in Price-Sensitive Regions
In Colombia, production costs rise due to hot extrusion and an additional increase in coating costs. These premiums lead to retail price hikes in Colombia and under 1% in Cambodia. However, even these slight cost increases can dampen demand in regions where rice accounts for 50% to 70% of household food spending. In Indonesia, fortified rice kernels priced at IDR 500 to IDR 1,000 per kilogram command a 5% to 10% premium over their unfortified counterparts. This margin poses a challenge for small mills, which can only navigate it with subsidies or assured contracts from institutions. While Colombia's Decree 380 notes a 0.3% to 2.5% rise in producer costs, it lacks a defined enforcement timeline or support mechanisms. This oversight is critical given that Colombia's food sector is a mosaic of thousands of small and mid-sized producers, heightening the chances of non-compliance or a drift to the informal market. In Cambodia, studies on consumer behavior revealed that 78% of participants were open to paying a premium for fortified rice. Yet, when faced with cheaper unfortified options, actual purchases didn't align with these preferences. This discrepancy can be bridged by mandatory fortification, a feat voluntary programs struggle to achieve. In Ghana, Nigeria, and Indonesia, small mills pinpoint capital expenses ranging from USD 50,000 to USD 150,000 for essential equipment and facilities as their main entry hurdle. Initiatives like Ghana's WFP-FCDO miller training program, through public-private partnerships, seek to mitigate this challenge by offering technical support and shared resources.
*Our forecasts treat driver/restraint impacts as directional, not additive. The impact forecasts reflect baseline growth, mix effects, and variable interactions.
Segment Analysis
By Nutrient: Iron Dominance Drives Market Leadership
In 2025, iron-fortified products commanded a dominant 45.59% share of the fortified rice market, coinciding with global anemia rates of 30.7% in women and 39.8% in young children. This stronghold is bolstered by bulk purchases from India, the Philippines, and humanitarian agencies, all of which emphasize the importance of hemoglobin restoration. As more low- and middle-income nations begin to incorporate iron into their essential food offerings, the market for iron-fortified rice is set to expand. Policymakers are further reassured by meta-analysis findings showcasing a 0.53 g/dl increase in hemoglobin levels among consumers. Additionally, there's a growing interest in complementary mineral blends, particularly zinc, in regions where both soil and dietary zinc levels are deficient, hinting at a lucrative co-fortification opportunity.
Rice fortified with vitamins, especially combinations of vitamin A and folate, is witnessing the fastest growth, boasting a 8.08% CAGR projected through 2031. Heightened public awareness about the dangers of vitamin A deficiency, affecting 250 million preschoolers, has catalyzed its inclusion in various programs[3]World Health Organization, “Micronutrients Portal,” platform.who.int. Advances in encapsulation technology now allow for the retention of lipid-soluble vitamin D, enhancing rice's role as a carrier for a wider array of micronutrients. Corporate confidence in this trend is evident with brand launches like Tata Tea Gold Vita Care, emphasizing fortified offerings across categories. Furthermore, regulatory movements in Nigeria and Egypt hint at impending mandates for multi-nutrient fortification, broadening the potential market for fortified rice.


By Category: Conventional Supremacy Faces Organic Disruption
In 2025, conventional formats dominated the fortified rice market, capturing a substantial 93.69% share. This stronghold is largely attributed to the alignment of low-cost mass production with public nutrition objectives. Leveraging the advantages of large-scale mills equipped with kernel blending, the conventional segment efficiently caters to 400 million beneficiaries of India's Public Distribution System. Humanitarian agencies favor these conventional kernels, as they not only meet the stringent nutrient profiles set by the USDA but also remain competitively priced.
On the other hand, organic fortified rice is set to experience a robust 9.17% CAGR. This growth is buoyed by a trend of premiumization in North America and Europe, where consumers are increasingly willing to pay a premium for chemical-free products. However, certifiers impose a challenge: they mandate the use of natural sources for vitamins and minerals, complicating the formulation process. Meanwhile, biofortification, an innovative genetic approach that enhances intrinsic iron and zinc levels, offers a compliant solution for organic standards, with HarvestPlus leading the charge. Additionally, while emerging e-commerce platforms provide niche brands a foothold among health-conscious urban consumers, their overall volume remains modest in the broader fortified rice landscape.
By End-User: Off-Trade Channels Leverage Distribution Scale
In 2025, off-trade outlets, from supermarkets to subsidy shops, drove 86.12% of turnover. This surge was fueled by state procurement and modern retail's educational displays. These displays, featuring shelf-talkers that highlight micronutrient benefits, play a pivotal role in encouraging repeat purchases. Bulk tonnage is largely influenced by government tenders. For instance, India secured tens of millions of tons for its social-safety nets, cementing long-term vendor contracts in the process. Meanwhile, digital grocery platforms in China and Indonesia are amplifying market penetration by showcasing clear nutrient dashboards online, thus adding incremental volumes to the fortified rice market.
On-trade usage is set to grow at a CAGR of 8.91%, driven by schools, hospitals, and corporate canteens formalizing nutrition guidelines. Highlighting this trend, Peru's school-feeding program, catering to 2.4 million pupils, underscores institutional momentum. Similarly, the BARMM initiative in the Philippines, which provides fortified iron rice to 69 schools, emphasizes policy backing for regional feeding schemes. Beyond educational institutions, healthcare facilities are incorporating fortified rice into anemia therapy diets. Furthermore, driven by ESG principles, corporations are introducing fortified dishes in staff cafeterias, expanding the fortified rice market's reach.
Geography Analysis
Asia-Pacific continued to dominate with a 58.40% share of the fortified rice market in 2025, reflecting deep cultural reliance on rice and multilayered government action. India's network of 21,000 fortified-capable mills creates an annual kernel capacity of 111 LMT, far above the present offtake, assuring scalability for private labels. Bangladesh's VGD program, covering more than 13 million recipients, verified anemia falls of 4.8% and zinc reductions of 6% after the fortified rice rollout. The Philippines' Republic Act 8976 mandates iron fortification, yet current blending hovers near 5% of the national supply, implying significant upside as machinery grants from Japan come online. Regional cooperation under ASEAN accelerates harmonized labeling, smoothing fortified rice market trade flows.
The Middle East and Africa exhibit the fastest 8.92% CAGR outlook as fortification moves from wheat-centric to rice-inclusive staples. Egypt's 2025 revival of flour fortification across 13 governorates signals renewed commitment to micronutrient policy. Nigeria's decision to officially list rice as a fortifiable food adds a sizable consumer base of over 200 million. Oman's folic-acid program cut neural tube defects by 80%, offering a blueprint for broader micronutrient mandates. Humanitarian partners identify 12 additional African countries where fortified rice could improve nutrition for 146 million residents.
North America, Europe and South America remain mature yet opportunity persists in premium organic and multi-nutrient lines. Regulatory convergence on fortification specs simplifies cross-border shipments, while CSR-driven institutional demand, such as corporate wellness menus, adds incremental tonnage. E-commerce plays a growing role in these high-income areas, letting small brands market functional rice blends with transparent micronutrient dashboards, supporting fortified rice market diversification.

Competitive Landscape
Competitive intensity stands at a moderate level, indicating that leading players command a significant, albeit not dominant, market share. The fortified rice market is marked by strategic innovation and sustainability initiatives among key players. Olam Group leads with a strong emphasis on value chain traceability, scalable rice processing, and regionally tailored fortified rice solutions for public health and institutional buyers, leveraging digitalization and partnerships to enhance quality and availability. Oliria Foods & Beverages focuses on fortification technologies that address local nutritional deficiencies, emphasizing affordable nutrition and micronutrient-rich rice variants.
Quality accreditation poses a significant barrier to entry. GAIN’s supplier registry highlights a mere 44 compliant premix manufacturers globally, bestowing a trust advantage to established players. Leaders further distinguish themselves through robust intellectual-property portfolios, particularly in nutrient encapsulation and in-line spectroscopic testing. While new entrants explore organic and biofortified niches, they grapple with sourcing and certification challenges, hindering their scalability.
Market players are increasingly pursuing vertical integration, intertwining premix production, equipment, and distribution. This strategy not only amplifies their value capture but also ensures alignment with shifting national standards. Given the region's promising CAGR, geographic expansion into MEA tops the agenda. Simultaneously, there's a push towards diversifying product lines, especially into multi-nutrient blends, aligning with institutional feeding mandates. As ESG considerations gain traction, companies are spotlighting their fortified-rice tonnage in “S” disclosures. This not only underscores their compliance achievements but also crafts compelling investor narratives, bolstering premium valuations in the fortified rice arena.
Fortified Rice Industry Leaders
Olam Group
Oliria Foods & Beverages Limited
McCormick & Company, Incorporated
Ebro Foods, S.A.
Goya Foods, Inc.
- *Disclaimer: Major Players sorted in no particular order

Recent Industry Developments
- January 2026: Cargill announced an investment exceeding RMB 45 million (approximately USD 6.2 million) to expand its Beijing plant in Changping District with two independent production lines for flavored powdered beverages and flavored frozen coatings, plus a high-bay warehouse, incorporating advanced vision-guided robotics and end-to-end traceability systems from raw materials to finished products, with operations expected to commence in the first half of 2027.
- April 2025: Shyamatara Rice Mills, a prominent player in West Bengal's rice milling sector, has unveiled its newest offering: Bengal Crown Fortified Rice. This premium rice, infused with vital micronutrients, seeks to combat malnutrition and enhance public health in the region.
- March 2025: Laos launched a USD 1 million India-UN partnership to integrate fortified rice into school feeding programs, demonstrating South-South cooperation models that bypass traditional donor-recipient frameworks and leverage India's production capacity for regional nutrition programs.


Global Fortified Rice Market Report Scope
Fortified rice is regular rice that has been deliberately enriched with essential vitamins and minerals, primarily iron, folic acid, and Vitamin B12, to improve its nutritional quality and combat "hidden hunger". The global fortified rice market is segmented by nutrient, category, end-user, and geography. By nutrient, the market is segmented into iron, vitamins, minerals, and zinc. By category, the market is segmented into conventional and organic. By end-user, the market is segmented into on-trade and off-trade. The off-trade market is further sub-segmented into supermarkets/hypermarkets, convenience/grocery stores, specialty/gourmet stores, online retail/e-commerce, and others. By geography, the market is segmented into North America, Europe, Asia-Pacific, South America, and the Middle East and Africa. The Market Forecasts are Provided in Terms of Value (USD).
| Iron |
| Vitamins |
| Minerals |
| Zinc |
| Conventional |
| Organic |
| On-Trade | |
| Off-Trade | Supermarkets/Hypermarkets |
| Convenience/Grocery Stores | |
| Specialty/Gourmet Stores | |
| Online Retail/E-commerce | |
| Others |
| North America | United States |
| Canada | |
| Mexico | |
| Rest of North America | |
| Europe | United Kingdom |
| Germany | |
| France | |
| Italy | |
| Spain | |
| Sweden | |
| Belgium | |
| Poland | |
| Netherlands | |
| Rest of Europe | |
| Asia-Pacific | China |
| Japan | |
| India | |
| Thailand | |
| Singapore | |
| Indonesia | |
| South Korea | |
| Australia | |
| Rest of Asia-Pacific | |
| South America | Brazil |
| Argentina | |
| Colombia | |
| Peru | |
| Chile | |
| Rest of South America | |
| Middle East and Africa | United Arab Emirates |
| South Africa | |
| Saudi Arabia | |
| Nigeria | |
| Egypt | |
| Morocco | |
| Turkey | |
| Rest of Middle East and Africa |
| Nutrient | Iron | |
| Vitamins | ||
| Minerals | ||
| Zinc | ||
| Category | Conventional | |
| Organic | ||
| End User | On-Trade | |
| Off-Trade | Supermarkets/Hypermarkets | |
| Convenience/Grocery Stores | ||
| Specialty/Gourmet Stores | ||
| Online Retail/E-commerce | ||
| Others | ||
| Geography | North America | United States |
| Canada | ||
| Mexico | ||
| Rest of North America | ||
| Europe | United Kingdom | |
| Germany | ||
| France | ||
| Italy | ||
| Spain | ||
| Sweden | ||
| Belgium | ||
| Poland | ||
| Netherlands | ||
| Rest of Europe | ||
| Asia-Pacific | China | |
| Japan | ||
| India | ||
| Thailand | ||
| Singapore | ||
| Indonesia | ||
| South Korea | ||
| Australia | ||
| Rest of Asia-Pacific | ||
| South America | Brazil | |
| Argentina | ||
| Colombia | ||
| Peru | ||
| Chile | ||
| Rest of South America | ||
| Middle East and Africa | United Arab Emirates | |
| South Africa | ||
| Saudi Arabia | ||
| Nigeria | ||
| Egypt | ||
| Morocco | ||
| Turkey | ||
| Rest of Middle East and Africa | ||


Key Questions Answered in the Report
How large is the fortified rice market in 2026?
The fortified rice market size stands at USD 12.34 billion in 2026 and is on course to reach USD 18.01 billion by 2031.
Which nutrient segment grows the fastest?
Vitamin-fortified rice is projected to register the quickest 8.08% CAGR through 2031, benefitting from multi-micronutrient blends that address more than anemia.
What region offers the highest growth potential through 2031?
The Middle East & Africa segment shows the steepest 8.92% CAGR, supported by Nigeria’s mandatory fortification policy and expanding mill capacity.
Why was fortified rice distribution paused in India in 2026?
India suspended public distribution after consumers reported color and odor issues, highlighting the need for stricter quality control and improved shelf-life management.
Page last updated on:


