
Packaged Rice Market Size and Share
Market Overview
| Study Period | 2021 - 2031 |
|---|---|
| Market Size (2026) | USD 157.29 Billion |
| Market Size (2031) | USD 197.95 Billion |
| Growth Rate (2026 - 2031) | 4.72 % |
| Fastest Growing Market | Middle East and Africa |
| Largest Market | Asia Pacific |
| Market Concentration | Low |
Major Players *Disclaimer: Major Players sorted in no particular order Image © Mordor Intelligence. Reuse requires attribution under CC BY 4.0. | |
Packaged Rice Market Analysis by Mordor Intelligence
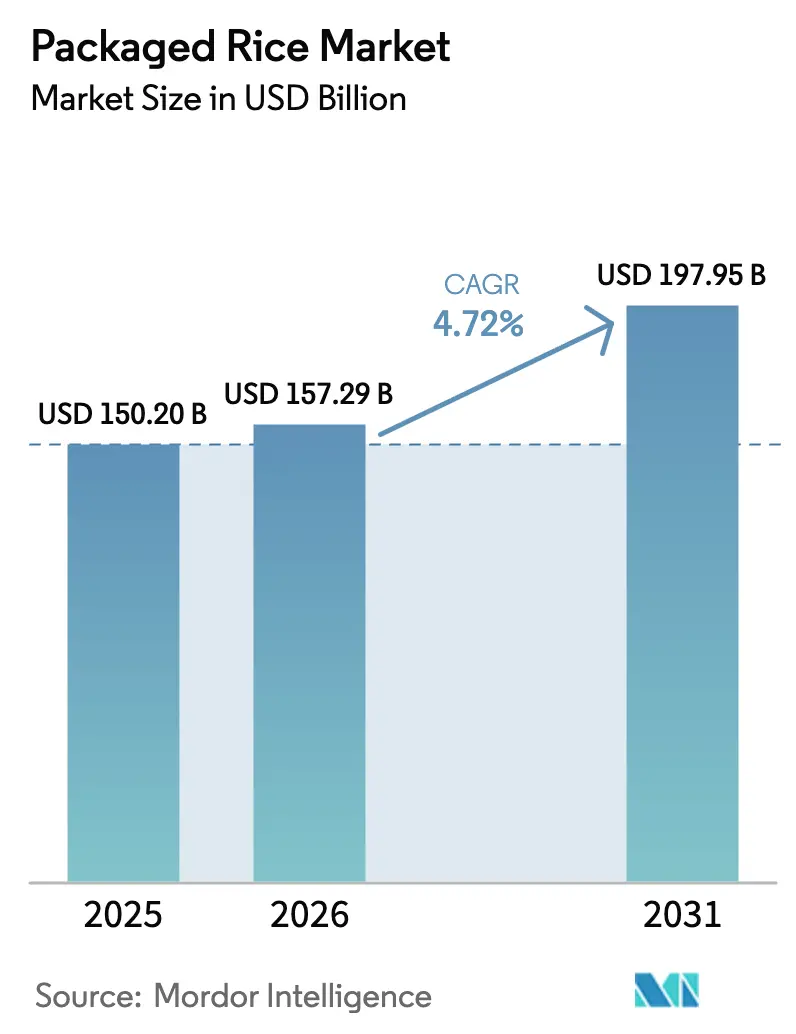
The packaged rice market size is expected to grow from USD 150.20 billion in 2025 to USD 157.29 billion in 2026 and is forecast to reach USD 197.95 billion by 2031 at 4.72% CAGR over 2026-2031. This growth trajectory reflects the sector's resilience amid evolving consumer preferences and regulatory mandates that are reshaping traditional rice consumption patterns. Government-led nutrition programs, particularly India's universal fortified rice distribution through the Public Distribution System extending until December 2028, demonstrate how policy interventions can create sustained demand for value-added packaged rice products[1]Source: Ministry of Consumer Affairs, “AFortified Rice: Centre’s ambitious initiative to combat micronutrient deficiencies,” pib.gov.in. Key factors contributing to market growth include the increasing demand for convenience driven by urbanization and a shift toward health-conscious consumption.
Key Report Takeaways
- By grain size, long-grain rice led with 61.78% of the packaged rice market share in 2025; short-grain rice is projected to expand at a 5.02% CAGR to 2031.
- By rice type, white rice accounted for 51.62% of the packaged rice market size in 2025; basmati rice is forecast to grow at a 5.38% CAGR through 2031.
- By nature, conventional rice held 91.72% share of the packaged rice market in 2025, while organic rice is poised for a 6.22% CAGR between 2026-2031.
- By category, raw rice dominated with 77.63% revenue share in 2025; ready-to-heat/ready-to-eat products are advancing at a 5.24% CAGR to 2031.
- By distribution channel, off-trade captured 70.86% share of total value in 2025; on-trade channels are set to register a 5.31% CAGR through 2031.
- By geography, Asia-Pacific commanded 48.12% of 2025 sales; the Middle East and Africa region is projected to log the fastest 5.88% CAGR over the forecast period.
Note: Market size and forecast figures in this report are generated using Mordor Intelligence’s proprietary estimation framework, updated with the latest available data and insights as of 2026.
Global Packaged Rice Market Trends and Insights
Drivers Impact Analysis*
| Driver | (~) % Impact on CAGR Forecast | Geographic Relevance | Impact Timeline |
|---|---|---|---|
| Rising health-conscious shift toward whole-grain and fortified rice | +1.2% | Global, with strong adoption in North America and European Union | Medium term (2-4 years) |
| Convenience-driven urban lifestyles boosting demand for ready-to-cook packs | +0.9% | Global urban centers, particularly Asia-Pacific and North America | Short term (≤ 2 years) |
| Government nutrition programmes mandating fortified rice | +1.1% | India, Indonesia, select African nations | Long term (≥ 4 years) |
| Increasing product innovation | +0.7% | Global, led by North America and Europe | Medium term (2-4 years) |
| Rising interest in international dishes using specialty rices | +0.5% | North America, Europe, urban Asia-Pacific | Medium term (2-4 years) |
| Growing demand for rice products with sustainable and eco-friendly packaging | +0.4% | Europe, North America, select Asia-Pacific markets | Long term (≥ 4 years) |
| Source: Mordor Intelligence | |||
Rising Health-Conscious Shift Toward Whole-Grain and Fortified Rice
Consumer awareness of micronutrient deficiencies is driving unprecedented demand for fortified packaged rice, with government programs serving as powerful market catalysts. The Union Cabinet approved the extension of the Fortified Rice Scheme until December 2028. The program ensures a universal supply of fortified rice across all government schemes, with the Government of India providing complete funding of INR 17,082 Crore[2]Source: Ministry of Consumer Affairs, “Fortified Rice Scheme Extended to 2028 with ₹17,082 Crore Government Backing,” pib.gov.in. This infrastructure development signals a structural shift toward fortified products that extends beyond government programs into commercial markets. The World Health Organization's (WHO)s endorsement of rice fortification as a Category 1 intervention where rice serves as a staple food provides regulatory validation that encourages private sector investment in fortified product lines[3]Source: World Health Organization, “Rice Fortification,” who.int. Brown rice and specialty whole-grain varieties are gaining traction among health-conscious consumers, particularly in developed markets where premium pricing supports higher margins for packaged rice producers.
Convenience-Driven Urban Lifestyles Boosting Demand for Ready-to-Cook Packs
Urban demographic shifts are fundamentally altering rice consumption patterns, with ready-to-serve products experiencing significant capacity expansions to meet growing demand. Riviana Foods' substantial expansion of ready-to-serve rice production capacity at its Memphis plant in April 2024 reflects industry recognition of this trend's durability beyond pandemic-driven changes. Thailand's ready-to-eat food industry shows growth in the packaged rice segment within shelf-stable products, driven by consumer demand for convenience and single-serving portions. Modern retail channels, particularly hypermarkets and convenience stores, have become primary distribution points for packaged rice in Thailand. Most rice reaches consumers in pre-packaged form through these modern retail formats. This shift from traditional bulk sales enables companies to establish premium positioning and differentiate their brands.
Government Nutrition Programmes Mandating Fortified Rice
Regulatory mandates for rice fortification are creating sustained demand streams that reshape supply chain dynamics and product specifications across multiple markets. Indonesia's National Food Agency rice distribution program Bantuan Pangan Beras, launched in mid-2023 with plans to distribute 639 million kg of fortified rice to 21.353 million beneficiary families, represents the best opportunity for scaling large-scale rice fortification in Southeast Asia[4]Source: UNICEF, “Landscape Analysis of Large-Scale Food Fortification in Indonesia,” unicef.org. The technical requirements for fortified rice production, including the need for specialized blending equipment and quality control systems, favor larger, more technologically advanced producers while creating barriers for smaller mills. Food Safety and Standards Authority of India (FSSAI) standards requiring specific micronutrient levels establish clear product specifications that drive industry standardization and investment in fortification technology. These programs create predictable, long-term demand that enables capacity planning and supply chain optimization for packaged rice producers serving institutional markets.
Increasing Product Innovation
Technological advancement in rice processing and packaging is enabling product differentiation strategies that command premium pricing and expand addressable markets. Modern rice milling technology adoption, featuring automation, digitalization, and energy efficiency improvements, allows producers to offer multiple SKUs and ensure traceability standards that meet evolving consumer expectations. Fortified rice production machinery, including full-automatic artificial rice making machines with twin-screw extrusion technology, enables manufacturers to produce nutritionally enhanced products at a commercial scale with outputs ranging from 100-240 kg/hour. SunRice's introduction of Microwave Rice Cups and flavored varieties demonstrates how packaging innovation can create new consumption occasions and drive usage frequency. The integration of sustainability features, including packaging transitions to recyclable formats and reduced plastic usage, aligns product development with environmental regulations and consumer preferences while supporting premium positioning strategies.
Restraints Impact Analysis*
| Restraint | (~) % Impact on CAGR Forecast | Geographic Relevance | Impact Timeline |
|---|---|---|---|
| Rising popularity of low-carb grain substitutes (quinoa, cauliflower "rice") | -0.8% | North America, Europe, urban Asia-Pacific | Medium term (2-4 years) |
| Price volatility of raw rice | -1.1% | Global, particularly affecting import-dependent regions | Short term (≤ 2 years) |
| Regulatory, certification, and counterfeit risks | -0.6% | Global, with higher impact in developing markets | Long term (≥ 4 years) |
| Supply chain and storage challenges | -0.9% | Global, acute in regions with limited infrastructure | Medium term (2-4 years) |
| Source: Mordor Intelligence | |||
Rising Popularity of Low-Carb Grain Substitutes
Alternative grain products are capturing market share in health-conscious demographic segments, particularly among consumers seeking reduced carbohydrate intake and dietary diversification. The emergence of cauliflower rice, quinoa, and other low-carb substitutes creates competitive pressure on traditional packaged rice products, especially in premium market segments where consumers have higher disposable income and a greater willingness to experiment with alternatives. This trend is most pronounced in North American and European markets, where dietary trends often originate before spreading to other regions. However, rice's fundamental role as a staple food, particularly in Asian markets where it represents cultural and nutritional foundations, limits the substitution threat's overall impact. The challenge for packaged rice producers lies in product positioning and innovation to address health-conscious consumers' concerns while maintaining rice's convenience and versatility advantages.
Price Volatility of Raw Rice
International rice price fluctuations create significant margin pressure and supply chain uncertainty for packaged rice producers, with recent volatility demonstrating the market's sensitivity to policy and weather disruptions. Rice prices increased approximately 45% between August 2022 and January 2024, driven by El Niño weather concerns and India's export restrictions, before declining as conditions stabilized[5]Source: International Rice Research Institute, “Ups and downs in the world rice market,” irri.org. This volatility pattern, combined with fertilizer cost fluctuations and shipping disruptions from geopolitical tensions, complicates pricing strategies and inventory management for packaged rice companies. Producers must develop sophisticated hedging strategies and supply chain diversification to manage these risks while maintaining competitive pricing for packaged products.
*Our forecasts treat driver/restraint impacts as directional, not additive. The impact forecasts reflect baseline growth, mix effects, and variable interactions.
Segment Analysis
By Grain Size: Long-Grain Dominance Faces Short-Grain Innovation
Long-grain rice maintains its commanding position with 61.78% market share in 2025, driven by its versatility in international cuisines and superior storage characteristics that appeal to both consumers and retailers. The segment's dominance reflects established supply chains, particularly from major producing regions like India and Thailand, where long-grain varieties benefit from export infrastructure and quality standardization. Short-grain rice emerges as the fastest-growing segment with 5.02% CAGR through 2031, propelled by increasing demand for specialty applications, including sushi preparation and premium ready-to-eat products that require specific texture characteristics.
The grain size segmentation reveals evolving consumer sophistication and willingness to pay premiums for application-specific products. European specialty rice market analysis indicates growing demand for aromatic and specialty varieties, with short-grain options gaining traction in organic and premium channels. This trend suggests that while long-grain rice maintains volume leadership, value creation increasingly occurs in specialized segments where grain size directly impacts culinary performance and consumer satisfaction.




By Rice Type: White Rice Leadership Challenged by Basmati Growth
White rice commands 51.62% market share in 2025, reflecting its broad appeal across diverse consumer segments and established position in both retail and foodservice channels. However, basmati rice demonstrates the strongest growth trajectory at 5.38% CAGR through 2031, driven by increasing appreciation for aromatic varieties and expanding international cuisine adoption. Brown rice and other specialty types collectively represent the remaining market share, with brown rice benefiting from health-conscious consumption trends despite processing and shelf-life challenges that limit broader adoption.
The market shows a shift toward premium packaged rice products, particularly aromatic and specialty varieties, which generate higher profit margins compared to standard white rice. KRBL Limited's integrated basmati value chain, spanning seed development through branded marketing across multiple international markets, demonstrates how type-specific specialization can create competitive advantages. Basmati's growth trajectory reflects both expanding ethnic food consumption and mainstream acceptance of premium rice varieties in developed markets.
By Nature: Organic Rice Gains Momentum Despite Conventional Dominance
Conventional rice holds a dominant market share of 91.72% in 2025, driven by established supply chains, lower costs, and widespread consumer acceptance. The conventional segment's dominance reflects rice's position as a staple food, with price being a primary factor in consumer purchasing decisions. Organic rice, representing 8.28% market share in 2025, exhibits the highest growth rate at 6.22% CAGR through 2031, driven by health-conscious consumers and regulatory support for sustainable agriculture practices.
Organic rice growth faces supply chain constraints and certification complexities that limit rapid scaling, but premium pricing supports specialized producers and retailers. Matco Foods' achievement of European Union Organic Certification for both farm and factory-level practices, enabling the global supply of organic basmati varieties, illustrates the technical and regulatory requirements for successful organic rice market participation. The organic segment's growth trajectory suggests increasing consumer willingness to pay premiums for perceived health and environmental benefits, creating opportunities for differentiated positioning strategies.
By Category: Ready-to-Eat Innovation Disrupts Raw Rice Dominance
Raw rice maintains the largest category share at 77.63% in 2025, reflecting traditional consumption patterns and price sensitivity among core consumer segments. Parboiled rice serves specific regional preferences and processing applications, while ready-to-heat/ready-to-eat rice emerges as the fastest-growing category with 5.24% CAGR through 2031. This growth reflects urbanization trends and changing lifestyle patterns that prioritize convenience over traditional cooking methods.
The rice consumption patterns are shifting significantly, especially in urban areas where busy lifestyles increase the demand for convenient rice products. Thailand's ready-to-eat food industry projects stronger export growth than domestic growth, indicating international market opportunities for packaged convenience rice products. Ready-to-eat rice products benefit from extended shelf life, portion control, and preparation convenience, creating new consumption occasions and expanding addressable markets beyond traditional rice consumers.

By Distribution Channel: Modern Trade Reshapes Traditional Rice Sales
Off-trade channels dominate with 70.86% market share in 2025, encompassing supermarkets, hypermarkets, convenience stores, and online retail platforms that serve the majority of packaged rice consumers. On-trade channels demonstrate faster growth at 5.31% CAGR through 2031, driven by expanding foodservice sectors and institutional purchasing programs. This growth reflects increasing rice consumption in restaurants, hotels, and institutional settings where packaged products offer portion control and quality consistency advantages.
The distribution channel evolution reflects broader retail transformation and changing consumer shopping behaviors, accelerated by digital adoption. E-commerce growth in grocery retail creates new opportunities for packaged rice brands to reach consumers directly. Modern trade channels enable premium positioning and brand differentiation while providing data insights that inform product development and marketing strategies.
Geography Analysis
Asia-Pacific maintains its dominant position with 48.12% market share in 2025, supported by traditional consumption patterns, large population bases, and government-led nutrition programs that create sustained demand for packaged rice products. The region's leadership reflects both production advantages and cultural preferences that make rice a dietary staple across diverse markets. China and India represent the largest individual markets within the region, while Southeast Asian countries contribute through both consumption and export-oriented production. Government fortification programs, particularly India's universal fortified rice distribution extending through December 2028, create predictable demand streams that support capacity planning and investment decisions for regional producers.
The Middle East and Africa region exhibits the highest growth potential with a 5.88% CAGR through 2031, driven by population growth, urbanization, and improving distribution infrastructure. The region's growth trajectory reflects increasing rice consumption as dietary patterns evolve and government nutrition programs expand. Regional rice fortification efforts, supported by organizations like The George Institute's analysis of nutrition labeling regulations across Ethiopia, Kenya, Nigeria, and South Africa, indicate growing policy attention to rice as a vehicle for addressing micronutrient deficiencies.
North America and Europe represent mature markets with established consumption patterns and sophisticated distribution networks that favor premium and specialty rice products. North American market dynamics reflect demographic diversity, with rice consumption concentrated among Asian and Hispanic populations who demonstrate higher per-consumer intake and frequency of consumption. European specialty rice markets show growing demand for organic, Fairtrade, and sustainably certified products, with the United Kingdom representing the largest importer from developing countries and strong demand for basmati varieties driven by ethnic population preferences.


Regulatory Landscape
Regulation in packaged rice is shaped by food standards, fortification specifications, and trade measures that affect labeling, quality, and cross-border supply. In the United States, the USDA updated the United States Standards for Rice via a Federal Register action dated November 18, 2025, reinforcing standardized definitions that influence grading, procurement specifications, and retail quality claims. In India, FSSAI fortification requirements and the Government of India decision to extend the Fortified Rice Scheme through December 2028 raise compliance needs around micronutrient dosing and quality assurance for fortified packaged rice distributed via government channels.
Trade and import regimes also add compliance steps and cost variability for branded and private-label packaged rice players. In January 2026, the Philippines implemented a price-triggered rice tariff adjustment mechanism (under Executive Order No. 105, 2025), with tariffs varying by international price triggers, which affects landed costs for importers and downstream packers. India also tightened export protocols for access to China, with APEDA issuing procedures on June 8, 2026 that include requirements such as HACCP implementation and GMO analysis, raising the bar for mill registration and documentation for exporters targeting that corridor. In March 2026, the UK opened the 2026 quota year for rice imports with defined allocations by origin, shaping sourcing strategies for European packers and retailers.
Value Chain Analysis
The packaged rice value chain runs from seed and varietal development, cultivation (often via contract farming), and paddy procurement through milling and polishing, blending or fortification (where applicable), packaging, warehousing, and distribution via modern trade, e-commerce, and foodservice or institutional channels. Integrated players such as KRBL combine upstream sourcing, processing, and branded distribution, which helps manage quality attributes like grain length, aroma, breakage, and export readiness for premium categories such as basmati.
Value addition and risk concentrate at processing, compliance, and logistics nodes. Fortified rice mandates and export access rules increase demand for blending technology, testing, and certified food safety systems, including HACCP-linked requirements under India export procedures to China, which can advantage larger mills and organized brands. Downstream, multinational and regional operators manage currency and tariff exposure in import-dependent routes; Ebro Foods highlighted sensitivity in its US import operations to tariff fluctuations and USD/EUR movements in Q1 2026, showing how trade policy and FX can affect input costs and pack pricing. Sustainability and traceability are also becoming operational requirements in some channels, with LT Foods conducting carbon footprint analysis across Scopes 1, 2, and 3 and new exporter Rize shipping 1,500 metric tons of traceable low-emission rice to multiple developed markets, indicating more data-driven sourcing and verification across the chain.
Competitive Landscape
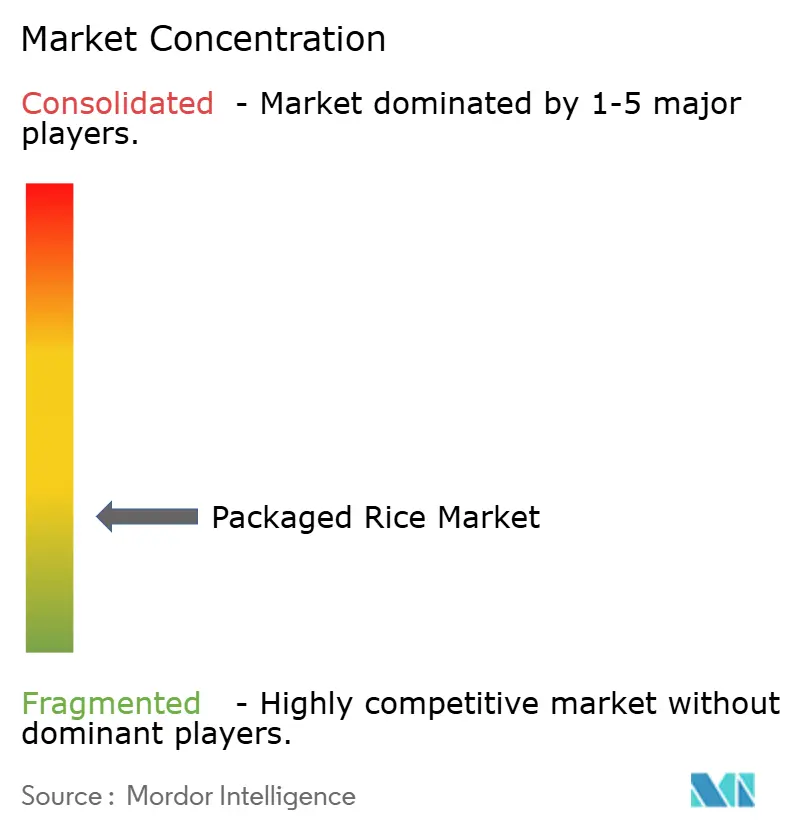
The packaged rice market exhibits fragmentation, indicating significant opportunities for consolidation and market share gains through strategic positioning and operational excellence. Leading players pursue vertical integration strategies that span seed development, farming partnerships, processing, packaging, and brand marketing to capture value across the supply chain.
Technology adoption emerges as a key differentiator, with companies investing in automation, digital quality control, and sustainable packaging to improve efficiency and meet evolving consumer expectations. White-space opportunities exist in emerging markets where distribution infrastructure development and government nutrition programs create new demand streams for packaged rice products.
Emerging disruptors focus on sustainability positioning, direct-to-consumer channels, and specialty product development that addresses specific dietary preferences or cooking applications. The moderate concentration level suggests that both organic growth and acquisition strategies can effectively build market position, particularly for companies that can combine operational efficiency with brand development and distribution network expansion.
Packaged Rice Industry Leaders
KRBL Ltd
LT Foods Ltd
Riviana Foods Inc
Riceland Foods Inc
Ebro Foods SA
- *Disclaimer: Major Players sorted in no particular order

Market Opportunities and Future Outlook
Fortification-linked procurement and institutional demand create a commercialization pathway for value-added packaged rice, particularly in markets where rice is used to deliver nutrition programs. India extended its universal fortified rice distribution through government schemes until December 2028, supported by dedicated funding, which increases the addressable volume for fortified packaged formats and supports investment in blending, testing, and compliant packaging suited to large-scale distribution.
Sustainability-verified and traceable rice programs are creating premiumization and channel-access opportunities, especially for export-oriented packaged rice and branded basmati. In May 2026, Tilda expanded its sustainable basmati programme to 3,840 farms and reported a 36.9 billion litre annual reduction in irrigation water usage, giving major brands operational metrics they can translate into on-pack claims and retailer requirements. Capital is also moving toward traceability and farm digitization: Rize raised USD 31 million in July 2026 to expand AI-enabled sustainable farming and export traceability systems across Southeast Asia, and it has already shipped 1,500 metric tons of traceable low-emission rice to buyers in Europe, Canada, Australia, and Singapore. In Southeast Asia, branded packaged rice can also connect to public nutrition pipelines through structured offtake; Pandawa Agri and Danone Indonesia integrated the RiceVitalize ecosystem into the Indonesian government's Makan Bergizi Gratis program for school-meal supply chains.
Recent Industry Developments
- July 2026: KRBL Limited launched India Gate Classic Biryani Kit. The launch expands the packaged rice convenience segment. The initiative reinforces the India Gate brand moat and supports the domestic Biryani masala kit category.
- June 2026: KRBL Limited launched Poha under the India Gate brand. The launch expands staples-category footprint within the packaged rice portfolio. It broadens the product mix to capture breakfast and snack meal occasions, aiming to increase share in staple offerings.
- April 2026: Riviana Foods Inc. launched Success Boil-in-Bag Sticky Rice for Eastern US market. The launch expands the boil-in-bag ready-to-heat portfolio in the US east coast. It strengthens Riviana's regional distribution in key market channels.


Research Methodology Framework and Report Scope
Market Definition and Coverage
For this study, the market includes rice sold in packaged form for household and foodservice use, across modern trade and online channels, and valued at the point of sale in each country.
Scope exclusions: Excluded items typically include unpackaged loose rice sold in open markets and food products where rice is only a minor ingredient (such as ready-to-eat meals).
Segmentation Overview
- By Grain Size
- Short-Grain Rice
- Medium-Grain Rice
- Long-Grain Rice
- By Rice Type
- White Rice
- Brown Rice
- Basmati Rice
- Others
- By Nature
- Conventional
- Organic
- By Category
- Raw Rice
- Parboiled Rice
- Ready-to-heat/Ready-to-eat Rice
- By Distribution Channel
- On-Trade
- Off-Trade
- Supermarkets/Hypermarkets
- Convenience Stores
- Specialty Stores
- Online RetailStores
- Other Distribution Channels
- By Geography
- North America
- United States
- Canada
- Mexico
- Rest of North America
- Europe
- Germany
- United Kingdom
- Italy
- France
- Spain
- Netherlands
- Poland
- Belgium
- Sweden
- Rest of Europe
- Asia-Pacific
- China
- India
- Japan
- Australia
- Indonesia
- South Korea
- Thailand
- Singapore
- Rest of Asia-Pacific
- South America
- Brazil
- Argentina
- Colombia
- Chile
- Peru
- Rest of South America
- Middle East and Africa
- South Africa
- Saudi Arabia
- United Arab Emirates
- Nigeria
- Egypt
- Morocco
- Turkey
- Rest of Middle East and Africa
- North America
Data Sources, Market Sizing, and Validation
Desk Research
Desk work starts with building the demand and supply context around rice that can realistically flow into packaged formats. We use public sources such as FAOSTAT, USDA PSD, ITC Trade Map, UN Comtrade, and select national statistics offices to understand production, imports, and exports, and to confirm the consumption direction by country.
Next, we cross-check how packaging and retail dynamics could shift value, using sources like customs tariff schedules, government food safety and labeling rules, and trade association publications for grains and packaged foods. We also use company annual reports, investor presentations, and reputed press articles to map brand presence and route-to-market differences. Where financial details are missing, we fill gaps using paid subscriptions for company financials and intelligence, patent databases, and shipment-level import and export data where relevant. The examples listed here are illustrative and not exhaustive, and additional references were consulted for validation and clarification.
Primary Interviews and Surveys
Primary work was used to pressure-test the desk assumptions on what actually sells as packaged rice, how pack sizes and price bands move, and how distribution margins vary by channel. We spoke with a mix of manufacturers, distributors, retailers, and category specialists across major consuming regions, so the model inputs reflect observed buying patterns rather than only trade statistics.
Distribution of primary research fieldwork respondents
| Company type | Respondent position | Region |
|---|---|---|
| Top tier: 35% | CXOs: 13% | APAC: 42% |
| Mid tier: 49% | Functional/Unit leaders: 27% | EMEA: 35% |
| Smaller Players: 16% | Managers: 60% | Americas: 23% |
Market-Sizing & Forecasting
Sizing is built using a top-down demand pool reconstruction, where production, trade flows, and apparent consumption are narrowed to the share that is sold through packaged formats by country and channel. This is then translated into value using observed retail and wholesale price bands by rice type and pack size, with adjustments for channel markups and taxes where applicable.
To keep the totals realistic, we corroborate them with selective bottom-up checks, such as rolling up sampled branded and private label SKUs across key channels and applying ASP x volume logic for a small set of representative markets, followed by adjustments where the gap stays persistent. Inputs that most commonly move the model include the packaged share of total rice consumption, shifts toward premium varieties (such as basmati and jasmine), pack-size mix, penetration of modern trade and e-commerce, and import dependency for specific rice types.
Forecasting is done using scenario analysis supported by trend smoothing, where drivers like income growth, urbanization, retail expansion, and rice price cycles are mapped to packaged share and price progression. When primary responses differ by country, we apply a conservative midpoint and document the assumption so the steps can be repeated and reviewed later.
Data Validation & Update Cycle
Checks are applied at multiple stages so results do not rely on one dataset or one assumption. We compare modeled totals against independent signals like trade totals, per capita consumption reasonability, price movement ranges, and the implied packaged share, and then outliers are reviewed before sign-off.
If a variance is large, the driver is traced back to one of the key inputs and revalidated through follow-up outreach or additional public data pulls. Reports are refreshed annually, with interim updates when material events occur (such as policy changes, major price shocks, or trade restrictions). Before delivery, an analyst completes a final pass to ensure the latest data points are reflected and that assumptions remain consistent.
Mordor Intelligence's Packaged Rice Market Size Compared Against Other Published Estimates
Published values for packaged rice can look far apart because the line between packaged retail rice and broader rice trade is not consistent across sources, and price assumptions also vary by channel and geography. Differences also show up when one estimate is built from retail value only, and another includes foodservice or bulk-to-pack conversion.
Trade-flow checks, packaged-share validation from interviews, and SKU-level price band reviews are the evidence points that connect Mordor Intelligence to packaged-format demand (including foodservice packs) rather than total rice consumption. Gaps usually come from counting loose rice sold through traditional markets, mixing adjacent rice forms differently, or applying one currency timing and margin structure across many countries.
Benchmark comparison
| Source | Market Size | Gaps in Research Methodology |
|---|---|---|
| Mordor Intelligence | USD 157.29 B (2026) | |
| Trade Journal A | USD 67.55 B (2024) | Often scoped as pre-packaged retail rice only, which tends to exclude parts of foodservice demand and can understate value in markets where packaging happens downstream from import or milling. |
| Industry Portal B | USD 33.16 B (2025) | Typically reflects a narrower set of packaged rice products and regions, and may rely on simplified pricing that does not fully capture premium variety mix and channel margins. |
Looking across the table, the spread is mainly explained by what is counted as packaged rice and how value is built up from prices and channels. When scope is tightened to retail-only packaged SKUs or limited geographies, the total naturally drops, even if similar consumer trends are cited. Our method stays repeatable because the final number can be traced back to packaged share, price bands, and country roll-ups that are checked during updates.


Key Questions Answered in the Report
How large will global sales of packaged rice be in 2031?
The packaged rice market is projected to reach USD 197.95 billion by 2031, reflecting a 4.72% CAGR from 2026.
Which grain size segment is expanding fastest?
Short-grain rice is poised for the highest growth, advancing at a 5.02% CAGR through 2031 owing to sushi and dessert demand.
What drives the shift toward ready-to-eat rice packs?
Urban lifestyles favor convenience; microwaveable cups and shelf-stable pouches cut cooking time and have spurred a 5.24% CAGR in the ready-to-heat category.
Which region offers the strongest growth potential?
The Middle East and Africa is forecast to expand at 5.88% CAGR through 2031, supported by population growth and improving distribution networks.
Page last updated on:


 Your data is secure and never sold or shared.


