Foodservice Coffee Market Size and Share
Market Overview
| Study Period | 2021 - 2031 |
|---|---|
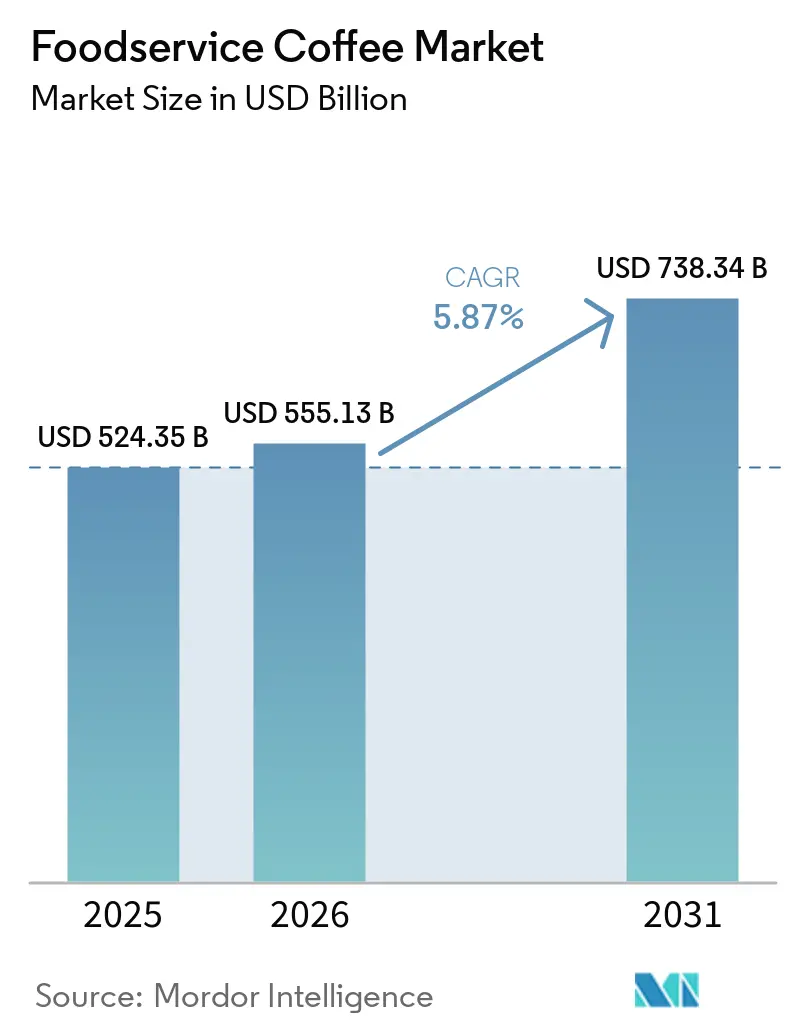
| Market Size (2026) | USD 555.13 Billion |
| Market Size (2031) | USD 738.34 Billion |
| Growth Rate (2026 - 2031) | 5.87% CAGR |
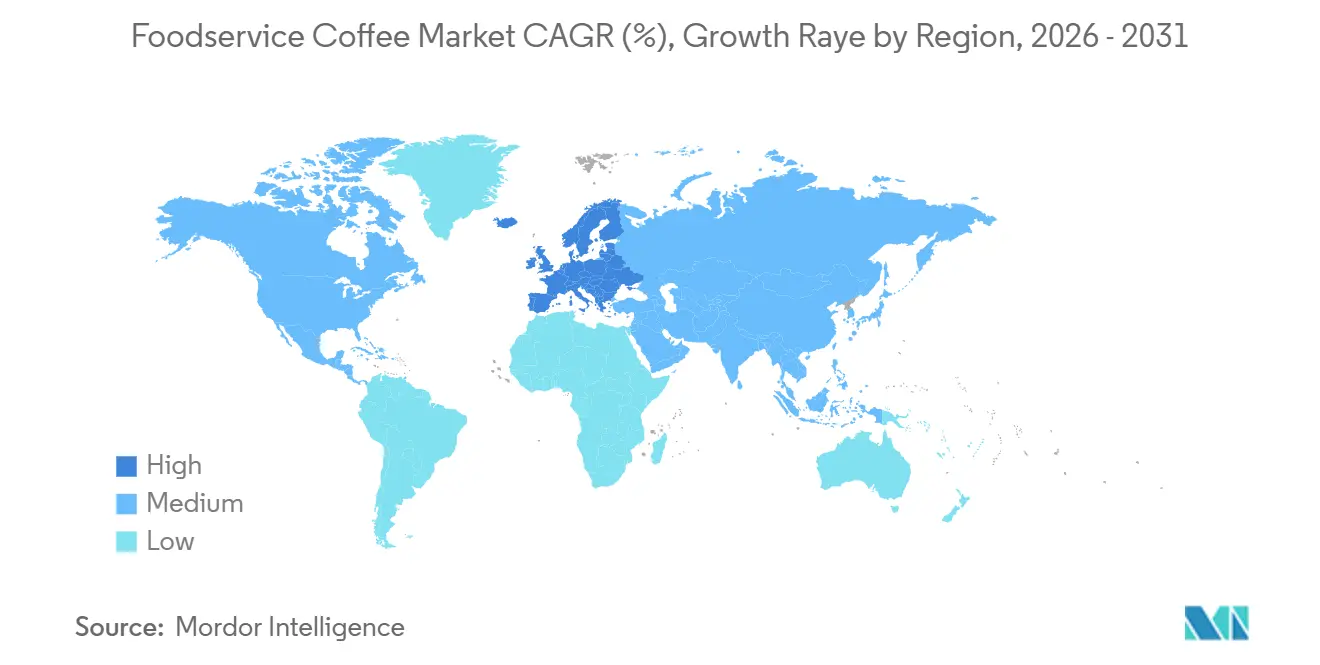
| Fastest Growing Market | Asia-Pacific |
| Largest Market | Europe |
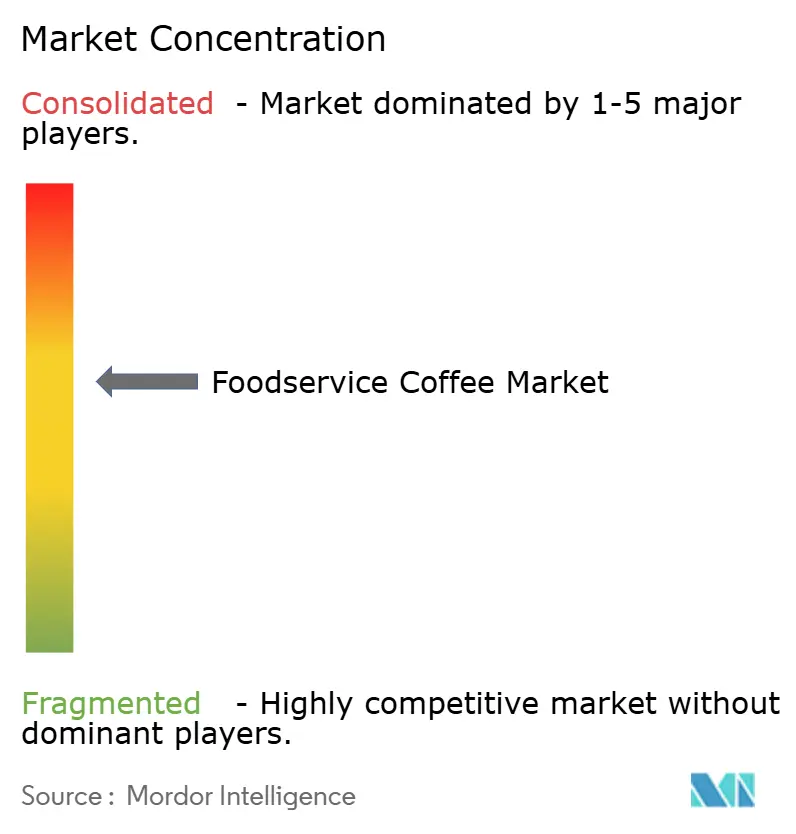
| Market Concentration | Medium |
Major Players
*Disclaimer: Major Players sorted in no particular order Image © Mordor Intelligence. Reuse requires attribution under CC BY 4.0. |
|
Foodservice Coffee Market Analysis by Mordor Intelligence
The foodservice coffee market size is expected to increase from USD 524.35 billion in 2025 to USD 555.13 billion in 2026 and reach USD 738.34 billion by 2031, growing at a CAGR of 5.9% over 2026-2031. This growth is driven by changing consumer habits, as drinking coffee outside the home has become a regular part of social interactions and work routines in both developed and emerging economies. By outlet type, chained networks are expanding their scale, while independent outlets are redefining their value propositions to attract customers. In terms of service format, dine-in options continue to hold their ground, but takeaway services are increasingly becoming a key access point for consumers. Regarding end use, coffee shops and cafés remain the dominant segment, while convenience formats, such as grab-and-go outlets, are gaining significant traction. Europe remains the largest market for foodservice coffee, as café culture is deeply ingrained in daily life. The market is moderately consolidated, with key players including Nestle S.A., JDE Peet’s N.V., Lavazza S.p.A., Starbucks Corporation, and Keurig Dr. Pepper Inc. leading the competition.
Key Report Takeaways
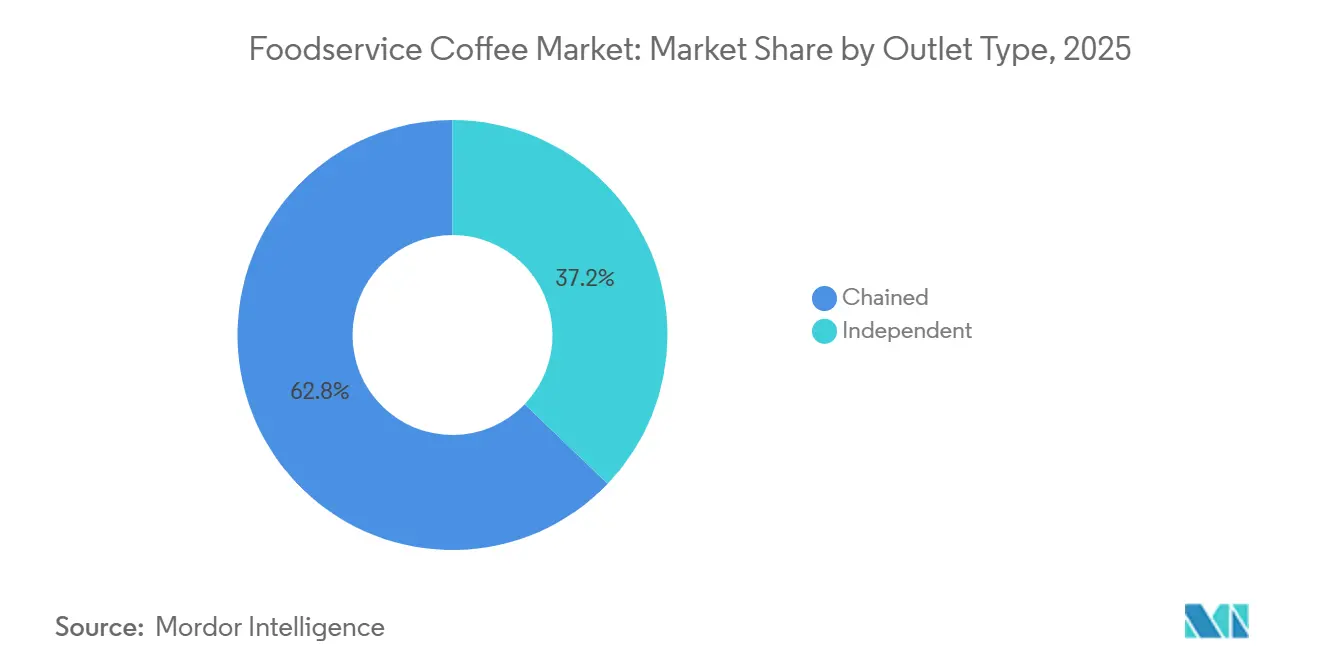
- By outlet type, chained outlets held 62.83% of the foodservice coffee market share in 2025, while independent outlets are projected to expand at a 7.51% CAGR through 2031.
- By service format, dine-in accounted for 59.18% of the foodservice coffee market in 2025, while takeaway is projected to grow at a 7.24% CAGR through 2031.
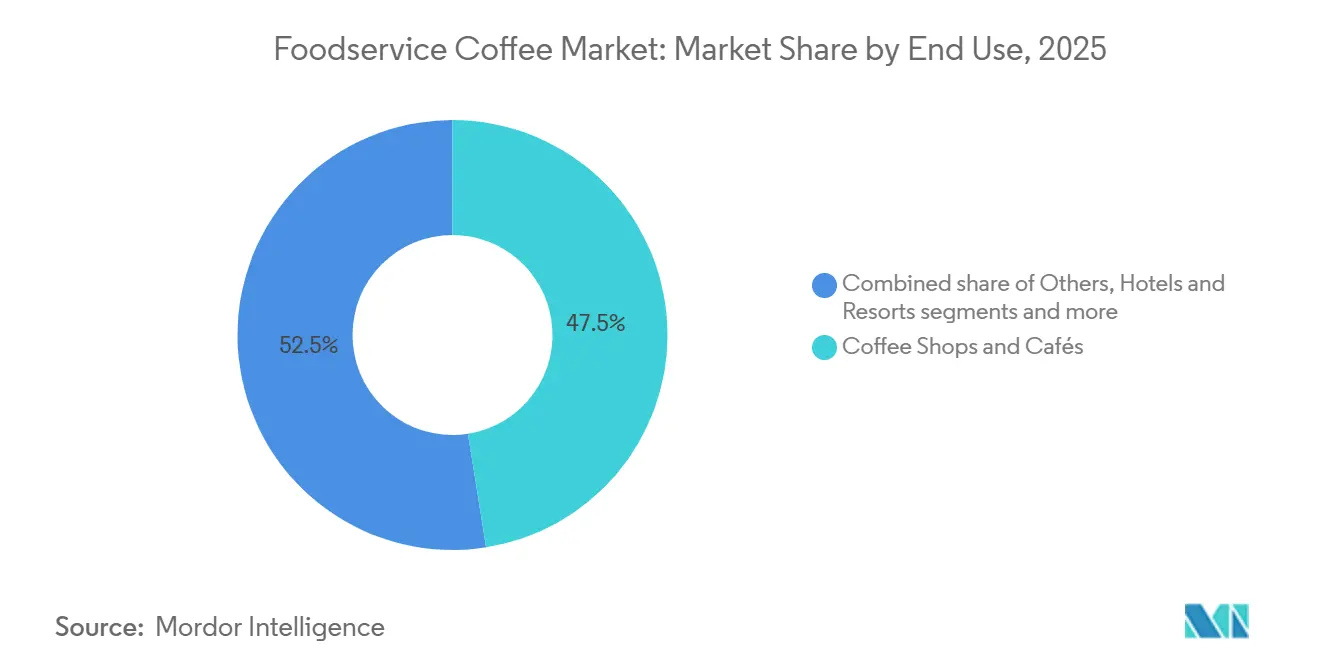
- By end use, coffee shops and cafés accounted for 47.51% of the foodservice coffee market in 2025, while the other category is projected to grow at a 7.54% CAGR through 2031.
- By geography, Europe held 38.47% of the foodservice coffee market share in 2025, while Asia-Pacific is projected to grow at an 8.04% CAGR through 2031.
Note: Market size and forecast figures in this report are generated using Mordor Intelligence’s proprietary estimation framework, updated with the latest available data and insights as of January 2026.
Global Foodservice Coffee Market Trends and Insights
Drivers Impact Analysis*
| Driver | (~) % Impact on CAGR Forecast | Geographic Relevance | Impact Timeline |
|---|---|---|---|
| Rising café culture and social coffee consumption | +1.2% | Global, strongest in Europe and Asia-Pacific | Long term (≥ 4 years) |
| Digital ordering and loyalty program adoption | +0.8% | North America and Asia-Pacific core, spill-over to Europe | Medium term (2–4 years) |
| Growth of remote working and flexible workspaces | +0.6% | North America and Western Europe | Medium term (2–4 years) |
| Expansion of drive-thru and grab-and-go formats improving convenience | +0.7% | North America primarily, spreading to Asia-Pacific and Middle East and Africa | Medium term (2–4 years) |
| Corporate and institutional coffee services creating additional consumption opportunities | +0.5% | North America and Europe | Medium term (2–4 years) |
| Growing tourism and hospitality activities supporting coffee consumption | +0.4% | Europe, Asia-Pacific, Middle East and Africa | Short term (≤ 2 years) |
| Source: Mordor Intelligence | |||
Rising café culture and social coffee consumption
The foodservice coffee market is growing as café culture becomes more popular and coffee shops increasingly serve as places for socializing, working, and relaxing. People are not just visiting cafés for coffee but also for the overall experience, such as meeting friends, holding informal meetings, or enjoying a comfortable environment. This has led to more frequent visits and stronger customer loyalty. Younger consumers, in particular, are driving demand for unique coffee options like specialty coffee, cold brew, plant-based alternatives, and personalized beverages. According to the National Coffee Association, as of July 2025, 46% of American adults reported drinking specialty coffee in the past day, showing a clear shift toward premium coffee choices[1]Source: National Coffee Association, "Specialty Coffee Consumption Hits 14-Year High", ncausa.org. To capitalize on this trend, coffee shop operators are focusing on creating welcoming spaces, offering innovative drink menus, and providing unique customer experiences.
Digital ordering and loyalty program adoption
The growing use of loyalty programs, combined with mobile ordering platforms, is changing how customers engage with coffee brands and make purchasing decisions in the foodservice coffee market. Businesses are leveraging these digital tools to offer tailored experiences, encourage repeat visits, and build stronger connections with their customers. These platforms also enable companies to gather real-time data on consumer preferences, helping them predict demand, manage inventory efficiently, and run targeted marketing campaigns. For example, Starbucks reported nearly 34 million active rewards members in its fiscal Q3 2025 update, showcasing how loyalty programs are significantly influencing coffee consumption patterns[2]Source: Starbucks Corporation, "Starbucks Card, Loyalty & Mobile Dashboard", s203.q4cdn.com. As consumers continue to prioritize convenience and personalized experiences, digital tools like these are becoming essential for coffee operators to remain competitive and drive market growth.
Growth of remote working and flexible workspaces
The growing trend of remote and hybrid work is boosting demand in the foodservice coffee market, as more people use cafés as casual workspaces or meeting spots. Professionals, freelancers, and students are increasingly looking for places where they can work productively while enjoying food and beverages. This shift is driving more foot traffic to cafés, not just during the usual morning coffee rush but throughout the day. Additionally, customers who spend more time in cafés often make multiple purchases, leading to higher sales per visit. For example, Eye on Housing reported that around 34.3 million people in the United States were working remotely or from home as of December 2025[3]Source: Eye On Housing Organization, "Who’s Still Working from Home in 2025? A Look at America’s Telework Trends", eyeonhousing.org. As flexible work becomes more common, cafés that offer comfortable seating, reliable Wi-Fi, and a work-friendly atmosphere are likely to attract more customers and experience steady revenue growth.
Expansion of drive-thru and grab-and-go formats is improving convenience
The increasing demand for drive-thru and grab-and-go formats is driving growth in the foodservice coffee market by meeting consumer needs for quick service, convenience, and easy access. With busier lifestyles, longer commutes, and a growing preference for beverages on the go, coffee operators are expanding these formats to reduce wait times while maintaining high service standards. These formats enable brands to serve more customers efficiently, improve operations, and cater to customers seeking fast, convenient coffee options. For example, Dutch Bros achieved USD 1.64 billion in revenue in 2025, a 27.9% increase from the previous year, while expanding its store presence in key markets. As consumers increasingly prioritize convenience in their purchasing decisions, drive-thru and grab-and-go models are expected to play a larger role in shaping customer preferences and influencing competition within the foodservice coffee market.
Restraints Impact Analysis*
| Restraint | (~) % Impact on CAGR Forecast | Geographic Relevance | Impact Timeline |
|---|---|---|---|
| Volatility in green coffee bean prices increasing operational costs | -0.6% | Global, most acute in high-arabica-dependency markets (North America, Europe, Asia-Pacific) | Short term (≤ 2 years) |
| Growing competition from at-home coffee solutions | -0.5% | North America and Europe | Long term (≥ 4 years) |
| Changing consumer preferences toward alternative beverages | -0.4% | North America, Europe, Asia-Pacific | Long term (≥ 4 years) |
| Dependence on imported coffee beans exposing operators to currency fluctuations | -0.3% | Asia-Pacific importers, South America-origin operators, Middle East and Africa | Medium term (2–4 years) |
| Source: Mordor Intelligence | |||
Volatility in green coffee bean prices is increasing operational costs
The foodservice coffee market is facing a major challenge due to fluctuating green coffee bean prices, which are driving up procurement costs and putting pressure on the profitability of coffee operators. Coffee production is highly sensitive to factors such as unfavorable weather conditions, supply chain disruptions, geopolitical tensions, and shifts in global trade policies. These factors collectively contribute to the instability of coffee prices. Smaller cafés and independent coffee shops are particularly affected, as they lack the purchasing power and financial tools, like hedging, that larger chains often use to manage such risks. According to the International Coffee Organization, arabica coffee stocks for the 2024/25 period have dropped to 20-21 million bags, marking the lowest levels in over 20 years. This decline in supply is further intensifying price volatility. As a result, coffee operators are struggling to strike a balance between adjusting menu prices to cover costs and keeping their offerings affordable for consumers.
Growing competition from at-home coffee solutions
The foodservice coffee market is facing growing competition from at-home coffee options. With advanced coffee machines, premium coffee beans, capsules, and specialty brewing tools available, consumers can now easily make café-style beverages at home. These solutions are not only convenient but also cost-effective, as they allow people to enjoy high-quality coffee without frequent visits to cafés. As a result, many consumers now prefer to visit coffee shops mainly for social gatherings, unique experiences, or specialty drinks, rather than for their daily coffee needs. This trend is pushing coffee operators to work harder to stand out by offering innovative products, enhancing customer experiences, and improving convenience. However, maintaining steady customer traffic for regular coffee purchases has become increasingly challenging due to this shift in consumer behavior.
*Our forecasts treat driver/restraint impacts as directional, not additive. The impact forecasts reflect baseline growth, mix effects, and variable interactions.
Segment Analysis
By Outlet Type: Chained Networks Scale as Independents Redefine Value
In 2025, chained outlets were the largest contributors to the global foodservice coffee market, accounting for 62.83% of total market revenue. Their success comes from their widespread presence, efficient supply chains, and ability to keep costs under control. These outlets provide consistent quality and service, helping them build strong customer loyalty across locations. Their use of digital tools, such as online ordering systems and loyalty programs, has made it easier for customers to engage with their brand, encouraging repeat visits and strengthening their market position.
Independent outlets are projected to grow at a 7.51% CAGR through 2031, making them the fastest-growing segment of the market. This growth is driven by rising demand for specialty coffee, innovative brewing methods, and unique café experiences that set them apart from chain outlets. Independent cafés are often more flexible in meeting local preferences and adapting to new trends, which appeals to younger, trend-focused consumers. The rising interest in premium coffee and the personalized charm of neighborhood cafés are key drivers of this segment's growth.


By Service Format: Dine-In Holds as Takeaway Redefines the Access Point
Dine-in remains the most preferred service format in the foodservice coffee market, contributing 59.18% of total revenue in 2025. Consumers often choose cafés not just for coffee but as places to socialize, work, or hold casual meetings. These establishments provide a welcoming environment with comfortable seating and a focus on premium experiences, encouraging customers to stay longer and spend more. This combination of ambiance and functionality has solidified the dine-in format as a key driver of the market.
The takeaway segment is anticipated to grow the fastest, with a projected CAGR of 7.24% through 2031. This growth is fueled by the increasing demand for convenience as people juggle busy schedules. The adoption of mobile ordering and digital payment systems has made it easier for customers to quickly purchase coffee without compromising on quality. The rise in urban populations and the growing number of commuters have further boosted the popularity of takeaway services, as more individuals seek quick, efficient coffee options in their daily routines.
By End Use: Coffee Shops and Cafés Lead, Convenience Formats Capture Momentum
Coffee shops and cafés made up 47.51% of the foodservice coffee market by end use in 2025, remaining the top choice for people who prefer drinking coffee outside their homes. This is mainly because of the growing coffee culture and the increasing demand for unique and specialty coffee drinks. These places attract customers by offering high-quality coffee, comfortable seating, and a welcoming atmosphere. Their focus on creating innovative menus and using digital tools to connect with customers has helped them maintain their leading position in the market.
The "Others" category, which includes institutional foodservice, bakeries, pâtisseries, convenience-focused outlets, and other non-specialized coffee-serving locations, is expected to grow at a CAGR of 7.54% through 2031, making it the fastest-growing segment. This growth is driven by the increasing availability of premium coffee options in a variety of settings. Consumers now prefer easy access to high-quality coffee throughout the day, whether at work, on the go, or at casual outlets. As these establishments improve their coffee quality and expand their beverage offerings, they are likely to capture a larger share of the out-of-home coffee market.

Geography Analysis
In 2025, Europe accounted for 38.47% of the global foodservice coffee market, making it the largest regional market by value. This dominance is due to the region's strong coffee traditions, a wide network of cafés, and high per-person coffee consumption. Countries like Germany, the United Kingdom, France, and Italy are major contributors, with consistent demand for both independent and chain coffee outlets. The growing preference for premium, specialty, and sustainably sourced coffee is further driving market growth in Europe.
The Asia-Pacific region is expected to grow the fastest in the foodservice coffee market, with a 8.04% CAGR from 2026 to 2031. Rapid urbanization, higher disposable incomes, and exposure to global coffee trends are boosting coffee consumption in countries such as China, India, Indonesia, and Vietnam. Younger consumers are increasingly visiting cafés for social experiences and premium coffee options. The expansion of international coffee chains and the emergence of local brands are further accelerating the market's growth in this region.
North America, South America, the Middle East, and Africa are becoming important regions for growth and innovation in the foodservice coffee market. North America remains highly competitive, with global chains, drive-thru formats, and convenience-focused outlets introducing new products and using digital platforms to attract customers. South America benefits from its coffee-producing heritage and a growing café culture. Meanwhile, the Middle East and Africa are seeing rising coffee consumption due to urbanization, the growth of specialty coffee concepts, and investments in modern foodservice infrastructure. These regions are creating new opportunities and diversifying the global market landscape.

Competitive Landscape
The foodservice coffee market is dominated by a few major players, including Nestlé S.A., Keurig Dr. Pepper Inc., Starbucks Corporation, Luigi Lavazza S.p.A., and JDE Peet’s N.V. These companies hold strong positions due to their well-known brands, extensive supply networks, and wide distribution reach. Large operators benefit from their ability to scale operations efficiently and maintain strong relationships with suppliers. However, smaller independent cafés and regional chains also play a significant role by offering unique experiences and locally tailored products. This creates a competitive balance between large global brands and smaller niche players.
Technology and customer engagement are becoming critical factors for success in the foodservice coffee market. Leading companies are focusing on digital tools like loyalty programs, mobile ordering apps, and digital payment systems to attract and retain customers. They are also using data analytics to understand customer preferences, improve promotions, and streamline operations. Smaller businesses are also adopting these technologies to stay competitive and build stronger connections with their customers. The use of technology is helping both large and small players adapt to changing consumer expectations and market trends.
Expanding into new markets and refining brand strategies are key priorities for companies in the foodservice coffee market. Major coffee chains are entering fast-growing urban areas through company-owned stores, franchise models, and partnerships. They are also diversifying their offerings by introducing premium coffee options, specialty drinks, and innovative store formats to appeal to a broader audience. On the other hand, independent cafés are focusing on artisanal products, sustainability practices, and building strong ties with local communities. This dual approach ensures that both global brands and smaller operators remain relevant and competitive in the evolving market landscape.
Foodservice Coffee Industry Leaders
-
JDE Peet’s N.V.
-
Keurig Dr Pepper Inc.
-
Luigi Lavazza S.p.A.
-
Starbucks Corporation
-
Nestlé S.A.
- *Disclaimer: Major Players sorted in no particular order

Recent Industry Developments
- May 2026: Dunkin' partnered with Foodtastic through a franchise agreement to facilitate its return to the Canadian market. This collaboration aimed to establish hundreds of new locations across Canada, marking a significant step in Dunkin's international growth strategy.
- March 2026: Qaffeine Bistro, operated by the Ohris Group, opened in Hyderabad, showcasing its unique “Baaghini Blend.” This blend combined coffee beans from various Indian coffee-growing regions into a specialty product.
- February 2026: Luckin Coffee celebrated a significant milestone by opening its 30,000th store, unveiling its first Origin Flagship location in Shenzhen. This new flagship store emphasized the brand's commitment to offering high-quality, globally sourced coffee while enhancing customer experiences.
- September 2025: Nestlé Professional introduced the NESCAFÉ Barista range, a whole-bean coffee line designed for foodservice businesses, including independent cafés and quick-service restaurants.


Global Foodservice Coffee Market Report Scope
Foodservice coffee refers to coffee beverages prepared and served in commercial establishments, such as cafés, coffee shops, restaurants, hotels, convenience stores, and institutional foodservice outlets, for immediate consumption. The global foodservice coffee market is classified into outlet type, service format, end use, and geography. Based on outlet type, the market is classified into chain and independent outlets. Based on service format, the market is classified into dine-in, takeaway, and delivery. Based on end use, the market is classified into coffee shops and cafés, quick-service restaurants (QSRs), full-service restaurants (FSRs), hotels and resorts, and others. Based on geography, the market is classified into North America, Europe, Asia-Pacific, South America, and the Middle East and Africa. The market forecasts are provided in terms of value (USD).
| Chained |
| Independent |
| Dine-In |
| Takeaway |
| Delivery |
| Coffee Shops and Cafés |
| Quick-Service Restaurants (QSRs) |
| Full-Service Restaurants (FSRs) |
| Hotels and Resorts |
| Others |
| North America | United States |
| Canada | |
| Mexico | |
| Rest of North America | |
| Europe | Germany |
| United Kingdom | |
| Italy | |
| France | |
| Spain | |
| Poland | |
| Belgium | |
| Sweden | |
| Rest of Europe | |
| Asia-Pacific | China |
| Japan | |
| India | |
| Australia | |
| Indonesia | |
| South Korea | |
| Thailand | |
| Singapore | |
| Rest of Asia-Pacific | |
| South America | Brazil |
| Argentina | |
| Colombia | |
| Chile | |
| Peru | |
| Rest of South America | |
| Middle East and Africa | South Africa |
| Saudi Arabia | |
| United Arab Emirates | |
| Nigeria | |
| Egypt | |
| Morocco | |
| Turkey | |
| Rest of Middle East and Africa |
| By Outlet Type | Chained | |
| Independent | ||
| By Service Format | Dine-In | |
| Takeaway | ||
| Delivery | ||
| By End Use | Coffee Shops and Cafés | |
| Quick-Service Restaurants (QSRs) | ||
| Full-Service Restaurants (FSRs) | ||
| Hotels and Resorts | ||
| Others | ||
| By Geography | North America | United States |
| Canada | ||
| Mexico | ||
| Rest of North America | ||
| Europe | Germany | |
| United Kingdom | ||
| Italy | ||
| France | ||
| Spain | ||
| Poland | ||
| Belgium | ||
| Sweden | ||
| Rest of Europe | ||
| Asia-Pacific | China | |
| Japan | ||
| India | ||
| Australia | ||
| Indonesia | ||
| South Korea | ||
| Thailand | ||
| Singapore | ||
| Rest of Asia-Pacific | ||
| South America | Brazil | |
| Argentina | ||
| Colombia | ||
| Chile | ||
| Peru | ||
| Rest of South America | ||
| Middle East and Africa | South Africa | |
| Saudi Arabia | ||
| United Arab Emirates | ||
| Nigeria | ||
| Egypt | ||
| Morocco | ||
| Turkey | ||
| Rest of Middle East and Africa | ||


Key Questions Answered in the Report
What is the current size of the global foodservice coffee sector?
The foodservice coffee market stands at USD 555.13 billion in 2026 and is forecasted to reach USD 738.34 billion by 2031,growing at a CAGR of 5.87% during the forecast period.
Which region leads global demand for out-of-home coffee?
Europe led in 2025 with 38.47% share, supported by mature café infrastructure and strong daily coffee habits, especially in markets such as Germany.
Which region is growing the fastest through 2031?
Asia-Pacific is the fastest-growing region, projected to expand at a CAGR of 8.04% through 2031, driven by urbanization, rising middle-class incomes, and the rapid expansion of coffee chains across key markets.
Which outlet type has the strongest position?
Chained outlets led in 2025 with 62.83% share because they have stronger procurement scale, standardized systems, and deeper digital loyalty platforms.
Page last updated on:


